

 Download:


-
Global climate change has had a negative impact on the physical health of populations worldwide, with heatwave events causing significant human mortality and morbidity (1). The formation of an early warning system for health risks induced by heatwaves is vital, as it facilitates proactive measures by public health practitioners and public individuals. Current methodologies have developed various systems that provide advance warning several days ahead, effectively lessening heat-related dangers (2-6). The adoption of long-term pre-warning measures aids in preparing individuals and policymakers to take informed actions to reduce potential risks.
Despite the initial success of these long-term heatwave predictions, there remains a notable deficit in the provision of a health-risk warning system that covers the sub-seasonal to the seasonal scales (spanning two weeks to two months). The aim of this paper is to present a system that successfully addresses this gap.
By incorporating the China heatwave-attributable mortality model (7-8) with real-time temperature forecasts from the China Meteorological Administration-Climate Prediction System (CMA-CPSv3), this system provides up-to-date estimates of mortality rates and burdens for the forthcoming two months. As such, this system is poised to serve as a valuable tool for public health practitioners, enabling them to better plan personnel deployments and effectively allocate resources.
This study aims to combine heatwave events and health-risk assessment tools by using real-time, rolling temperature data projected for the subsequent 60 days from the advanced CMA-CPSv3 prediction system. Notably, the CMA-CPSv3 applies the enhanced resolution version of the Beijing Climate Center Climate System Model (BCC-CSM2-HR), recognized for its accuracy in predicting high temperatures within China (9). Initially, we commenced by systematically rectifying the temperature components produced by the CMA-CPSv3. A series of at least 3 days during the summer months (May to September) when the daily peak temperature surpasses the 92.5th percentile of the reference period (1961–2020) is characterized as a heatwave.
We utilized the nationwide heatwave-attributable mortality model established by Chen et al. (7-8) to analyze the health risks associated with heatwaves, including related mortality burden and death rate. This model investigates the specific exposure-response functional relationships between heatwaves and ensuing deaths across different climate zones using generalized linear models and meta-analysis. Estimations of mortality burden ascribed to heatwaves employ risk appraisals applicable to respective gridded heatwave series and nationwide mortality. The model considers factors such as population size, mortality rate, heatwave frequency, and exposure-response dynamics. By integrating the computed heatwave day data into the model, we ascertained the death burden and death rate due to heatwave-induced fatalities (depicted as gridded mortality burden per million population). A representation of this approach is illustrated in Figure 1.
 Figure 1.
Flow diagram illustrating the operational process of the early warning system.
Abbreviation: RCMs=regional climate models; RCP=representative concentration pathways; SSP=shared socio-economic pathway; CMIP=coupled model intercomparison project; RR=relative risk; AF=attributable fraction; DMT=daily maximum temperature.Table 1, issued on July 1, 2022, provides estimates for the number of heatwave days expected in China over the subsequent two months. Data indicate a higher projection of heatwave days for July in regions like Western Sichuan, Chongqing, and other areas of Central China, with more than 20 heatwave days predicted per month. Similarly, nearly 20 days of heatwave occurrences were estimated for Northwest China, inclusive of areas such as Ningxia and Xinjiang. Moving into August, the northern reaches of Northeast China forecast an increased frequency of heatwave days, with most regions predicted to experience over 20 such days per month on average. Of particular note is the Yangtze River Basin, which endured the most intense heatwave event ever recorded in the late summer of 2022 (10). As outlined in Table 1, this model accurately predicted this distinct pattern a month in advance.
Heatwave days Heatwave-induced death burden Heatwave-induced death rate 0–30 days 31–60 days 0–30 days 31–60 days 0–30 days 31–60 days PLAD Value PLAD Value PLAD Value PLAD Value PLAD Value PLAD Value Chongqing 20.63 Anhui 20.01 Henan 3,530 Henan 3,402 Xinjiang 17,318 Xinjiang 21,003 Ningxia 19.25 Xinjiang 19.72 Shaanxi 1,817 Sichuan 1,750 Inner Mongolia 9,119 Inner Mongolia 12,471 Shaanxi 19.10 Chongqing 16.26 Sichuan 1,809 Anhui 1,666 Gansu 6,498 Gansu 4,418 Gansu 18.48 Hebei 15.61 Hubei 1,498 Hubei 1,663 Qinghai 4,588 Heilongjiang 4,060 Qinghai 18.44 Henan 14.79 Shandong 1,050 Jiangsu 1,331 Shaanxi 3,682 Henan 2,412 Hebei 18.00 Guizhou 14.76 Gansu 959 Shandong 1,316 Xizang 3,199 Qinghai 2,335 Xinjiang 17.00 Hunan 12.94 Anhui 941 Shaanxi 893 Sichuan 2,851 Sichuan 2,113 Sichuan 15.63 Inner Mongolia 12.85 Shanxi 736 Xinjiang 804 Henan 2,571 Hubei 1,837 Henan 15.45 Jiangsu 12.30 Xinjiang 608 Inner Mongolia 642 Heilongjiang 2,268 Shaanxi 1,751 Anhui 12.14 Gansu 12.09 Inner Mongolia 525 Heilongjiang 603 Hubei 2,085 Anhui 1,452 Table 1. Top 10 provincial-level administrative divisions (PLADs) by number of heatwave days, resulting death burden, and death rate.
The projected results were released on July 1, supplemented by real-time daily forecasts for one-month duration heatwave days in the summer of 2022. Figure 2 compares estimated and actual data, with solid lines reflecting observed data and dashed lines illustrating CMA-CPSv3 predictions. The figure demonstrates CMA-CPSv3’s effective prediction of heatwave events during the summer of 2022. Accurate forecasting of heatwave days forms the basis for dependable subsequent estimations of heatwave health risks.
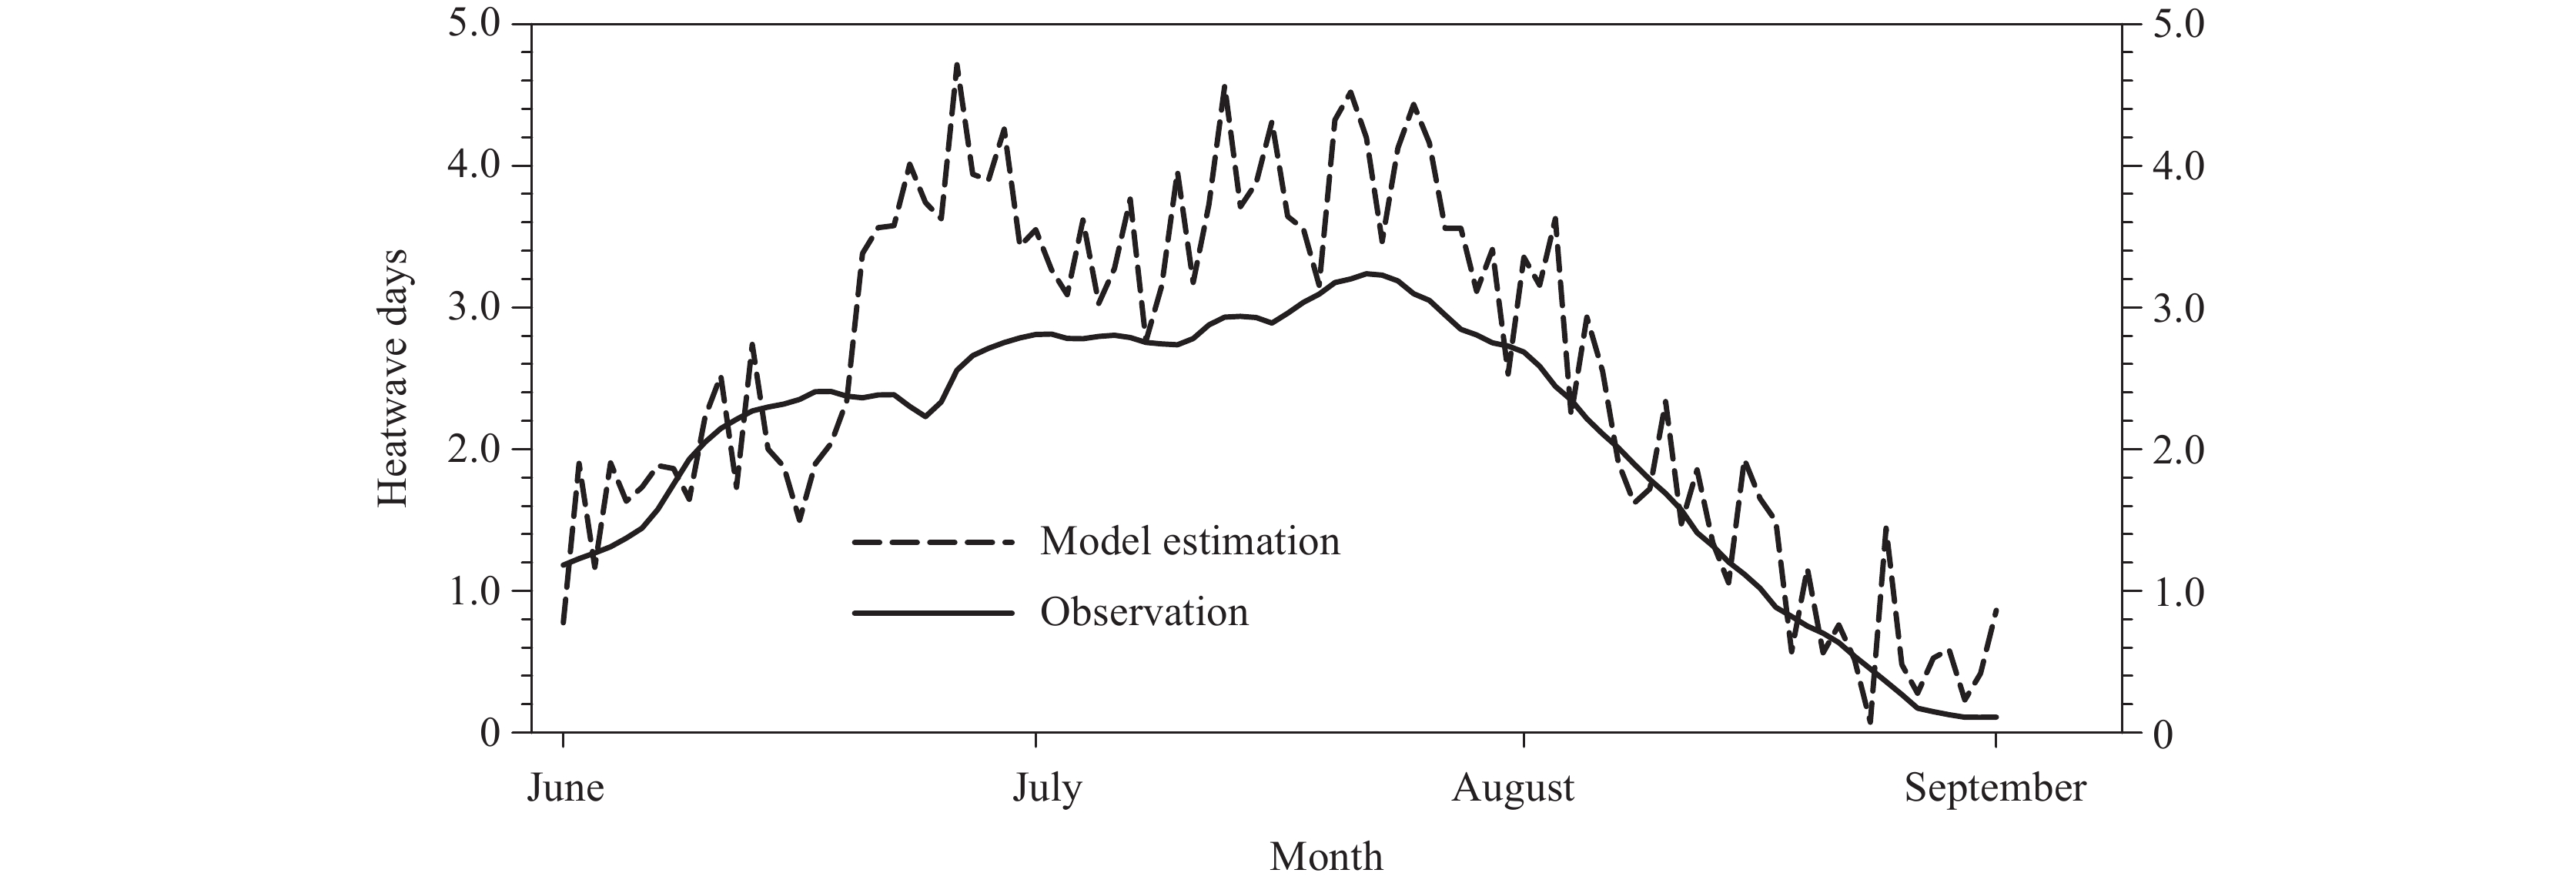 Figure 2.
Comparison of the average heatwave days predicted over the next 30 days in China (dashed curve) with actual observations (solid curve).
The study provided an analysis of the mortality rate due to heatwaves in July and August 2022, as depicted in Table 1. When contrasted with heatwave occurrences, the distribution of heatwave-related mortality correlates strongly with heatwave patterns in central China. Henan and Sichuan, both populous provinces, recorded the highest mortality rates due to heatwaves, with approximately 3,400 and 2,000 deaths respectively. Upon conducting a subgroup analysis, cardiovascular diseases (CVD) emerged as the leading cause of heatwave-induced mortality, contributing to an estimated 80% of the cases. Further, seniors and females were found to be at a relatively higher risk, accounting for around 75% and 70% of cases respectively.
The mortality burden indicator can enable policymakers and public health practitioners to allocate resources effectively. Nonetheless, it is crucial to acknowledge that the impact of the mortality burden during heatwaves is related to the local population size, which may limit its relevance on an individual basis. Therefore, this indicator also includes a heatwave-related mortality rate, derived from the mortality burden per million people during heatwaves. Over a span of two months, the highest risk was observed in Xinjiang, with an estimated heatwave-related mortality risk of about 20,000 per million individuals monthly. This was closely followed by Inner Mongolia, which had a risk estimated at 10,000 individuals per million monthly. Notably, the risk in August surpassed that of July.
-
This study presents two results within the sub-seasonal to a seasonal early warning system for heatwave-related health risks: death burden and death rate. These results can be beneficial for a variety of users. For policymakers and public healthcare practitioners, the distribution of heatwave incidents and a ranking system for province-wide mortality burden due to heatwaves can help inform the scope of heatwave impacts, prioritize critical areas, and effectively allocate resources. For individual users, the mortality rate due to heatwaves gives a more precise understanding of an individual’s risk during a heatwave event, assisting in making well-informed travel plans and activity scheduling.
The two outputs show variations in detail when compared with the prediction of heatwave days. For instance, while the northeastern and northwestern regions of China experience more heatwave days, they show a lower heatwave-induced mortality burden due to their lower population densities. The heatwave-induced mortality rate provides a more accurate representation of the effect of heatwave duration on individuals. As expected, higher heatwave mortality rates align with the predicted heatwave days in the northeastern and northwestern regions. However, despite the high number of heatwave days in Sichuan-Chongqing, there is no significant increase in heatwave-induced mortality rate. This is likely due to the region’s higher adaptive capacity to high temperatures, as its population has been exposed to such conditions for a long period of time. Consequently, despite experiencing the same number of heatwave days as in other regions, the risk in Sichuan-Chongqing is lower than in the northeastern and northwestern regions of China.
This study possesses numerous limitations. Predominantly, the CMA-CPSv3 data estimation appeared to slightly exaggerate the quantity of heatwave days in July. Further, the all-encompassing model for heatwave-related mortality utilized in this study does not accommodate prospective shifts in population exposure and vulnerability. Additionally, the hypothesized burden of heatwave deaths lacks substantiation through real-time mortality data. To address these limitations, the following remedies are suggested. 1) The improvement of climate model predictive capabilities is imperative. The enhancements presented with the development of the BCC-CSM2-HR model will allow for greater accuracy in the data derived from CMA-CPSv3. 2) The usage of multi-year estimation results for adjustments is advocated. The CMA-CPSv3 system, applied in this study, underwent certain modifications. Nonetheless, its efficacy is limited during months of extremely high temperatures due to the inadequate representation of such extreme conditions in the correction dataset. However, the performance of the modification is projected to improve as more estimated data from CMA-CPSv3 becomes available. 3) It is crucial to frequently update the nationwide model of mortality attributable to regional heatwaves to accurately depict the changing exposure and vulnerability of the population. 4) The enhancement of cross-disciplinary collaboration is of the utmost importance. This includes promoting a closer cooperation with the China CDC for the exchange of real-time mortality data and the validation of the system’s outputs. Such collaboration will significantly contribute to the improvement of the system’s performance.
In conclusion, the early warning system for health risks induced by sub-seasonal to seasonal heatwaves offers timely and quantitative assessments of both the impact magnitude and risk levels linked to heatwaves in China. This tool accommodates a broad spectrum of users and delivers crucial insights.
-
No conflicts of interest.
-
Chinese Center for Disease Control and Prevention and Tsinghua University Vanke School of Public Health (SPH).
HTML
| Citation: |

|