

 Download:


-
The life expectancy (LE) in China increased dramatically from 73.0 years in 2005 to 77.93 years in 2020 (1). With the mortality rate of children under 5 years old having dropped to a relatively low level (2), the key force for LE increase thus shifts over to the population of those 60 years old and older (3). In addition, China has undergone a rapid epidemiological transition in the past few decades: from an infectious-disease-based model to a double-threat model of emerging infectious diseases and chronic diseases. Four major chronic diseases, including circulatory diseases (CDs, I00-I99), cancers (CAs, C00-D48), respiratory diseases (RDs, J00-J99) and diabetes (DM, E10-E14) cause most of the chronic disease deaths in China (4). However, comprehensive analysis on mortality rates of the four major chronic diseases, and their contributions to overall LE in China’s elderly population, is scarce.
To reveal the impact of the four major chronic diseases on LE in China for those over 60, this study evaluated the trend of the mortality rate of CDs, CAs, RDs and DM. Further, it conducted Arriaga’s decomposition method to quantify the impact of disease on LE for those over 60, the results of which were sorted across nationwide, urban and rural areas respectively.
Information of age-specific all-cause mortality was primarily obtained from the death registration system of the National Health Commission (NHC) of China, where mortality records from five administrative organizations (including the death medical certificate information and the total population information from the Department of Health; the registered permanent residence cancellation information from the Department of Public Security; the cremation information from the Department of Civil Affairs; and the termination of social security information from the Department of Social Security) were integrated after the quality control of identification numbers and duplication removal. The underreporting rate of the whole population was 2.0% and 5.1% in 2017 and 2018 respectively. Detailed information was described thoroughly in this study’s authors’ previous studies (5-6). This study further obtained the annual population counts by age from the National Bureau of Statistics (NBS). Chiang’s method was adopted to estimate the LE at 60, based on period abridged life tables with 19 groups in mostly 5-year age intervals. Then, the overall and cause-specific mortality rates (including circulatory diseases, cancers, respiratory diseases, and diabetes) for both urban and rural areas were estimated by dividing the national all-cause mortality rates by their specific proportions of total deaths from the Chinese Health Statistics Yearbook in 2005, 2010, 2015, and 2020, respectively. The classification criteria of urban/rural areas were consistent with the Chinese Health Statistics Yearbook, where urban areas include municipalities and prefecture-level municipal districts, and rural areas include counties and county-level cities.
The Arriaga’s decomposition method was applied to decompose changes in LE at 60 during 2005–2020 by age and cause of death. In brief, the method decomposed mortality into direct, indirect, and interaction effects. For calculation, the formula could be shown as:
$$ {{}_{n}\Delta }_{x}^{}=\frac{{l}_{x}^{\;1}}{{l}_{0}^{\;1}}\times \left(\frac{{{}_{n}L}_{x}^{2}}{{l}_{x}^{\;2}}-\frac{{{}_{n}L}_{x}^{1}}{{l}_{x}^{\;1}}\right)+\frac{{T}_{x+n}^{\;2}}{{l}_{0}^{\;1}}\times \left(\frac{{l}_{x}^{\;1}}{{l}_{x}^{\;2}}-\frac{{l}_{x+n}^{\;1}}{{l}_{x+n}^{\;2}}\right) $$ (1) where
$ {{}_{n}\Delta }_{x}^{} $ is the age-specific change of LE between time points 1 and 2;${l}_{x}^{\;1}$ or$ {l}_{x}^{\;2}$ denotes survivor numbers at age x at time point 1 or 2;${{}_{n}L}_{x}^{\;1}$ or$ {{}_{n}L}_{x}^{\;2} $ denotes person-years lived between age$ x $ and$ x + n$ at time point 1 or 2;${T}_{x+n}^{\;2}$ denotes person-years lived after age x.The cause-specific contribution was accordingly calculated as:
$$ {{}_{n}\Delta }_{x}^{i}={{}_{n}\Delta }_{x}^{}\times \frac{{{}_{n}m}_{x}^{i}\left(2\right)-{{}_{n}m}_{x}^{i}\left(1\right)}{{{}_{n}m}_{x}^{}\left(2\right)-{{}_{n}m}_{x}^{}\left(1\right)} $$ (2) where
$ {{}_{n}m}_{x}^{i}\left(1\right) $ or$ {{}_{n}m}_{x}^{i}\left(2\right) $ indicates the mortality rates of disease$ i $ at time point 1 or 2,$ {{}_{n}m}_{x}^{}\left(1\right) $ or$ {{}_{n}m}_{x}^{}\left(2\right) $ indicates the all-cause mortality rates at time point 1 or 2.All the statistical analyses were performed with R version 3.6.3 (R Foundation for Statistical Computing, Vienna, Austria) and Microsoft Excel (Version 2008 Build 16.0.15601.20148. Microsoft, Redmond, Washington, United States).
As is shown in Table 1, LE at birth in China reached 77.93 years in 2020, with an increase of 4.83 years from 2005, of which 26.43% was attributed to reductions in mortality rates of children under 5 years and 45.02% was attributed to reductions in mortality rates of those aged over 60 years. More specifically, a remarkable shift in age-specific contributions was observed during the past 15 years, which indicated that the health status of the elderly has an increasingly important impact on LE improvements in China. From 2005 to 2010, the remarkable reduction in child mortality rates accounted for a 39.64% increase in LE, while the contribution was weakened to 7.75% during 2015–2020. On the other hand, older persons aged over 60 years have gradually become the major population contributing to the increased LE, the contribution of which increased from 34.51% during 2005–2010 to 61.21% during 2015–2020.
Age groups 2005–2020 2005–2010 2015–2020 0– 26.43 39.64 7.75 5– 28.55 25.85 31.04 ≥60 45.02 34.51 61.21 Table 1. Contributions of mortality reduction among different age groups to increase in life expectancy from 2005 to 2020 (%).
Moreover, this study observed a sustained downward tendency in mortality rates of respiratory diseases for all age groups over 60 years from 2005 to 2020, and the declining rates slowed down as age increased: from −79% for individuals aged 60–65 years to −56% for those aged over 85 years. The mortality rates of circulatory diseases also declined for those aged 60–85 years, while there was an upward tendency among the elderly over 85 years, which increased from 7,836.86 /100,000 in 2005 to 9,793.69/100,000 in 2020. A similar trend was observed for mortality rates of cancers, which declined in the 60–80 age group while increased among those aged over 80 years. Despite the general decreasing trend in mortality rates of major chronic diseases, a modest rise was found for diabetes in all age groups over 60 years (Figure 1).
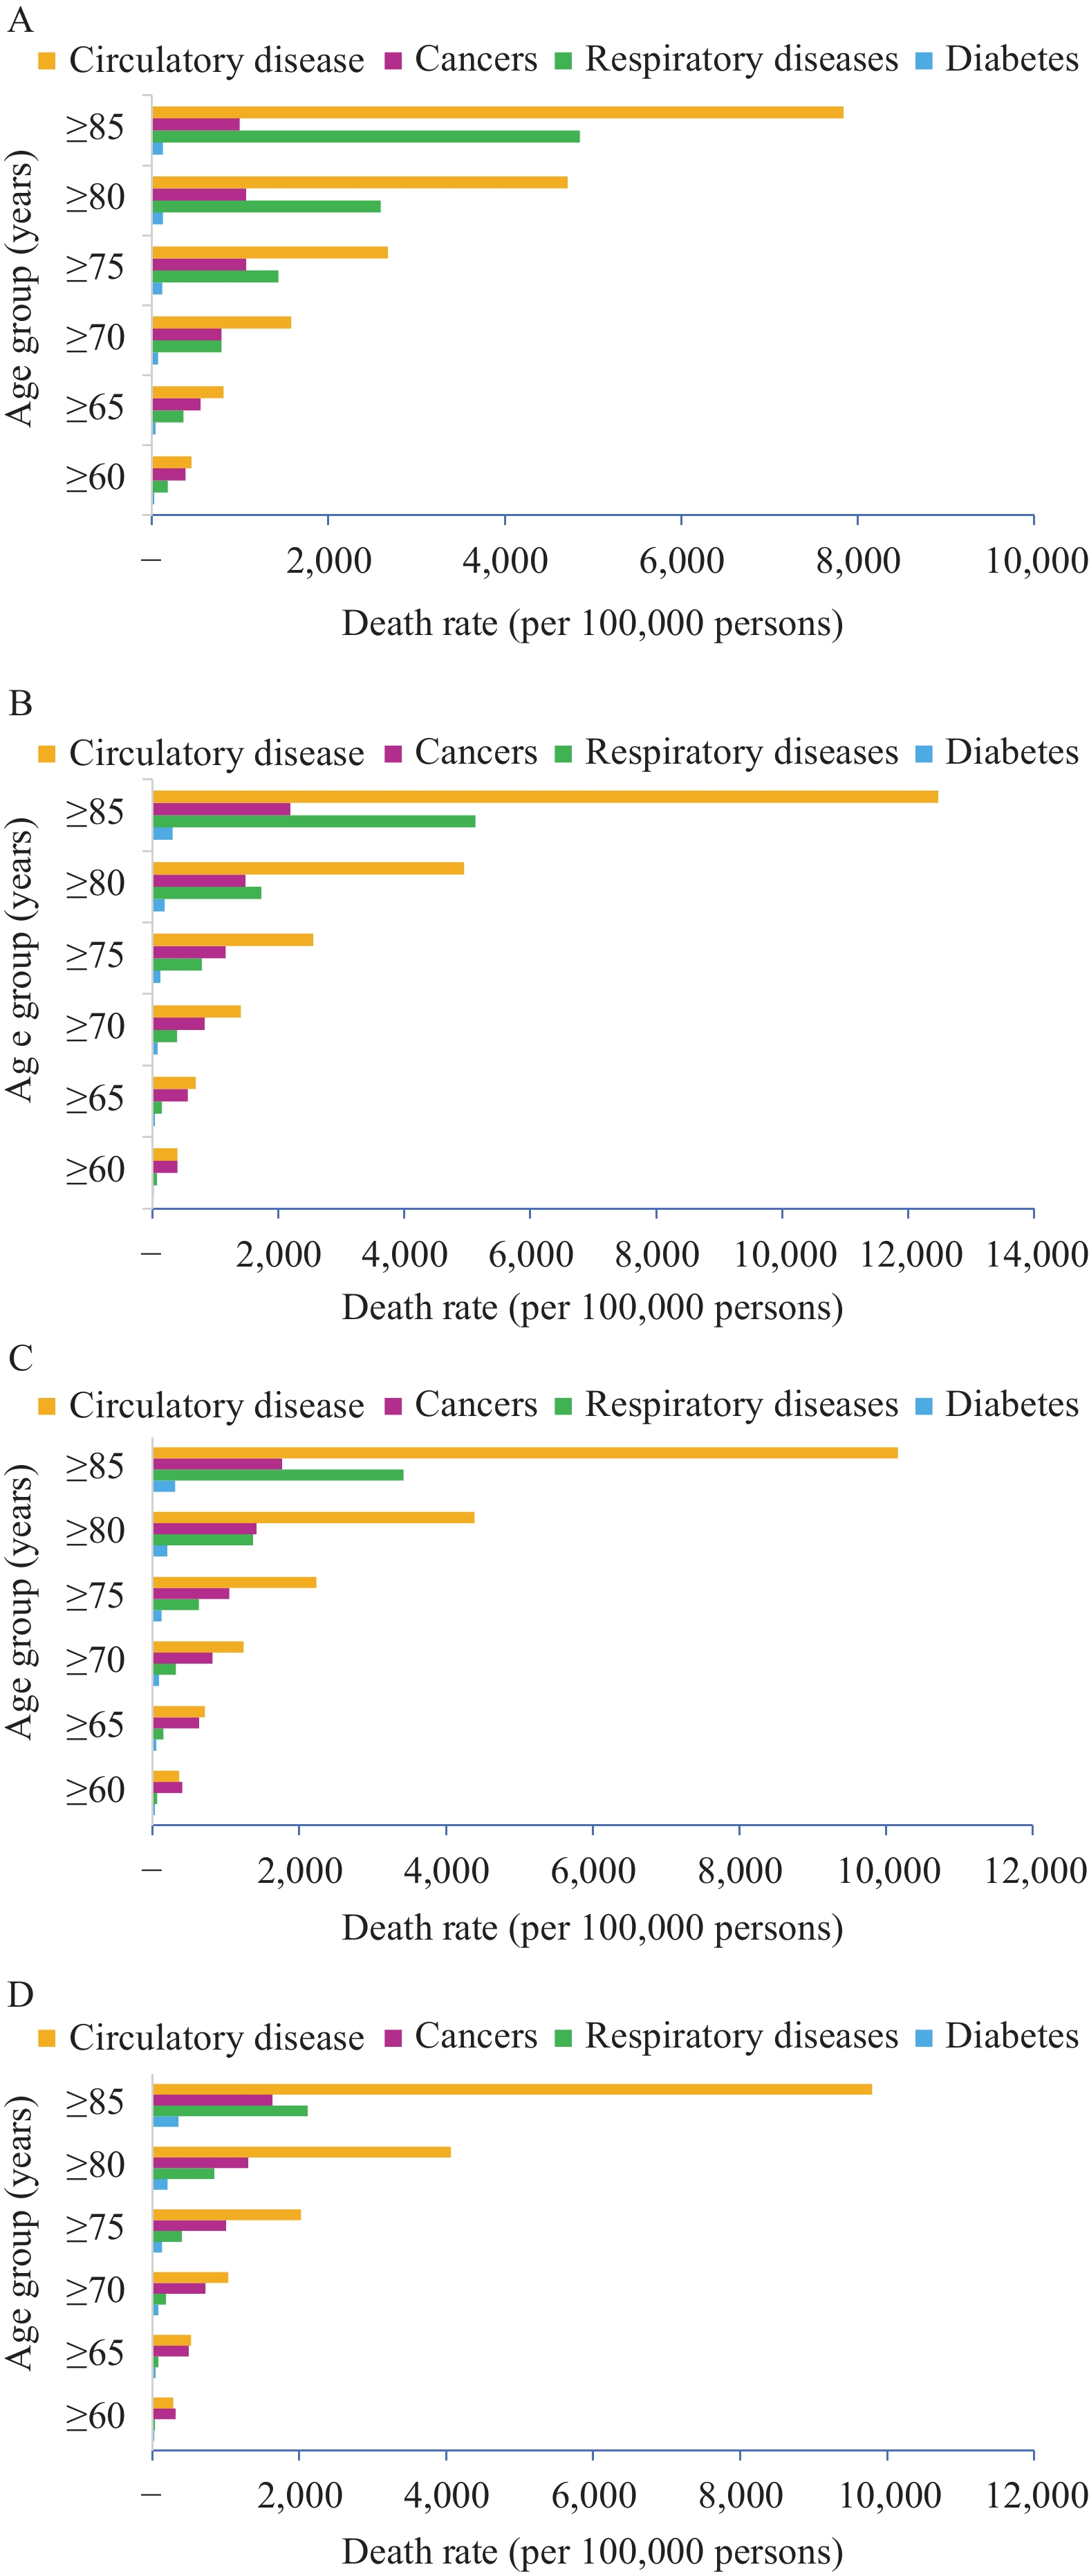 Figure 1.
Trends in the mortality rates of population aged over 60 years for major chronic diseases in China in (A) 2005, (B) 2010, (C) 2015, and (D) 2020, respectively.
Improvements of LE attributed to the four above-mentioned major chronic diseases were presented in Figure 2 and
Supplementary Table S1 , organized by nationwide and by rural or urban area data. As a whole, reductions in mortality rates for the population aged over 60 years for major chronic diseases contributed to 2.06 years of LE increase at 60 years in the urban areas, which was much larger than that in rural areas (1.20 years). More specifically, reductions in mortality rates of respiratory diseases (1.26 years) contributed the most to the increase in LE, followed by circulatory diseases (0.57 years). Contrastingly, the impacts of diabetes (−0.05 years) and cancers (−0.03 years) were found to be negative during the past 15 years. Figure 2.
Contributions of major chronic diseases to changes in LE at 60 in (A) nationwide, (B) rural, and (C) urban — China, 2005–2020.
Abbreviation: LE=life expectancy.Furthermore, we observed a significant shift in cause-specific contributions from 2005 to 2020. During 2005–2010, it was only reductions in the mortality rates of respiratory diseases that accounted for the increase in longevity, while, during the previous 5 years, major chronic diseases (excepting diabetes) contributed to the improvement of LE in China (respiratory diseases: 0.39 years, circulatory diseases: 0.36 years, and cancers: 0.23 years).
-
This study provides up-to-date evidence of the temporal trend in mortality of four major chronic diseases and their impact on LE in the Chinese elderly population. A stable decline trend was observed for mortality rates due to RDs during the study period, while DM showed the opposite trend, which was consistent with findings in some developing countries (7). Further, the mortality rate of CAs and CDs both showed an uptrend from 2005 to 2010, and then kept descending between 2010 and 2020. The remaining diseases positively contributed to the increase of LE in the nationwide, urban, and rural areas.
The present study also indicates that the association between the four major types of chronic disease deaths and Chinese elder adults’ LE was notable. Generally, urban residents have gained more LE growth profit due to the reduction of the mortality of the four major chronic diseases, which was consistent with other studies (8).
In addition, this study’s comparison shows that the contribution to changes in LE at 60 in China decreased by 0.05 years, due to increase in diabetes-related deaths. The epidemic of diabetes is one of the most alarming public health issues of the 21st century, especially in lower-middle income countries (9). It was predicted that from 2010 to 2030, there will be a 67% increase in the prevalence of diabetes in developing countries (10). Diabetes is still the second largest factor affecting LE from a global perspective (11). To reduce the mortality and impact of diabetes, the population should exercise sensibly and develop healthy eating habits, and the state should provide care and treatment services to help diabetic patients with health management.
The population of China has aged rapidly and the rate will continue accelerating in decades to come. China should therefore pay more attention to the health condition of the elderly. This research’s results suggest China should devote more efforts to improve the health condition of elderly adults in China, especially those with chronic diseases. Beyond health spending, healthcare access, and the quality of health care, socio-demographic development may also be a key determinant of health outcomes (12). Therefore, a comprehensive health planning strategy is required.
This research has some limitations that need to be addressed. First, the results in this dataset are a summary of the number of deaths reported at each monitoring point. No adjustment has been made for under-reporting; therefore, the results of the calculation may be biased. Second, this study’s decomposition was based on Arriaga’s decomposition method, which did not provide a confidence interval. In addition, the cause-specific mortality rates were from the Chinese Health Statistics Yearbook, and the ICD codes of RDs were from J00 to J99 including acute respiratory infection. Considering the mortality rate of acute respiratory infection was very low, this study assumed it would not impact the results significantly. Additionally, LE only reflects the length of life, not the quality of life. Therefore, to assess the impact of different diseases on the quality of life or the health of the population, more comprehensive indicators, such as healthy life expectancy (HLE), should be used in future studies.
Diseases 2005–2020 2005–2010 2015–2020 Total Urban Rural Total Urban Rural Total Urban Rural Respiratory diseases 1.26 0.71 1.56 0.69 0.40 0.83 0.39 0.41 0.33 Circulatory diseases 0.57 1.19 −0.11 −0.01 0.66 −0.51 0.36 0.42 0.19 Cancers −0.03 0.15 −0.16 −0.26 −0.14 −0.34 0.23 0.31 0.12 Diabetes −0.05 0.01 −0.09 −0.04 0 −0.05 −0.01 0 −0.02 Residuals 0.34 0.5 0.19 0.18 0.35 0.04 0.05 0.06 0.02 Table S1. Contributions of four major chronic diseases to changes in life expectancy at 60 years in China, 2005–2020.
HTML


| Citation: |

|