

 Download:


-
Unintended allergen presence (UAP) not only poses risks for the food allergic population but is also a regular cause of food recalls with considerable costs associated with such actions. To enable food producers to make evidence-based decisions on the utility of Precautionary Allergen Labeling (PAL), it is necessary to determine the risk of the product to allergic consumers. The Netherlands Organization for Applied Scientific Research (TNO) developed a methodology to support authorities and industries in establishing reference amounts (RfA) when assessing the risk from UAP in food products (1). A case study was performed on the TNO framework based on Chinese national consumption data to derive the optimal food consumption point for a deterministic food allergy risk assessment (RA). It showed that the 95th–99th percentiles of the food consumption distribution per eating occasion for both Condiments and Chocolates were the optimal point estimates for use in meeting the safety objective of protecting 99% of allergic individuals from unintended peanut allergic reactions. This study provides an illustration of a good evidence-based study for consumption parameters in food allergen RA, and it is suggested more food groups should be analyzed applying this framework to verify the optimal point estimate for Chinese-specific RfAs.
A sensitivity analysis was performed to establish the optimal percentile of food consumption on a single eating occasion for food groups Condiments and Chocolates to meet the defined food safety objective for unintended peanut allergic reactions. Within this framework, exposure was calculated by both deterministic and probabilistic modeling and outcomes of the two RAs were compared. Optimal consumption percentiles in deterministic RA were defined as those which predicted an intake below the relevant reference dose (RfD) and met the defined acceptable risk level confirmed by probabilistic RAs. (Figure 1) (1-2) The RfD of 0.2 mg peanut protein in allergic food was proposed by Taylor et al. from the eliciting dose of 1% risk (ED01) from a large dataset of bibliographic data and unpublished clinical data (3). The deterministic RA provides an initial quantitative test, offering a binary answer: if the amount of peanut protein consumed is at or below the RfD, a product is considered to “pass” (green box), and the allergy risk is not deemed to require further mitigation; otherwise, the product “fails” (red box). The cut-off for probabilistic RA is the estimated percentage of allergic responders either at or below (green box) or above (red box) the defined risk level at the RfD (here indicated as ≤1% and >1%). The sensitivity analysis shows that, underestimation or overestimation of the risk by the deterministic RA occurs if too low or too high food consumption percentiles were used in the deterministic modeling. This allows us to verify that consumption percentiles do not lead to under- or over-estimation of the predefined risk level.
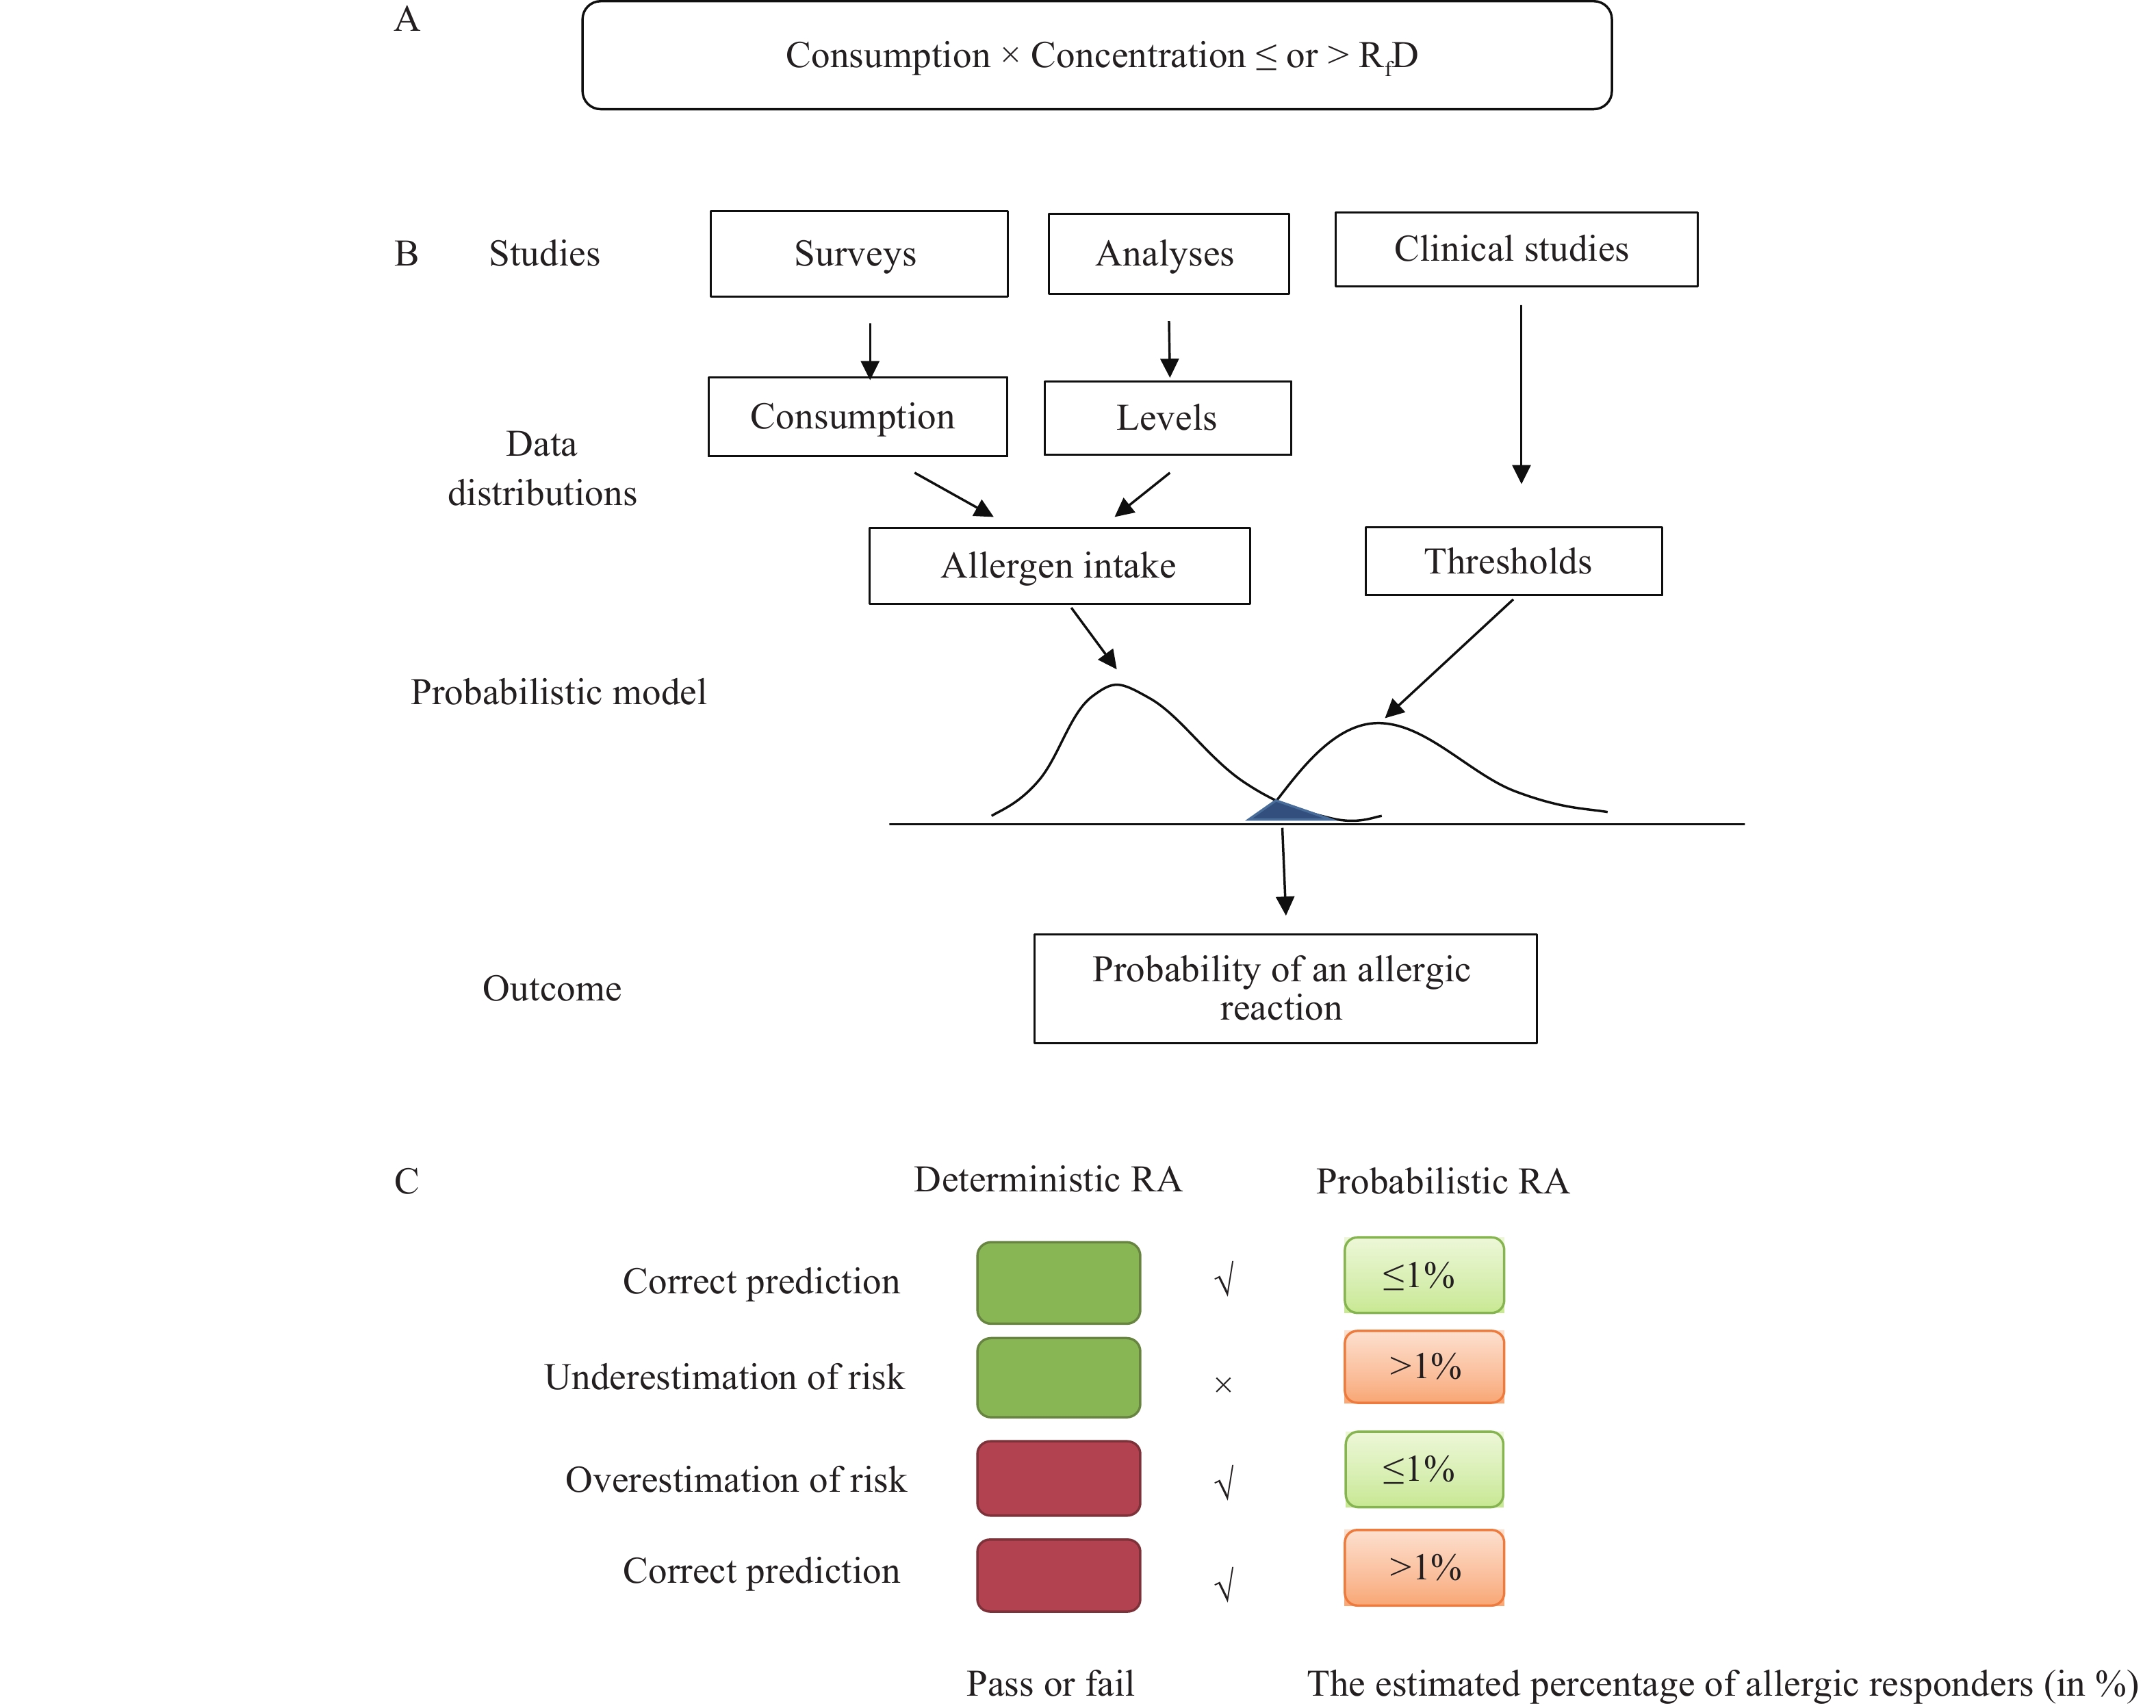 Figure 1.
Description of the sensitivity analysis to derive an optimal point estimate for allergen RA. (A) The formula for deterministic RA. (B) The schematic description of probabilistic RA. (C) The sensitivity analysis in which the outcomes of the two RAs are compared.
Note: The deterministic outcome is a binary answer: a product is considered to “pass” (green box in C) or “fail” (red box in C) by comparing the amount of allergenic protein consumed with the relevant RfD; The cut-off for probabilistic RA is the estimated allergic responders either at or below (light green box in C) or above (light red box in C) the defined risk level (here is 1%) at the RfD.
Abbreviation: RA=risk assessment; RfD=reference dose.
The food consumption data were obtained from Chinese National Nutrition and Health Survey in 2002 by 24 h recall method on three consecutive days. Multistage and random cluster samplings were used in the survey and 30 provincial-level administrative divisions (PLADs) were covered. This food consumption database provided the food consumption amount for each food item per eating occasion from 65,915 consumers aged 2–100 years in total. In this study, 4,290 eating occasions for Condiments and 144 eating occasions for Chocolates were included. The percentiles (P50 to maximum) of the consumption distribution for each food group were calculated as input values in the deterministic RA, while food consumption distribution from both parametric and non-parametric simulations was used for the probabilistic RA. As the contamination happens unintentionally during production, the concentration level is unknown. Ranges from 1 to 1,000 mg/kg of theoretical concentration (1, 3, 10, 30, 100, 300, 600, or 1,000 mg peanut protein/kg food products) were selected. These levels are typical concentrations found for UAP in food products in published surveys (1,4) and were chosen with a wide range to ensure that the allergen intakes would be both below and above the RfD. SAS (version 9.4, SAS Institute Inc., Cary, North Carolina 27513, USA.) was used to conduct all analyses.
The deterministic RA outcomes for the food group Condiments contaminated with different concentrations of peanut are shown in Figure 2A. The binary outcome predicts either that there is risk above (red) or at or below (green) the intended risk level. Figure 2B provides the risk estimated by both parametric and non-parametric probabilistic RA. For each concentration of peanut protein in Condiments, the percentage (%) of intakes exceeding the RfD in the population is estimated and the conclusion whether it is at or below (green) or exceeds (red) the given risk level (1%) is shown.
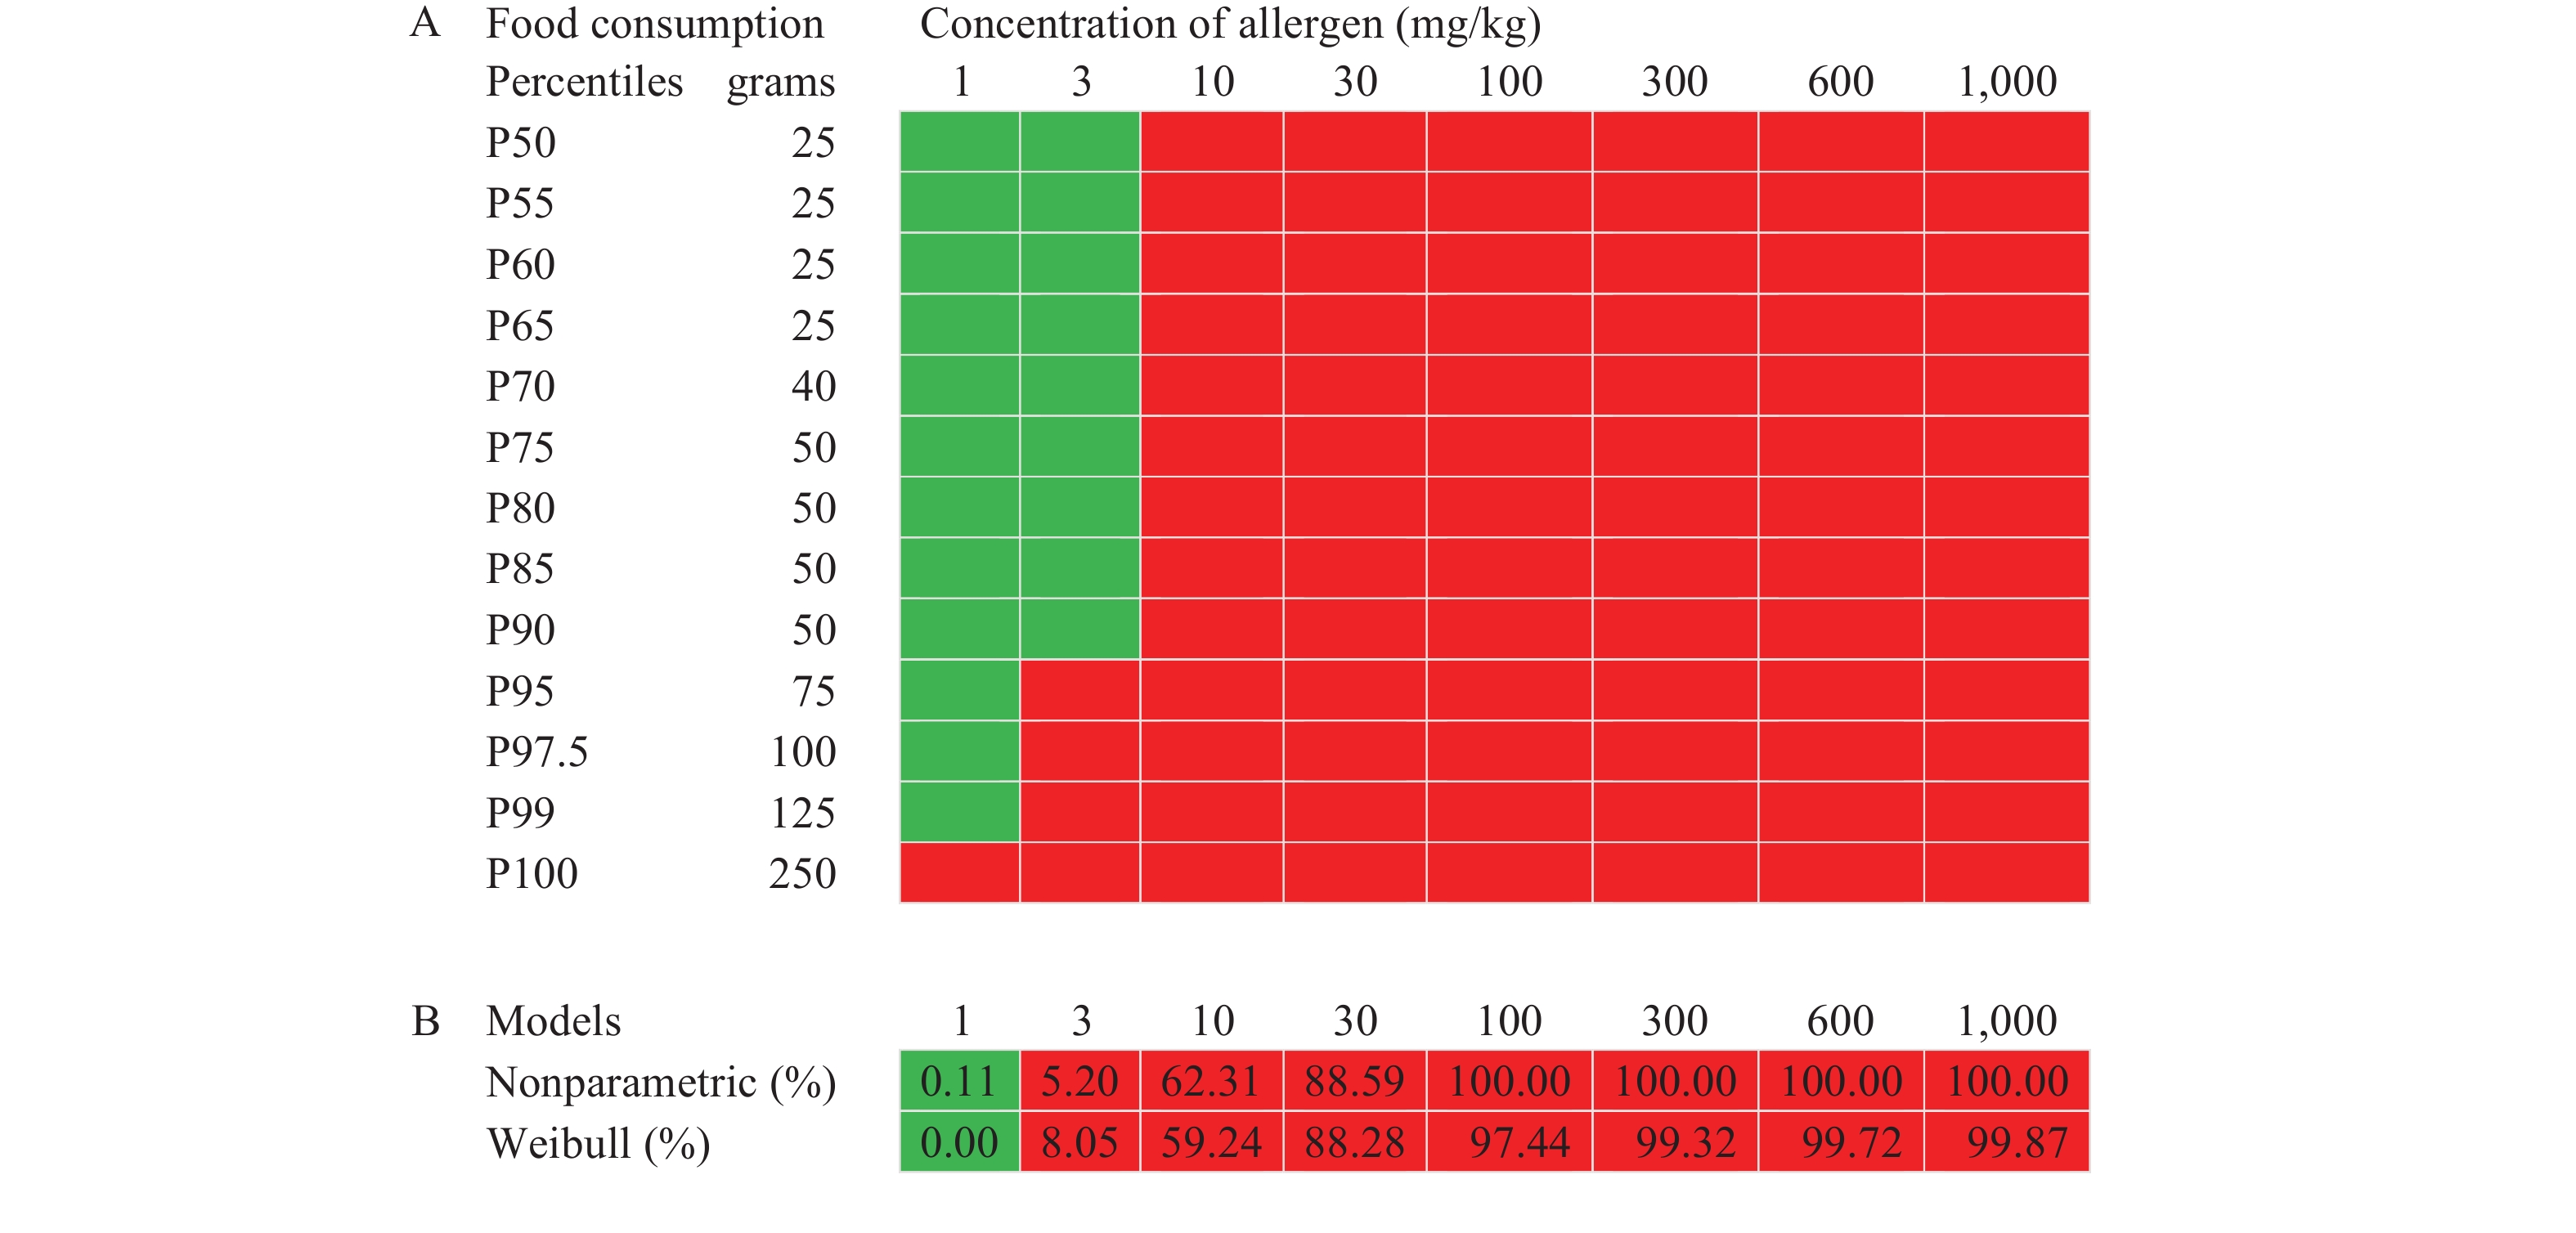 Figure 2.
Example peanut in Condiments for determination of the optimal percentile of the food consumption distribution. (A) Deterministic RA for peanut protein in Condiments. (B) The estimated risk for allergic responders (in %) at the different concentrations of peanut protein in Condiments using parametric and non-parametric probabilistic RA.
Note:The intake by deterministic model at or below the RfD dose of 0.2 mg peanut protein is shown in the green box. Otherwise, the red box is shown. For probabilistic models, in terms of green, the estimated risk is at or below the defined risk level (1%), and in terms of red, it is exceeding 1%.
Abbreviation: RA=risk assessment; RfD=reference dose.
Then, the optimal percentile of food consumption is identified that produces a deterministic RA outcome in compliance with the predefined risk level. In Figure 2, the estimated risk at 1 mg peanut protein per kilogram condiments is below the pre-defined risk level for both probabilistic models. Whereas, at 3 mg/kg both probabilistic models estimated a risk above the cut-off value, and the conclusion is that the product “fails” the RA according to the pre-defined criteria. The deterministic RA predicted this conclusion consistently for the percentiles 95th–100th at 3 mg/kg, whereas using P50 to P90 of the food consumption distribution would pose an underestimated exposure. At 1 mg/kg, the deterministic RA prediction was in agreement for the P50 to P99 of the food consumption distribution. Using the consumption values of P100 combined with 1 mg/kg, the deterministic RA was more conservative and predicted a risk above the pre-defined risk level.
The RA outcomes for peanut in Chocolates are presented in Figure 3. At 3 mg/kg peanut in chocolates, the estimated risk in the probabilistic approach is above the pre-defined risk level for both models. The deterministic RA predicted this conclusion consistently for the percentiles 85th–100th at 3 mg/kg, whereas using P50 to P80 of the food consumption distribution would pose an underestimate of exposure. At 1 mg/kg, the deterministic RA prediction was in agreement for the P50 to P99 of the food consumption distribution. Using the consumption values of P100 combined with 1 mg/kg, the deterministic RA was more conservative and predicted a risk above the pre-defined risk level.
 Figure 3.
Example peanut in Chocolates for determination of the optimal percentile of the food consumption distribution. (A) Deterministic RA for peanut protein in Chocolates. (B) The estimated risk for allergic responders (in %) at the different concentrations of peanut protein in Chocolates using parametric and non-parametric probabilistic RA.
Note: The intake by deterministic model at or below the relevant RfD of 0.2 mg peanut protein is shown in the green box. Otherwise, the red box is shown. For probabilistic models, in terms of green, the estimated risk is at or below the defined risk level (1%), and in terms of red, it is exceeding 1%.
Abbreviation: RA=risk assessment; RfD=reference dose.
In terms of this case study, it is concluded that the 95th–99th percentiles of food distribution could be the optimal points for use in deterministic RA, with which the outcome is in compliance with the probabilistic RA meeting the safety objective of protecting 99% of allergic individuals from objective allergic reactions to unintended allergic peanut presence and be adequately conservative from a public health context.
-
Methods proposed by TNO on recommendations for RfAs for foods based on allergen RA are applied to Chinese consumption data and the results show that the 95th–99th percentiles of the food consumption distribution per eating occasion for Condiments and Chocolates are the optimal point estimates for use in deterministic allergen RA meeting the safety objective of protecting 99% of allergic individuals from objective allergic reactions to unintended allergic peanut presence. This provides an illustration of a robust evidence-based study for food consumption parameters in food allergen RA. A diverse range of inputs is seen in practice, such as the large portion or maximum amounts to be “on the safe side”. These diverse formulations of consumption amounts lead to highly divergent quantitative risk estimates and substantial confusion in RA. To achieve one cohesive, agreed quantitative risk assessment approach has become a global trend for allergen management.
Blom et al. conducted such a sensitivity analysis with consumption data from three European countries, where the procedure was repeated for all food groups and allergens (480 combinations) and in total 1,344 RAs were performed and concluded that the 75th percentile of the food consumption distribution per eating occasion is the optimal estimate for use in meeting the safety objective of protecting 97%–99% of allergic individuals from objective allergic reactions to UAP (1). In addition, Blom et al. found the P75 of Ice cream consumption (100 grams) with an action level of 1 mg/kg hazelnut and the P70 of Spices and Salts consumption (2 grams) with an action level of 100 mg/kg peanut posed an allergy risk which did not require further mitigation. The RfA at 1 mg/kg was close to that in this study but with different percentiles.
Future public policy on PAL for specific products should consider both reference amounts and action levels that would trigger such labeling. In the present study, only the food groups Condiments and Chocolates with theoretical concentration levels were taken for an illustration of choosing evidence-based consumption parameters. Due to the differences of diet consumption patterns and potential changes, and the RfAs are food- and region- or country-specific, future studies need to broaden the scope to include more food groups consumed by Chinese consumers and allergens in this framework, where possible with update database, to verify the optimal point estimate for Chinese-specific RfAs. Besides, it was assumed that the food consumption pattern of allergic persons does not differ from that of the general population, which has been validated in the Dutch population (5). More studies are necessary for the Chinese population and emphasis should also be put on grouping food consumption data for use in food allergen RA under different circumstances (6). In addition, further recommendations and guidance for determination of the concentration of allergen for input to the RA could be beneficial for all stakeholders (1).
-
No conflicts of interest.
HTML
| Citation: |

|