

 Download:


-
According to the Seventh National Population Census in 2020, the life expectancy of the Chinese population has been gradually rising in the past 10 years (1). With China’s industrialization, urbanization, and rapidly aging population, behavioral changes, and environmental factors have a growing impact on health. The strategy based on “curing disease” cannot meet the public’s health needs.
Thus, in 2016, the “Program for a Healthy China 2030” announced by the Central Committee of the Chinese Communist Party. This is the first long-term health strategic plan at the national level since the founding of the People’s Republic of China. In 2019, in order to further implement the “Healthy China 2030” strategy, the State Council issued the “Healthy China Action Plan 2019–2030” and emphasizes “intervening in health influencing factors, protecting full-life-cycle health, and preventing and controlling major diseases”, highlights the concept of great health and focus on disease prevention and health promotion, and specifies the objectives and tasks of 15 unique campaigns (2).
Based on results of Burden of Disease Study in China up to 2019, we forecast the main health problems and disease burden of China in 2030, 2035, and 2050, aiming for the following: 1) update the prediction results of 2030 and assess the attainability of the “Healthy China 2030” goals; and 2) explore changes in the leading health problems of Chinese residents to put forward appropriate prevention and control suggestions by 2050.
We predicted the mortality rates, the premature mortality rate from 4 main non-communicable chronic diseases (NCDs), and life expectancy in the years 2030, 2035, and 2050 in the mainland of China. Using data from the Global Burden of Disease 2019 (GBD 2019), the variables included all-cause and cause-specific mortality, summary exposure value (SEV) of risk factors, the relative risk (RR) of exposure to risk factor and disease, and the sociodemographic index (SDI), a composite index per capita income, educational attainment, and total fertility rate (3). Population data were obtained from the Global Burden of Disease Study, which predicted the number of people in different sex and age groups of China between 2020 and 2050 (4). To facilitate the evaluation of Healthy China 2030 goals, baseline results in 2015 and interim results for 2025 will also be presented.
We attributed the change in mortality from 1990 to 2015 to 3 parts (5):
1) Mortality that can be explained by sociodemographic variables (SDI): Studies have shown that SDI has high explanatory of mortality level (6), and this variable can be used to better estimate the basic level of mortality. Thus, we assumed that basic mortality could be estimated as a function of SDI, age, and time.
2) Mortality due to related risk factors: The SEV is the relative risk-weighted prevalence of exposure, where 0 is no risk in the population and 1 is the entire population at maximum risk. Based on the distribution characteristics of all risk factors SEVs estimated by GBD 2019 (3), we first calculate the rate of change observed in each risk factor by sex and age in the past years across China. Two scenarios were used for the prediction, a “better control” scenario and a “worse control” scenario. The better scenario was constructed from the 85th percentile rate of change for all the risk factors. We then constructed a “worse control” scenario using the 15th percentile of rate of change for all the risk factors. We calculated the “natural trends” of the risk factors based on the average change rates of the risk factors from 1990 to 2015 in China.
3) Mortality that cannot be explained by SDI and risk factors: Considering that sociodemographic variables and included risk factors could not fully explain all changes of mortality, we used ARIMA model to predict the residual of the mortality that was not explained by sociodemographic variables and risk factors. The predicted results of the above three parts were added together to obtain death rates by sex, age, and major diseases under different scenarios.
Premature mortality rate from 4 major NCDs was defined as the unconditional probability of death between ages 30–69 years from cardiovascular diseases, cancer, diabetes, and chronic respiratory diseases (7). The life table method was used to calculate the life expectancy. The predicted premature mortality rate and life expectancy were calculated based on predicted mortality by sex and age-group. Age-standardized mortality rate was calculated using the world population from GBD 2019 (8).
Under the natural trend scenario, the total number of deaths in 2050 in China is estimated at 19.37 million (Table 1), among which 0.51 million are infectious diseases (2.6%), 18.01 million are NCDs (93.0%), and 0.85 million are injuries (4.4%). In 2050, the total death is estimated to be 15.82 million (18.3% lower than the natural trend) and 23.25 million (20.1% higher than the natural trend) for the better control and worse control scenarios, respectively. In 2050, the age-standardized mortality rate of all-cause in China will be 435.8/100,000, decreased by 32.8% from 648.7/100,000 in 2015. Compared to the natural trend, there will be a 29.3% reduction of NCDs age-standardized mortality rate, under the “better control” scenario.
Scenarios Cause 2015 2025 2030 2035 2050 No. of death* Rate† ASMR† No. of death* Rate† ASMR† No. of death* Rate† ASMR† No. of death* Rate† ASMR† No. of death* Rate† ASMR† Natural trend All causes 9.99 723.0 648.7 11.99 841.2 552.6 13.49 947.9 519.7 15.15 1083.3 493.2 19.37 1519.8 435.8 Infectious disease 0.37 26.5 33.2 0.34 23.5 21.3 0.36 25.1 19.3 0.39 28.2 18.0 0.51 40.1 14.8 NCD 8.88 642.6 566.1 10.91 765.4 490.4 12.36 868.5 462.2 13.95 997.4 439.2 18.01 1413.3 390.6 Injury 0.75 53.9 49.5 0.75 52.3 40.9 0.77 54.3 38.2 0.81 57.7 36.1 0.85 66.3 30.4 Better control All causes − − − 11.08 776.7 505.3 11.99 842.2 450.3 13.06 934.0 406.0 15.82 1241.5 311.7 Infectious disease − − − 0.31 21.9 19.8 0.32 22.6 17.1 0.35 24.6 15.0 0.43 34.0 10.6 NCD − − − 10.04 704.4 446.3 10.93 768.1 397.7 11.96 855.1 358.4 14.59 1144.8 276.2 Injury − − − 0.72 50.5 39.2 0.73 51.5 35.5 0.76 54.2 32.5 0.80 62.7 24.9 Worse control All causes − − − 12.83 899.9 597.3 14.99 105.3 593.4 17.32 1238.6 594.0 23.25 1824.8 612.5 Infectious disease − − − 0.36 25.2 23.1 0.40 2.8 22.5 0.46 33.1 22.7 0.64 50.5 25.0 NCD − − − 11.72 821.7 532.3 13.80 96.9 531.1 16.04 1146.9 533.1 21.79 1709.8 553.4 Injury − − − 0.76 53.1 41.9 0.79 5.5 39.8 0.82 58.6 38.2 0.82 64.5 34.1 Note: – data not applicable.
Abbreviations: NCD=non-communicable chronic disease; ASMR=age-standardized mortality rate. No.=number.
* million.
† per 100,000 population.Table 1. Projected all-cause and three major diseases mortality under different scenarios, China, 2015–2050.
As shown in Figure 1, in 2015, the premature mortality of the 4 major NCDs was 18.4%. Under the “natural trend” scenario, the premature mortality will be 14.6% by 2030 and 12.4% by 2050 (a 32.9% decrease from 2015). For “worse control” scenarios, premature mortality decreased from 16.4% in 2030 to 16.1% in 2050, only decreasing 12.7%. For “better control” scenarios, the premature mortality was reduced to 12.5% by 2030, achieving the goal of reducing the premature mortality to less than 13.0% by 2030 set out in the Healthy China Action (2019–2030) (2). By 2050, premature mortality was reduced to 8.5%, with a decrease of 53.9% from 2015.
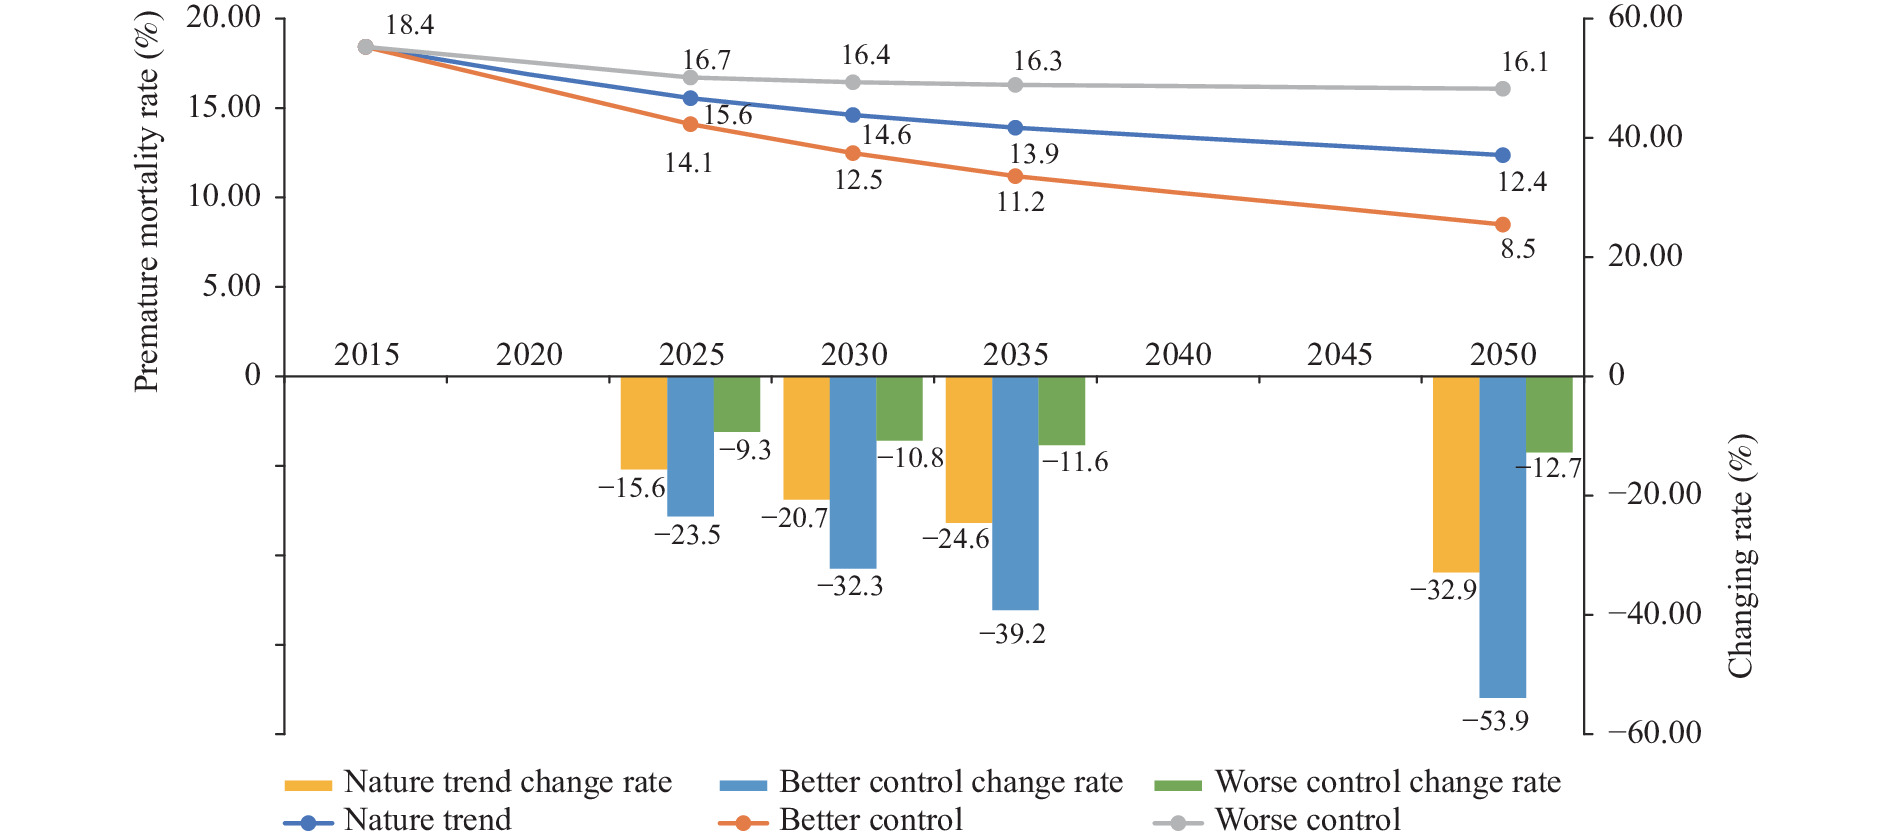 Figure 1.
Projected trends and change rates of premature mortality rate from 4 major non-communicable and chronic diseases (NCDs) in different scenarios in China, 2015–2050.
In 2015, the life expectancy of Chinese residents was 76.84 years (Figure 2). If the current trend of economic development and health improvement continues (natural trend), the life expectancy is expected to be 79.95 years by 2030 and 82.13 years by 2050. Under the “better control” scenario, the life expectancy in 2030 was projected to exceed the Healthy China target of 2.8 years (reached 81.84 years) (2), and under the “worse control” scenario, life expectancy reached only 78.35 years in 2030 which could not meet the target. Under the “better control” scenario, the life expectancy was expected to reach 86.76 years in 2050, while under the “worse control” scenario, it was expected to be 78.12 years, 1.22 years higher than in 2015 and slightly lower than in 2030.
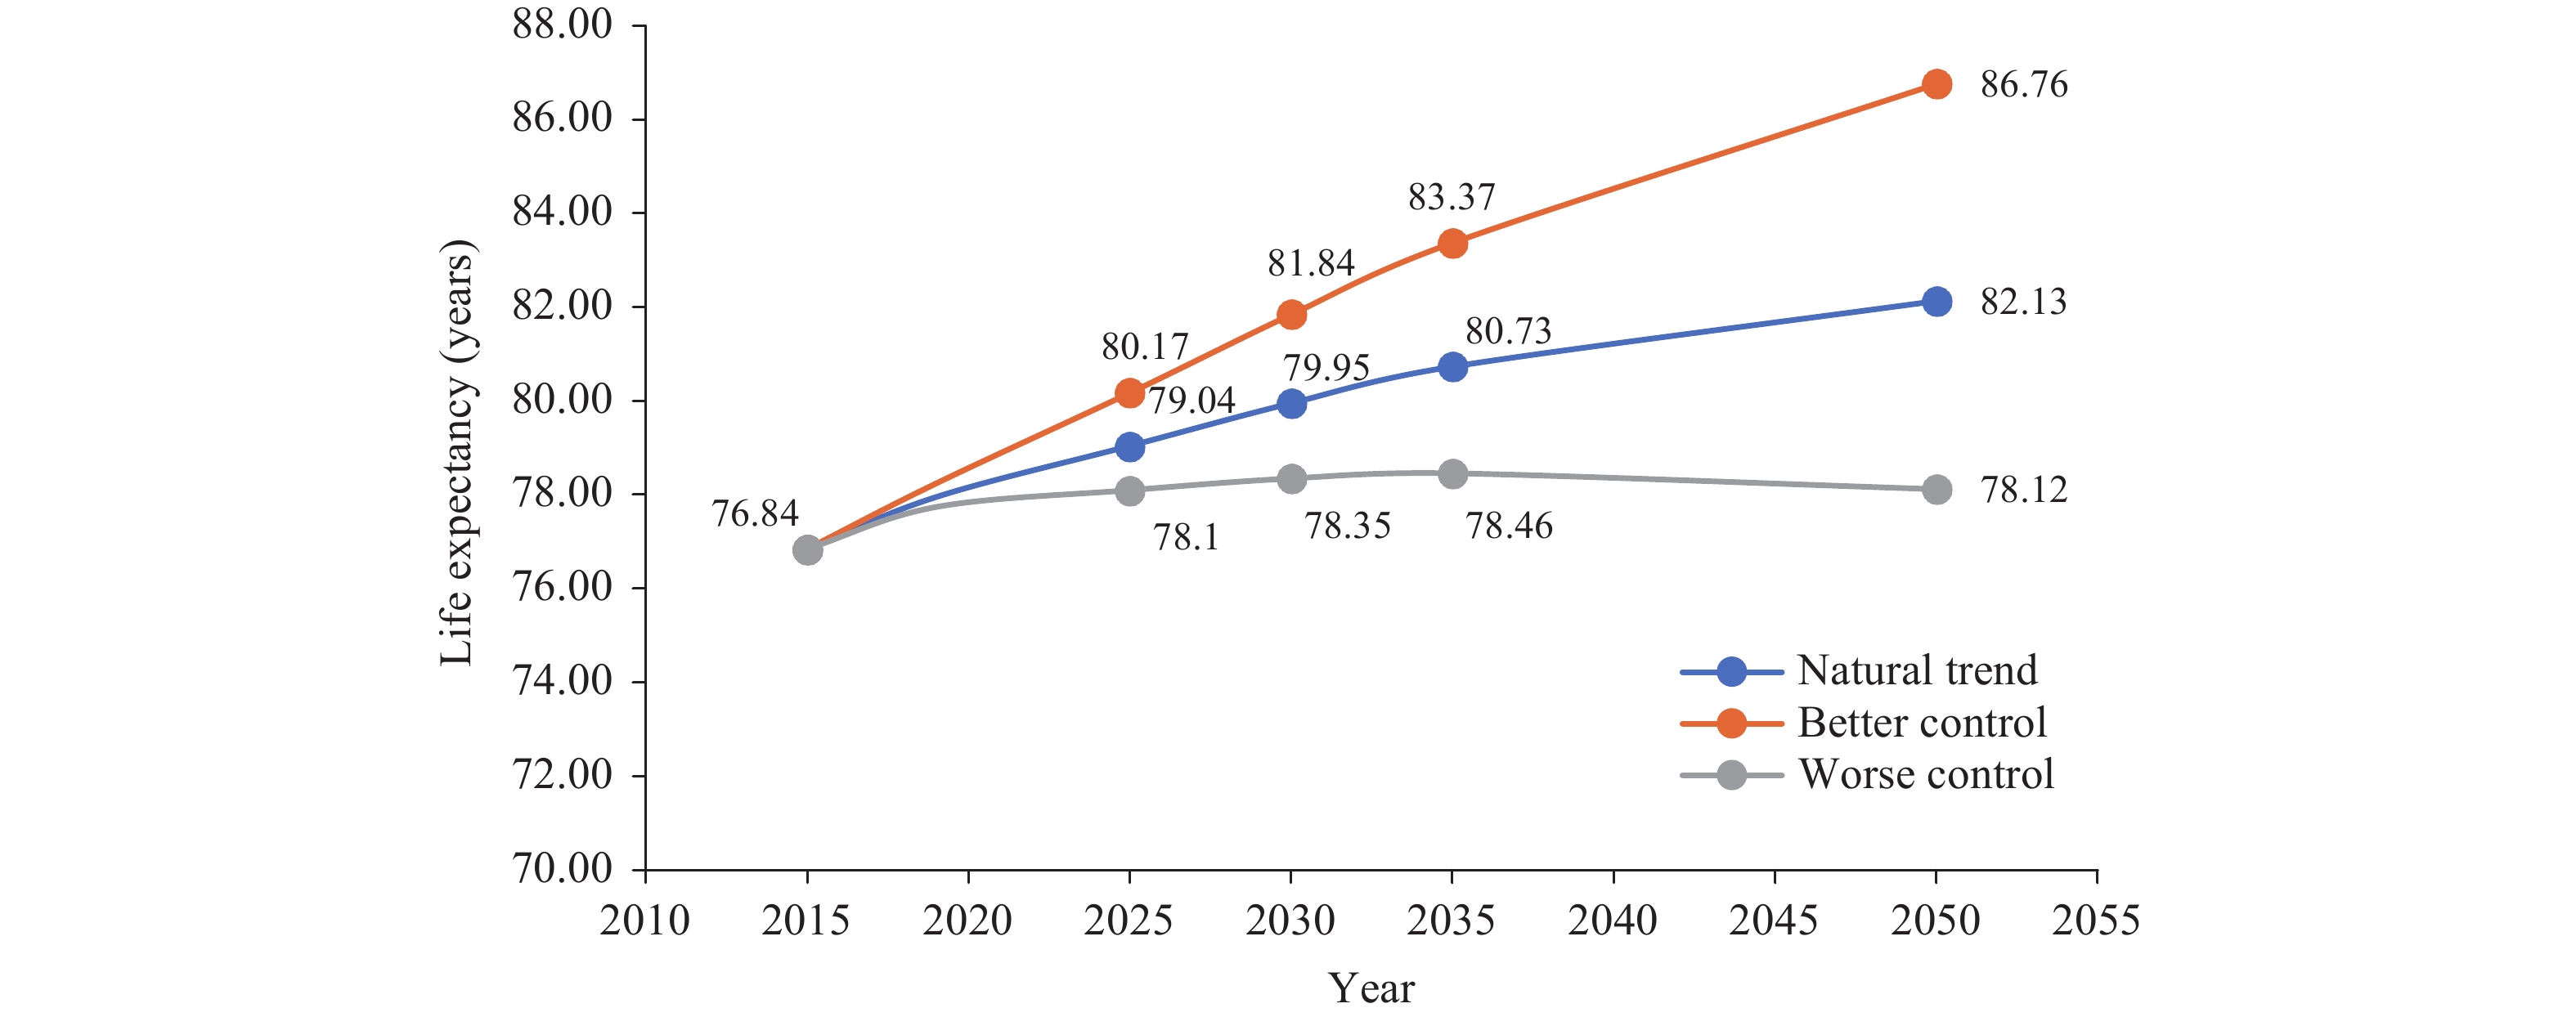 Figure 2.
Predicted trends of life expectancy in different scenarios in China, 2015–2050.
According to China’s current economic development speed and the improvement of residents’ health status, the expected life expectancy of Chinese residents in 2030 is expected to be 79.95 years old. If the risk factors are not well controlled, the goal will not be achieved by 2030. These results were consistent with our research team’s previous findings (8).
The health status of Chinese residents has further improved, and life expectancy has continued to increase, but the growth rate has slowed down. From 2015 to 2025, it was projected to increase by about 1 year every 5 years, but after that, it would increase an average of about 0.75 years every 5 years until 2050. Since 2011, the United States, the United Kingdom, France, Germany, Sweden, and the Netherlands had seen significant slowdowns in life expectancy gains. Slower improvements in the mortality of old people may be the main reason. In these countries, improvements in cardiovascular disease (CVD) mortality rates have slowed, while deaths from dementia and Alzheimer’s disease are rising. While some risk factors such as smoking, alcohol abuse, high blood pressure, and cholesterol levels continue to decline, the prevalence of obesity and diabetes continues to rise (9). This study also suggests that, under the better control of risk factors, the life expectancy in China can maintain a rapid and stable growth rate by 2050.
The study was subject to at least 2 limitations. The basic data of this study were all from the Global Burden of Disease (GBD) study, so biases in the estimation of deaths and exposure levels of risk factors in GBD would affect the final projection results. Meanwhile, we did not estimate the uncertainty intervals of each indicator which would reflect the deviation of the estimations. However, the prediction of different scenarios also provides a range of indicators.
Although the life expectancy of Chinese residents continues to improve and the overall health level continues to improve, it is still necessary to pay attention to the burden of NCDs, especially among people aged 30–69 years. Meanwhile, effectively controlling risk factors will help achieve the health goals of the Healthy China Action in the future.
HTML
| Citation: |

|