
 Download:


-
Fumonisins are secondary metabolites of Fusarium and Aspergillus species, which commonly infected crops and can contaminate the whole food chain. Fumonisin B (FB) is a group of fumonisin analogues. FBs as a group are clearly the most relevant toxin among fumonisin analogues and include fumonisin B1 (FB1), fumonisin B2 (FB2), and fumonisin B3 (FB3). FB1 is the most abundant and potent of these. As being possibly carcinogenic in humans (Group 2B) (1), FB1 has been shown to cause a variety of diseases in animals, including hepatotoxic, nephrotoxic, hepatocarcinogenic, and cytotoxic effects in mammals (2) with high potential impact on human health (3). To protect human health from the risk of FBs, the Joint Food and Agriculture Organization (FAO)/World Health Organization (WHO) Expert Committee on Food Additive (JECFA) has set a provisional maximum tolerable daily intake (PMTDI) for the group of fumonisins (B1 and its analogues B2 and B3), at 2 µg/kg of body weight (bw)/day (4). Numerous countries have issued maximum levels for fumonisins in food and animal feed (5–6). In order to assess the risk of FB dietary intake in China, we applied a total diet study (TDS) approach. The TDS is an effective method that has been recommended by the WHO to estimate the dietary intakes of certain food chemicals (7). Unlike surveillance based on raw food commodities, TDS uses representative samples prepared as ready-to-eat dishes for the general population and combines consumption data to achieve a more accurate assessment (8). As a useful strategy, TDS has been conducted in several countries and regions for mycotoxin exposure assessment (9).
-
China National Center for Food Safety Risk Assessment conducted the 6th China TDS in 2015−2020. This article aims to present the results of the exposure to fumonisins of the general Chinese population and evaluate the risk with regards to the international health-based guide values.
The protocol of the 6th TDS followed a similar procedure to the previous 4th and 5th TDSs in China. Collection of consumption data and food sampling were described in previous work (10-11). In the 6th China TDS, the number of provincial-level administrative divisions (PLADs) were increased to 24 (Supplementary Table S1). Each PLAD comprised of 3 or 6 survey sites according to population size (6 survey sites for PLADs with more than 50 million population, 3 survey sites for PLADs with less than 50 million population). Since approximately two-thirds of the Chinese population reside in rural areas, we randomly selected rural counties and urban cites with a ratio of 2∶1 for each PLAD.
The dietary survey adopted multiple survey methods. For the survey for households, the measuring of weight plus a three-day accounting method was applied. For the survey for individuals, verbal interviews were conducted every 24 hours over 3 days. Samples of various food items were purchased at local markets, grocery stores, and local farms of each survey site. Thirteen dietary sample categories, such as cereals, legumes, potatoes, meats, eggs, aquatic products, dairy products, vegetables, fruits, sugars, beverages and water, alcohols, and condiments, were included in the TDS. For each PLAD, various food cooked according to local customs and condiments were added into the other 12 sample categories at the calculated amount during cooking procedure. Thus, in total, 288 dietary samples were prepared in the 6th China TDS.
FB1, FB2, and FB3 in food samples were analyzed via an isotope dilution UPLC-MS/MS method (11). Briefly, this analysis involved an extraction using acetonitrile/water solvent mixture for food samples, followed by purification with MultiSep 211 Fum solid phase extraction column. The chromatographic separation and mass spectrometry parameters are described Supplementary Table S2. The method validation was also well described (11).
The exposure of the Chinese adult populations was assessed by combining consumption data with analytical results. When calculating the estimated daily intakes (EDI), the management for results below the limit of detection (LOD) and/or limit of quantification (LOQ), so called left-censored data, was applied based on the Global Environment Monitoring System/Food Contamination Monitoring Assessment Programme (GEMS/Food) guidelines for low-level contamination of food (12). In this study, the proportion of left-censored data exceeded 60%. Thus, scenarios for lower bound (LB) and upper bound (UB) were applied. To estimate the lowest (LB scenario) possible EDI, a value of zero was assigned for results below the LOD, and the LOD was assigned for results below the LOQ. To estimate the highest (UB scenario) possible EDI, a value of the LOD were assigned for results below LOD, and LOQ were assigned for results below LOQ.
The EDI (in ng/kg bw/day) of each fumonisin was calculated as follows:
$$ {\rm{EDI}} = \frac{{\mathop \sum \nolimits_{i = 1}^p {T_i} \times {F_i}}}{{bw}} $$ where
$ {T}_{i} $ represents the concentration of each mycotoxin in a dietary sample from each food category i (i = 1,…, p) (ng/g),$ {F}_{i} $ is the consumption of each food category i in a day (g/d), and bw is the standard body weight (kg) of 63 kg. IBM SPSS Statistics (version 22.0, IBM Corp., New York, US) was used for data processing and analysis. -
Among the total 288 dietary samples, the occurrence data of individual toxins and total of FBs (FB1+FB2+FB3) are shown in Table 1, respectively. The concentrations and distribution of FBs in participant PLADs are demonstrated in Figure 1.
Food category FB1 FB2 FB3 FBs Cereals Positive, % 95.8 25.0 20.8 95.8 Mean 5.33 0.58 1.68 7.59 Median 2.57 0.02 0.02 2.74 Legumes Positive, % 58.3 0.0 12.5 58.3 Mean 0.78 0.01 0.10 0.90 Median 0.16 0.01 0.01 0.23 Potatoes Positive, % 66.7 4.2 16.7 66.7 Mean 0.57 0.02 0.13 0.72 Median 0.09 0.01 0.01 0.14 Meats Positive, % 62.5 4.2 4.2 62.5 Mean 1.08 0.02 0.03 1.13 Median 0.25 0.01 0.01 0.27 Eggs Positive, % 16.7 8.3 0.0 16.7 Mean 0.02 0.06 0.01 0.09 Median 0.01 0.01 0.01 0.03 Aquatic products Positive, % 8.3 20.8 0.0 25.0 Mean 0.03 0.75 0.01 0.79 Median 0.01 0.01 0.01 0.03 Dairy products Positive, % 4.2 0.0 0.0 4.2 Mean 0.02 0.01 0.01 0.04 Median 0.01 0.01 0.01 0.03 Vegetables Positive, % 20.8 0.0 0.0 20.8 Mean 0.17 0.01 0.01 0.19 Median 0.01 0.01 0.01 0.03 Fruits Positive, % 0.0 0.0 0.0 0.0 Mean 0.01 0.01 0.01 0.03 Median 0.01 0.01 0.01 0.03 Sugars Positive, % 0.0 0.0 0.0 0.0 Mean 0.01 0.01 0.01 0.03 Median 0.01 0.01 0.01 0.03 Beverages and water Positive, % 0.0 4.2 0.0 4.2 Mean 0.01 0.01 0.01 0.03 Median 0.01 0.01 0.010 0.03 Alcohols Positive, % 33.3 4.2 4.2 33.3 Mean 0.52 0.16 0.50 1.17 Median 0.01 0.01 0.01 0.03 Total samples (N=288) Positive, % 30.6 5.9 4.9 32.6 Note: for samples in which toxins were not detected, values were assumed to be half the LOD and for samples in which toxin levels were below the LOQ, values were assumed to be half the LOQ. There are 24 samples for each food category.
Abbreviations: FB1=fumonisin B1; FB2=fumonisin B2; FB1=fumonisin B1; TDS=total diet study; LOD=limit of detection; LOQ=limit of quantification.Table 1. Contamination levels of fumonisins (µg/kg) and the positive rate of detection in the 6th China TDS, 2015−2020.
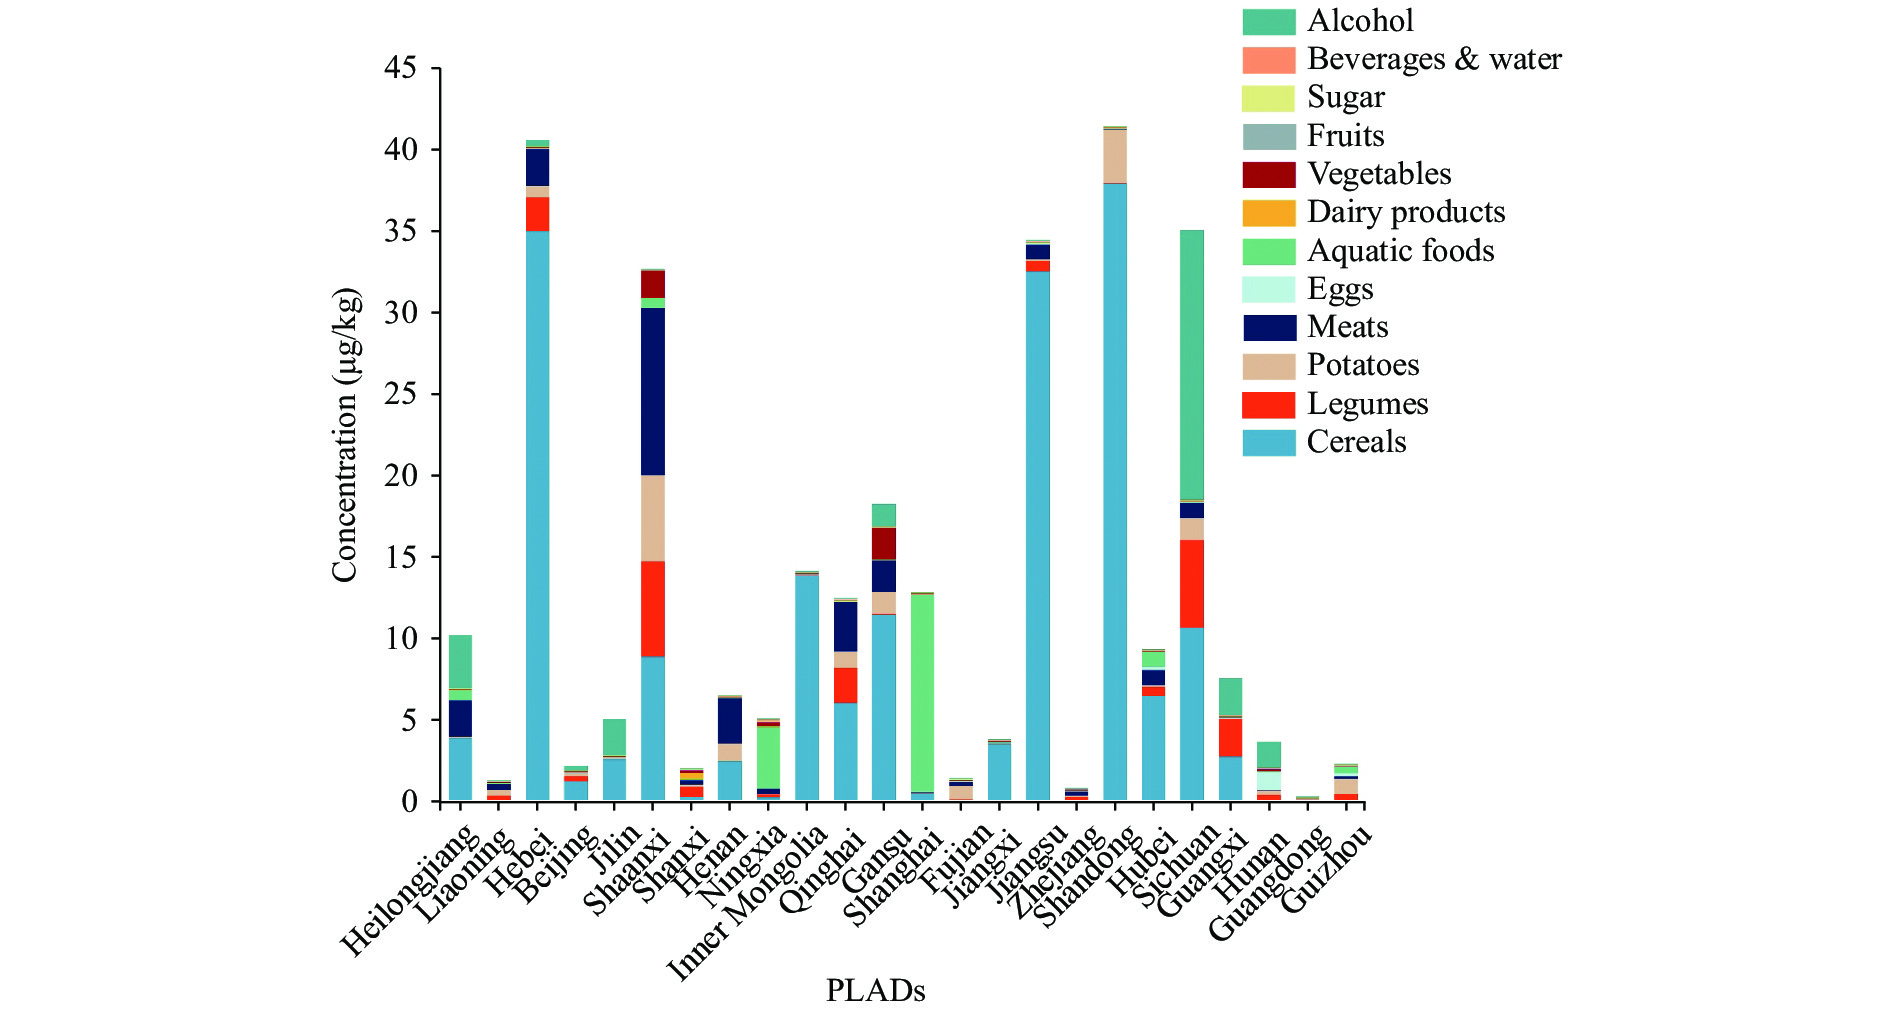 Figure 1.
Contamination levels of FBs (FB1+FB2+FB3) in participating provinces from the 6th China TDS. Abbreviations: FB=fumonisin B; TDS=total diet study; PLADs=provincial-level administrative divisions.
The frequency of detection for FBs was 32.6% (Table 1). Among 12 food categories, cereals had the highest incidence of 95.8%, with an average FBs level of 7.59 µg/kg. Shandong, Hebei, Sichuan, Jiangsu, and Shanxi had the highest level of FBs (Figure 1).
The average food consumption level was 2,439 g/day in the 6th TDS. Among the 12 food categories, beverages and water contributed most to the total consumption (40.7%), followed by cereals and vegetables making up 29.3% and 14.2%, respectively.
The EDI of each individual fumonisin was calculated according to the formula in Methods section. The EDI of total fumonisins was the sum of EDI of FB1, FB2, and FB3 (FBs). In the 6th TDS, the average EDI of total FBs was 102.78–104.91 ng/kg bw/day (Table 2). Cereals were the predominant contributor, making up 97.8%–98.6% of the overall EDI. Shangdong had the highest total EDI of FBs at 597.40–605.27 ng/kg bw/day (LB-UB) and the highest EDI of FB1 at 516.0–516.4 ng/kg bw/day (LB-UB) (Figure 2). However, the highest EDI of FB2 and FB3 were in Hebei at 87.18–87.62 ng/kg bw/day and 183.49–183.93 ng/kg bw/day (LB-UB), respectively.
Food category EDI (ng/kg bw/day) Percentage of PMTDI LB UB LB UB Cereals 97.78 98.55 4.89 4.93 Legumes 0.85 0.90 0.04 0.04 Potatoes 0.96 1.01 0.05 0.05 Meats 1.61 1.67 0.08 0.08 Eggs 0.02 0.04 0.00 0.00 Aquatic Foods 0.59 0.61 0.03 0.03 Dairy Products 0.00 0.03 0.00 0.00 Vegetables 0.74 1.02 0.04 0.05 Fruits 0.00 0.04 0.00 0.00 Sugar 0.00 0.00 0.00 0.00 Beverages & water 0.04 0.82 0.00 0.04 Alcohol 0.19 0.20 0.01 0.01 Total 102.78 104.91 5.14 5.25 Note: Provisional Maximum Tolerable Daily Intake (PMTDI) set by JECFA is 2 μg/kg bw/day for FBs (FB1+FB2+FB3). % of PMTDI=EDI/PMTDI×100%.
Abbreviations: FB=fumonisin B; TDS=total diet study; EDI=estimated dietary intake; LB=lower bound; UB=upper bound.
Table 2. Estimated dietary intake (μg/kg bw/day) of FBs in food categories with their percentage of PMTDI from the 6th TDS of general Chinese population.
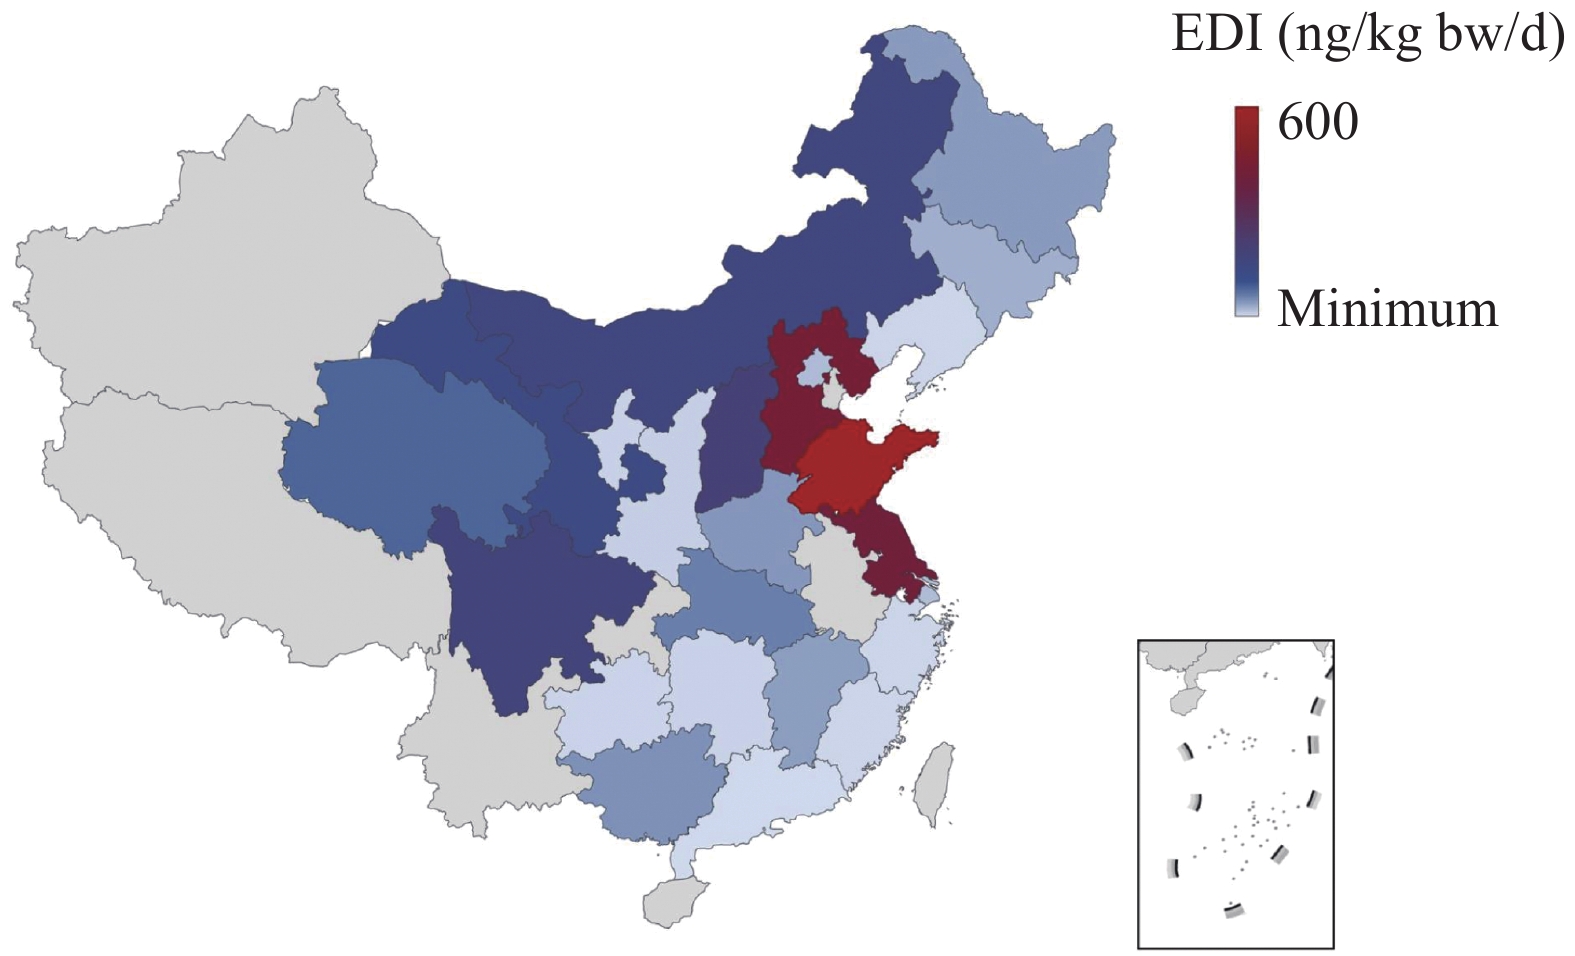 Figure 2.
Regional distribution of EDI of FBs (FB1+FB2+FB3) in the 6th China TDS. The blue and red regions represent the participating PLADs. In the 24 participating provinces, their color intensity represents their levels of EDI respectively.
Abbreviations: EDI=estimated dietary intake; FB=fumonisin B; TDS=total diet study; PLADs=provincial-level administrative divisions. -
Regarding to the contamination level of fumonisins, China has not yet set a maximum limit for fumonisins. Codex Alimentarius Commission (CAC) has set the maximum level for FB1+FB2 in raw maize grain (4,000 µg/kg) and maize flour and maize meal (2,000 µg/kg) (13). In our study, the average contamination level of fumonisins (FB1+FB2+FB3) in cereals were 7.59 µg/kg, much lower than CAC’s regulation level. Even in Shandong Province, the highest aggregated FB levels (41.56 µg/kg) were still much lower than CAC’s limit. Relatively high contamination levels of FBs were found sporadically, such as in alcohol in Sichuan (16.55 µg/kg) and in meats in Shanxi (10.30 µg/kg). Among the three types of FBs, FB1 was most frequently detected and abundant. FB2 and FB3 shared similar incidence. Commonly believed, FB3 often co-exists with FB1 and FB2, and its concentration usually does not exceed that of FB1 and FB2, usually accounting for an additional 10%–15% to FB1 levels (14). Thus, FB3 was usually considered as a minor important mycotoxin. However, in our study, the relative level of FB3 was 21%–25% in cereals, legumes and potatoes, and even higher than FB2. The relative amount of FB1 compared to FB2 and FB3, is related to climatic factors, such as water activity and temperature (14). Therefore, these results provide some information for food safety surveillance and establishing China’s maximum limit for fumonisins in the future. First, in addition to FB1 and FB2, FB3 should be included. Second, besides cereals and their products, potatoes and meats need to be considered as candidate food categories in surveillance plan or maximum limit scope.
The dietary exposure to FBs at 104.91 ng/kg bw/day (upper bound) accounted 5% of the PMTDI set by JECFA. It indicated the risk of dietary exposure to fumonisins in China was at a safe level. The highest EDI of FBs was found in Shandong Province, accounting for approximately 30% of the PMTDI. Together with Hebei and Jiangsu, these three provinces with highest EDIs for FBs are located in the east of North China Plain (Figure 2). Whereas, comparing to the 5th China TDS (EDI, 50 ng/kg bw/day) (2), the exposure level doubled, indicating a trend of dramatic increase. Among the 3 types of FBs, FB1, FB2, and FB3 contributed 70.6%, 7.6%, and 21.8% of the overall dietary exposure, respectively. The contribution of FB3 to EDI of total fumonisins has also exceeded FB2 and should not be overlooked. This is the first result revealed dietary exposure to FB3 from TDS. FB1 and FB2 were investigated in most TDSs, but FB3, as a considered least important fumonisin among the three, was seldom included. The Netherlands TDS (15) included FB3, but the sensitivity of the method (LOD=3.3 µg/kg) was not enough to detect the existence of fumonisins in ready-to-eat dishes.
This study was subject to some limitations. As for TDS in the study, as well as other TDSs, uncertainties were existed in exposure assessment, such as analytical methods, consumption statistics, and especially sample representativeness. Mycotoxin contamination occurred sporadically and could be affected by temperature, humidity, geographic location and storage duration. For such a large-scale study, big uncertainty could be caused by limited sample numbers and heterogeneous distribution of toxins.
In the 6th China TDS, exposure estimates for FBs were generally out of concern with 5.25% of PMTDI for the general population. However, it still needs to be noted that the population in relative high exposure regions or the high consumers of certain food categories may be associated with higher risk. Cereals were the predominant source and contributed over 90% to the dietary exposure to fumonisins. The remarkable increase of EDI of fumonisins and considerable contribution from FB3 in the 6th China TDS were well worth further attention.
Acknowledgements: The 24 provincial-level CDCs.
Conflicts of interest: The authors declare that there are no conflicts of interest.
HTML


| Citation: |

|