
 Download:


-
Background: We explored a phenotype of liver dysfunction based on modified Child-Pugh (MCP) with coronavirus disease 2019 (COVID-19) and evaluated its relationship with escalation of respiratory support and survival.
Methods: This was a retrospective cohort study involving COVID-19 in-patients at the Wuhan Jinyintan Hospital. This study was performed between January 24, 2020 and March 31, 2020. Escalation of respiratory support and survival were evaluated. Furthermore, the trajectory of liver function was delineated considering the risk of escalation of respiratory support and survival using multilevel logistic regression.
Results: A total of 298 patients were enrolled in this study. A higher proportion of patients with MCP-B on admission exhibited an escalated respiratory support (26 of 55; 47.3%) when compared to patients with MCP-A (9 of 62; 14.5%), indicating that MCP-B was strongly associated with escalation of respiratory support [adjusted hazard ratio (HR): 4.530; 95% confidence interval (CI): 2.060–9.970; P<0.001]. Among the patients on escalated respiratory support, 5 (55.6% of 9) patients with MCP-A died compared to 10 (38.5% of 26) of the patients with MCP-B. Patients with a history of liver disease had a higher mortality risk (adjusted HR: 7.830; 95% CI: 1.260-48.420).
Conclusion: MCP is efficient at stratifying liver dysfunction levels in COVID-19 patients and is strongly associated with escalation of respiratory support.
-
Liver dysfunction is an independent risk factor for organ dysfunction in coronavirus disease 2019 (COVID-19) patients (1). Given the high mortality rate associated with COVID-19, it has not been established which liver dysfunction groups are at higher risk.
The criteria for evaluation of liver dysfunction in COVID-19 patients are incompletely defined. Previous studies have reported independent associations between liver functions and disease progression (2). The Child-Pugh score is a classic tool for evaluating liver dysfunction levels (3). However, it has some limitations. Evaluation of ascites and hepatic encephalopathy are subjective to some degree. Moreover, there is a causal relationship between ascites and hypoalbuminemia that if determined at the same time, would lead to a bias. Therefore, an objective, recognizable method for evaluating liver dysfunction in COVID-19 patients is crucial. Based on evidence from previous studies (4-6), discussion with hepatologists, and our observation that changes in aspartate aminotransferase and gamma glutamyl transpeptidase levels are not clinically significant (7), we modified the Child-Pugh score. Furthermore, elevations in lactate dehydrogenase levels are not significant in COVID-19 progression while elevations in aspartate aminotransferase levels are strongly associated with increased neutrophil counts and decreased lymphocyte counts, indicating the severity of viral pneumonia (4). Therefore, we replaced ascites with aspartate aminotransferase and defined its cut-off value as 1.5 times the upper limit of normal [<35 IU/L, 1 points; 35–87.5 IU/L, 2 points; >87.5 IU/L, 3 points (35 IU/L is the standard value in Jinyintan Hospital)] in the modified Child-Pugh (MCP) score as a new evaluation of liver dysfunction in COVID-19 patients. This cutoff value was established based on previous studies (8-9). In this study, we aimed to assess the impact of liver dysfunction stratification in COVID-19 by evaluating longitudinal associations between MCP and escalated respiratory support.
-
This was a retrospective longitudinal cohort study involving COVID-19 patients that were confirmed by reverse transcriptase polymerase chain reaction (RT-PCR), based on the Chinese diagnosis and treatment protocol for COVID-19 (Trial Version 7) (10) admitted at the Jinyintan Hospital. Epidemiological, clinical, and laboratory data for patients were collected between January 24, 2020 and March 31, 2020, at which point patients were admitted and no more patients were admitted. Individuals who were 18 years of age or older, and who tested positive for COVID-19 by real-time RT-PCR were included in this study. No exclusion criteria were applied.
-
Nose and throat swab specimens or nasopharyngeal aspirates collected from patients were tested for COVID-19 using RT-PCR. Epidemiological information, medical history, and clinical symptoms were recorded upon admission. Imaging and laboratory tests were routinely performed for all patients. Data were extracted from hospital information systems (HISs) using a standardized data collection form. All data were recorded daily. A group of experienced physicians determined the frequency of examinations and then reviewed and cross-checked the data. Implausible values for variables were identified with the data entry department and confirmed by physicians.
-
An axillary temperature of at least 37.3 °C was considered as fever. The six-point ordinal scale of clinical status for respiratory support was categorized as follows: 1) 6 points, death; 2) 5 points, need for invasive ventilator; 3) 4 points, high flow humidification oxygen/high frequency oxygen/non-invasive ventilator are needed; 4) 3 points, low flow (1 liters – 5 liters per minute) face mask/nasal cannula for oxygen inhalation; 5) 2 points, oxygen saturation of above 93 without oxygen inhalation; 6) 1 point, discharge (11). Mild illness was defined as 2 points, while severe illness was defined as 3 points or above. Escalation of respiratory support was defined as a transition from 2 or 3 points to 4 points or higher.
Chest x-ray and chest computed tomography abnormality (CXR): 0, bilateral pneumonia with no abnormal lesions (unilateral or bilateral pneumonia); 1, unilateral pneumonia with multiple mottling and ground-glass opacity; 2, bilateral pneumonia with multiple mottling and ground-glass opacity.
The practical definition of liver dysfunction was modified from studies on the Child-Pugh score, and other studies that reported that liver dysfunction is highly correlated with COVID-19 progression and associated mortality (12-14). The MCP was defined as follows (Table 1): Aspartate aminotransferase (AST) (U/L): <35, 1 point; 35–70, 2 points; >70, 3 points (35 U/L is the normal standard in Jinyintan Hospital). Total bilirubin (TBIL) (μmol/L): <34, 1 point; 34–51, 2 points; >51, 3 points. Albumin (ALB)(g/L): >35, 1 point; 28–35, 2 point; <28, 3 points. Prothrombin time (PT) (s): prolong <4, 1 point; 4–6, 2 points; >6, 3 points. It was graded as 5 points or below for Child-Pugh-A; 6–9 points for Child-Pugh-B; and 10–15 points for Child-Pugh-C. The AST cut-off values were obtained from literature reviews (8,15-16) and extensive discussion with hepatology experts and infectious disease specialists.
Item Score 1 2 3 Total bilirubin, mmol/L <34 34−51 >51 Albumin, g/L >35 28−35 <28 Aspartate aminotransferase, U/L <35 35−70 >70 Prothrombin time prolongation, s <4 4−6 >6 Table 1. Modified Child-Pugh scoring system.
-
Categorical and continuous variables were presented as percentages (%) and as means [95% confidence interval (CI)], respectively, while normally distributed data were presented by their medians [interquartile range (IQR)]. For normally distributed data, independent t tests were performed to compare means between two groups for continuous variables; otherwise, the Mann-Whitney test was used. For categorical variables, we used Pearson’s chi-squared test or Fisher’s exact test to determine significant differences.
Probability of escalation was calculated using Kaplan-Meier curves with death or escalation up to 2 points or above as events, and surviving patients recorded in 30 days. Longitudinal analysis was performed using scatterplots of daily results against time, which was visualized by the estimated survival time distribution plot. The Cox regression model was used to simultaneously evaluate the relationship between various risk factors and survival time of patients while the log-rank test was used to determine whether differences in survival rates were statistically significant. Missing data were carried by results from the previous day and only estimated for the repeated measures multivariate model. If more than one result was recorded on a certain day, the most deviated result was chosen to reveal the reality of availability of given information to a clinician at a random time. A locally estimated scatterplot smoothing (LOESS) curve showing 95% CIs for the daily mean was used to present dynamic changes in liver function markers based on the severity of COVID-19 (default settings with a polynomial degree of 2, Gaussian kernel, and interpolation on cell size of 0.2). The mixed-effect Cox proportional hazards regression models were used to establish the factors that were associated with escalation of respiratory support or mortality. A two-sided α of <0.05 was considered statistically significant. All analyses were performed using R statistical software (version 3.6.2; The R Foundation for Statistical Computing, Vienna, Austria)
-
Out of the 307 patients, 9 patients were excluded because of missing data. Baseline characteristics of this study are summarized in the appendix (Supplementary Table S1). The median age was 60 years (IQR: 49–68), 166 (55.70%) participants were male while 132 (44.30%) participants were female. A total of 112 patients (37.58%) had extra oxygen supply, while 186 (62.42%) only had occasional oxygen inhalation. Among them, 6 (2.0%) patients had fatty liver disease while 10 (3.4%) had viral hepatitis.
-
After admission, 35 patients were eligible for escalation of respiratory support. Among them, 30 patients were originally included in the severe group while the remaining 5 patients were in the mild group. Since the severe group had higher probability for escalated respiratory support, the study compared liver function among patients who were eligible for escalation of respiratory support and those who were not eligible in the severe group. Because patients in severe group tended to be eligible for escalation, AST levels were highly elevated in the escalation group (Supplementary Table S2).
Then, the trajectory of liver function was assessed in severe patients, which were divided by two groups: the escalated group included escalated patients, while the mend group included patients in stable condition. The LOESS model was used to show the trajectory of ALB, AST, TBIL, and PT in the escalated and mend groups. There were low ALB levels, significant elevated AST levels, higher TBIL levels, and first lower but delayed marked PT (Figure 1). Upon admission, MCP levels were elevated in patients that were eligible for escalation than in those who were not, as determined by the mixed-effects Cox model. Age, gender, comorbidity, and drug were adjusted as confounders [adjusted hazard ratio (HR): 4.530; 95% CI: 2.058–9.970; P<0.001] (Figure 2).
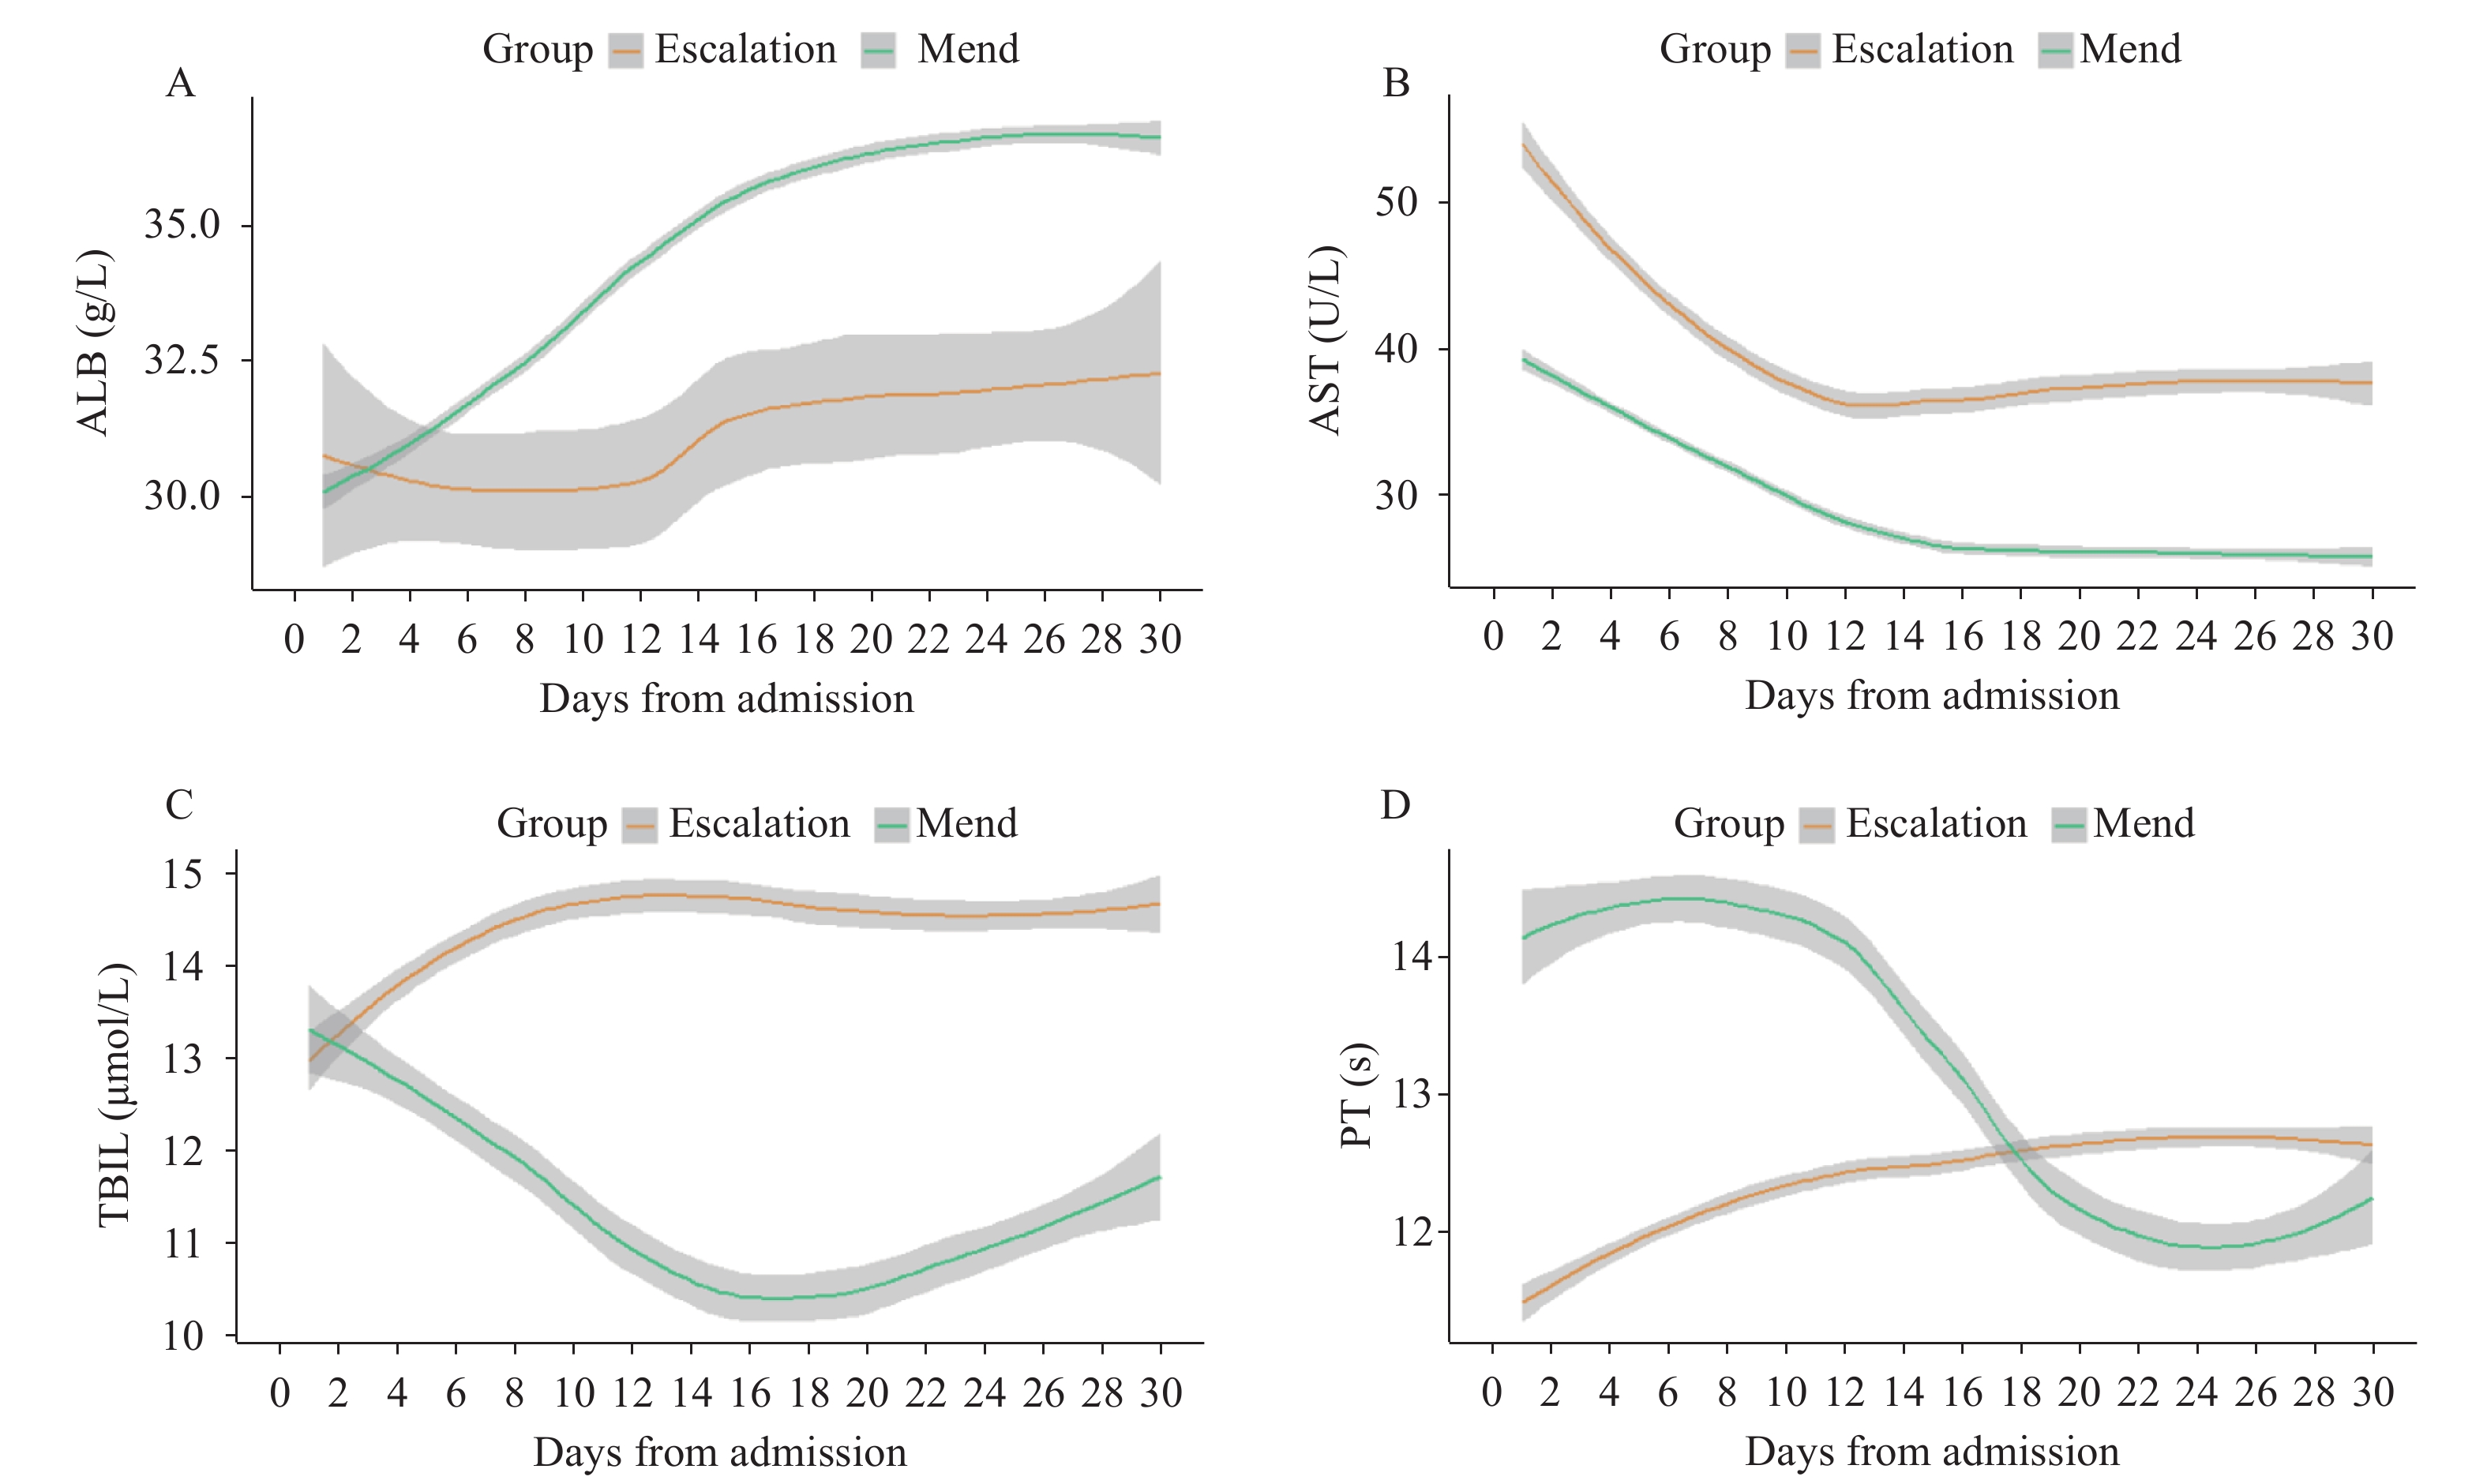 Figure 1.
Longitudinal laboratory findings of liver function based on a MCP score in escalated respiratory support patients. (A–D) Laboratory results (ALB, AST, TBIL, and PT) based on the MCP score plotted against time with 95% confidence interval, which were fitted by locally estimated scatterplot smoothing curves. Worst daily mean values for all the escalated respiratory support patients were provided, and missing data were imputed from the last day valued. Laboratory results for the escalated respiratory support patients were stratified within 30 days of admission.
Abbreviations: MCP=modified Child-Pugh; ALB=albumin; AST=aspartate aminotransferase; TBIL=total bilirubin; PT=prothrombin time.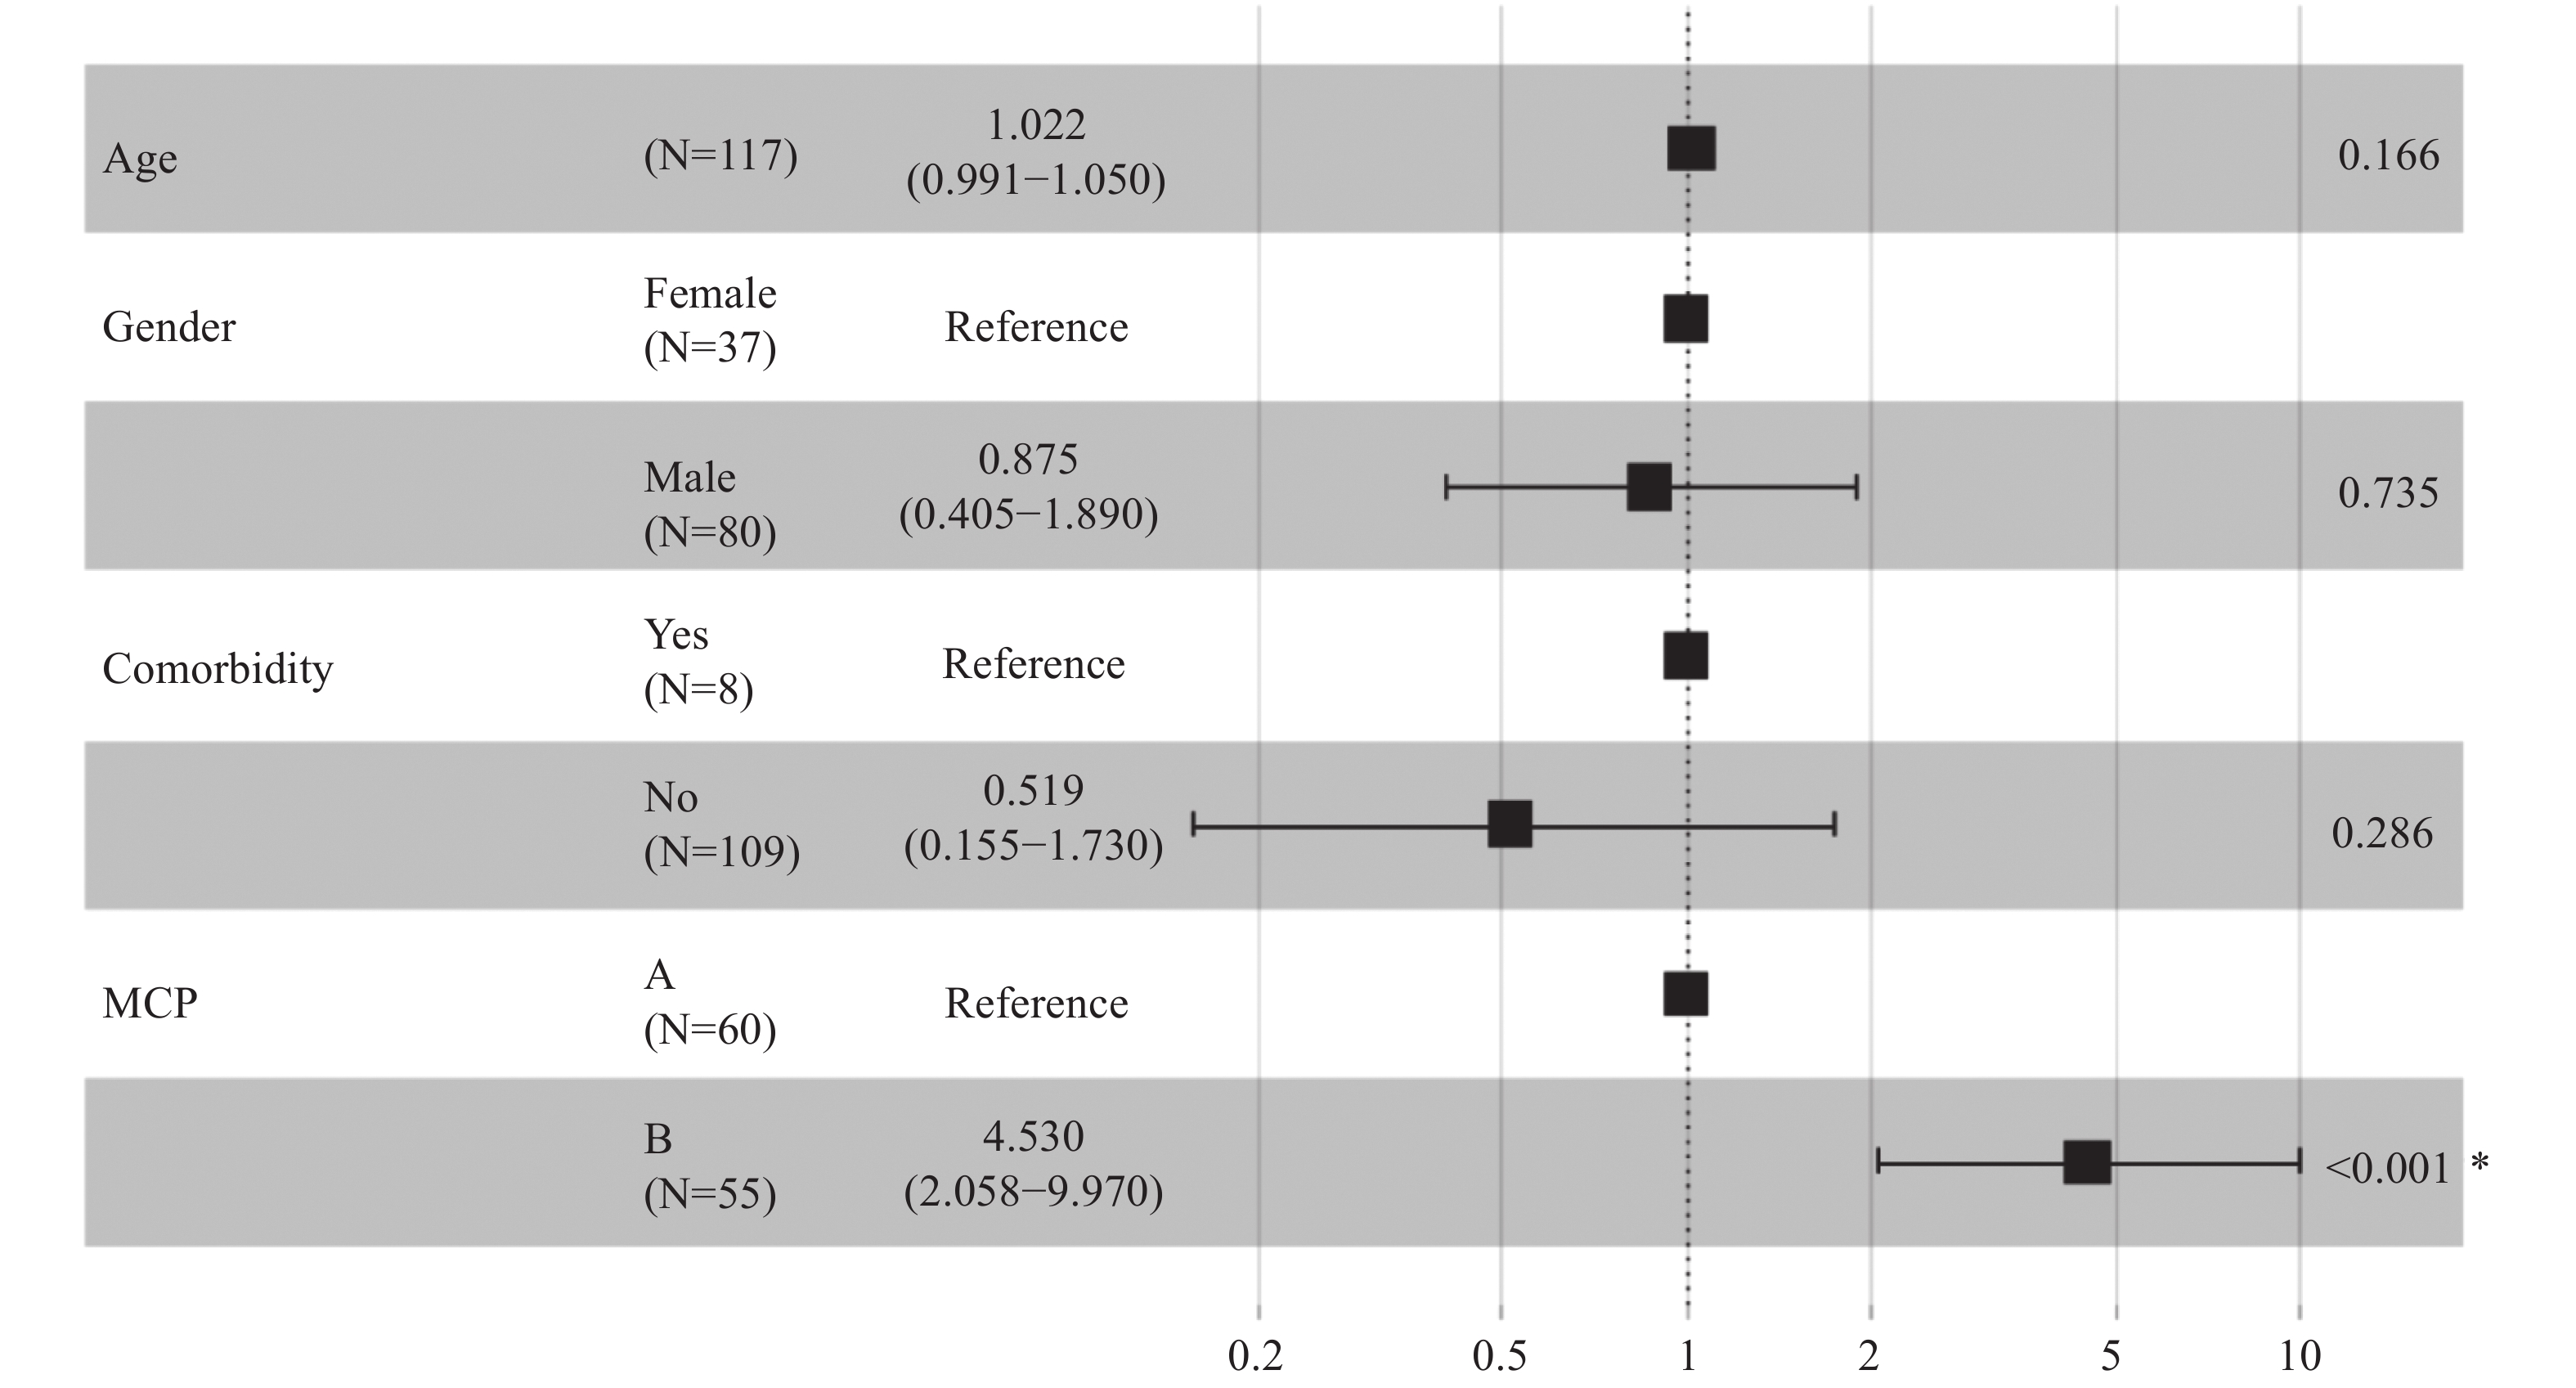 Figure 2.
Associations between modified Child-Pugh (MCP) score level and escalated respiratory support.
*: The P value is statistically significant.A total of 62 (53.0%) patients met the MCP-A level criteria, among whom 9 (14.5%) patients needed escalation; 55 (47.0%) patients met the MCP-B level criteria, among whom 26 (47.3%) patients needed escalation. For the MCP-B patients, after adjusting for age, sex, comorbidity, and drug usage, escalation time was shorter when compared to MCP-A patients (likelihood ratio test P<0.001) (Figure 3).
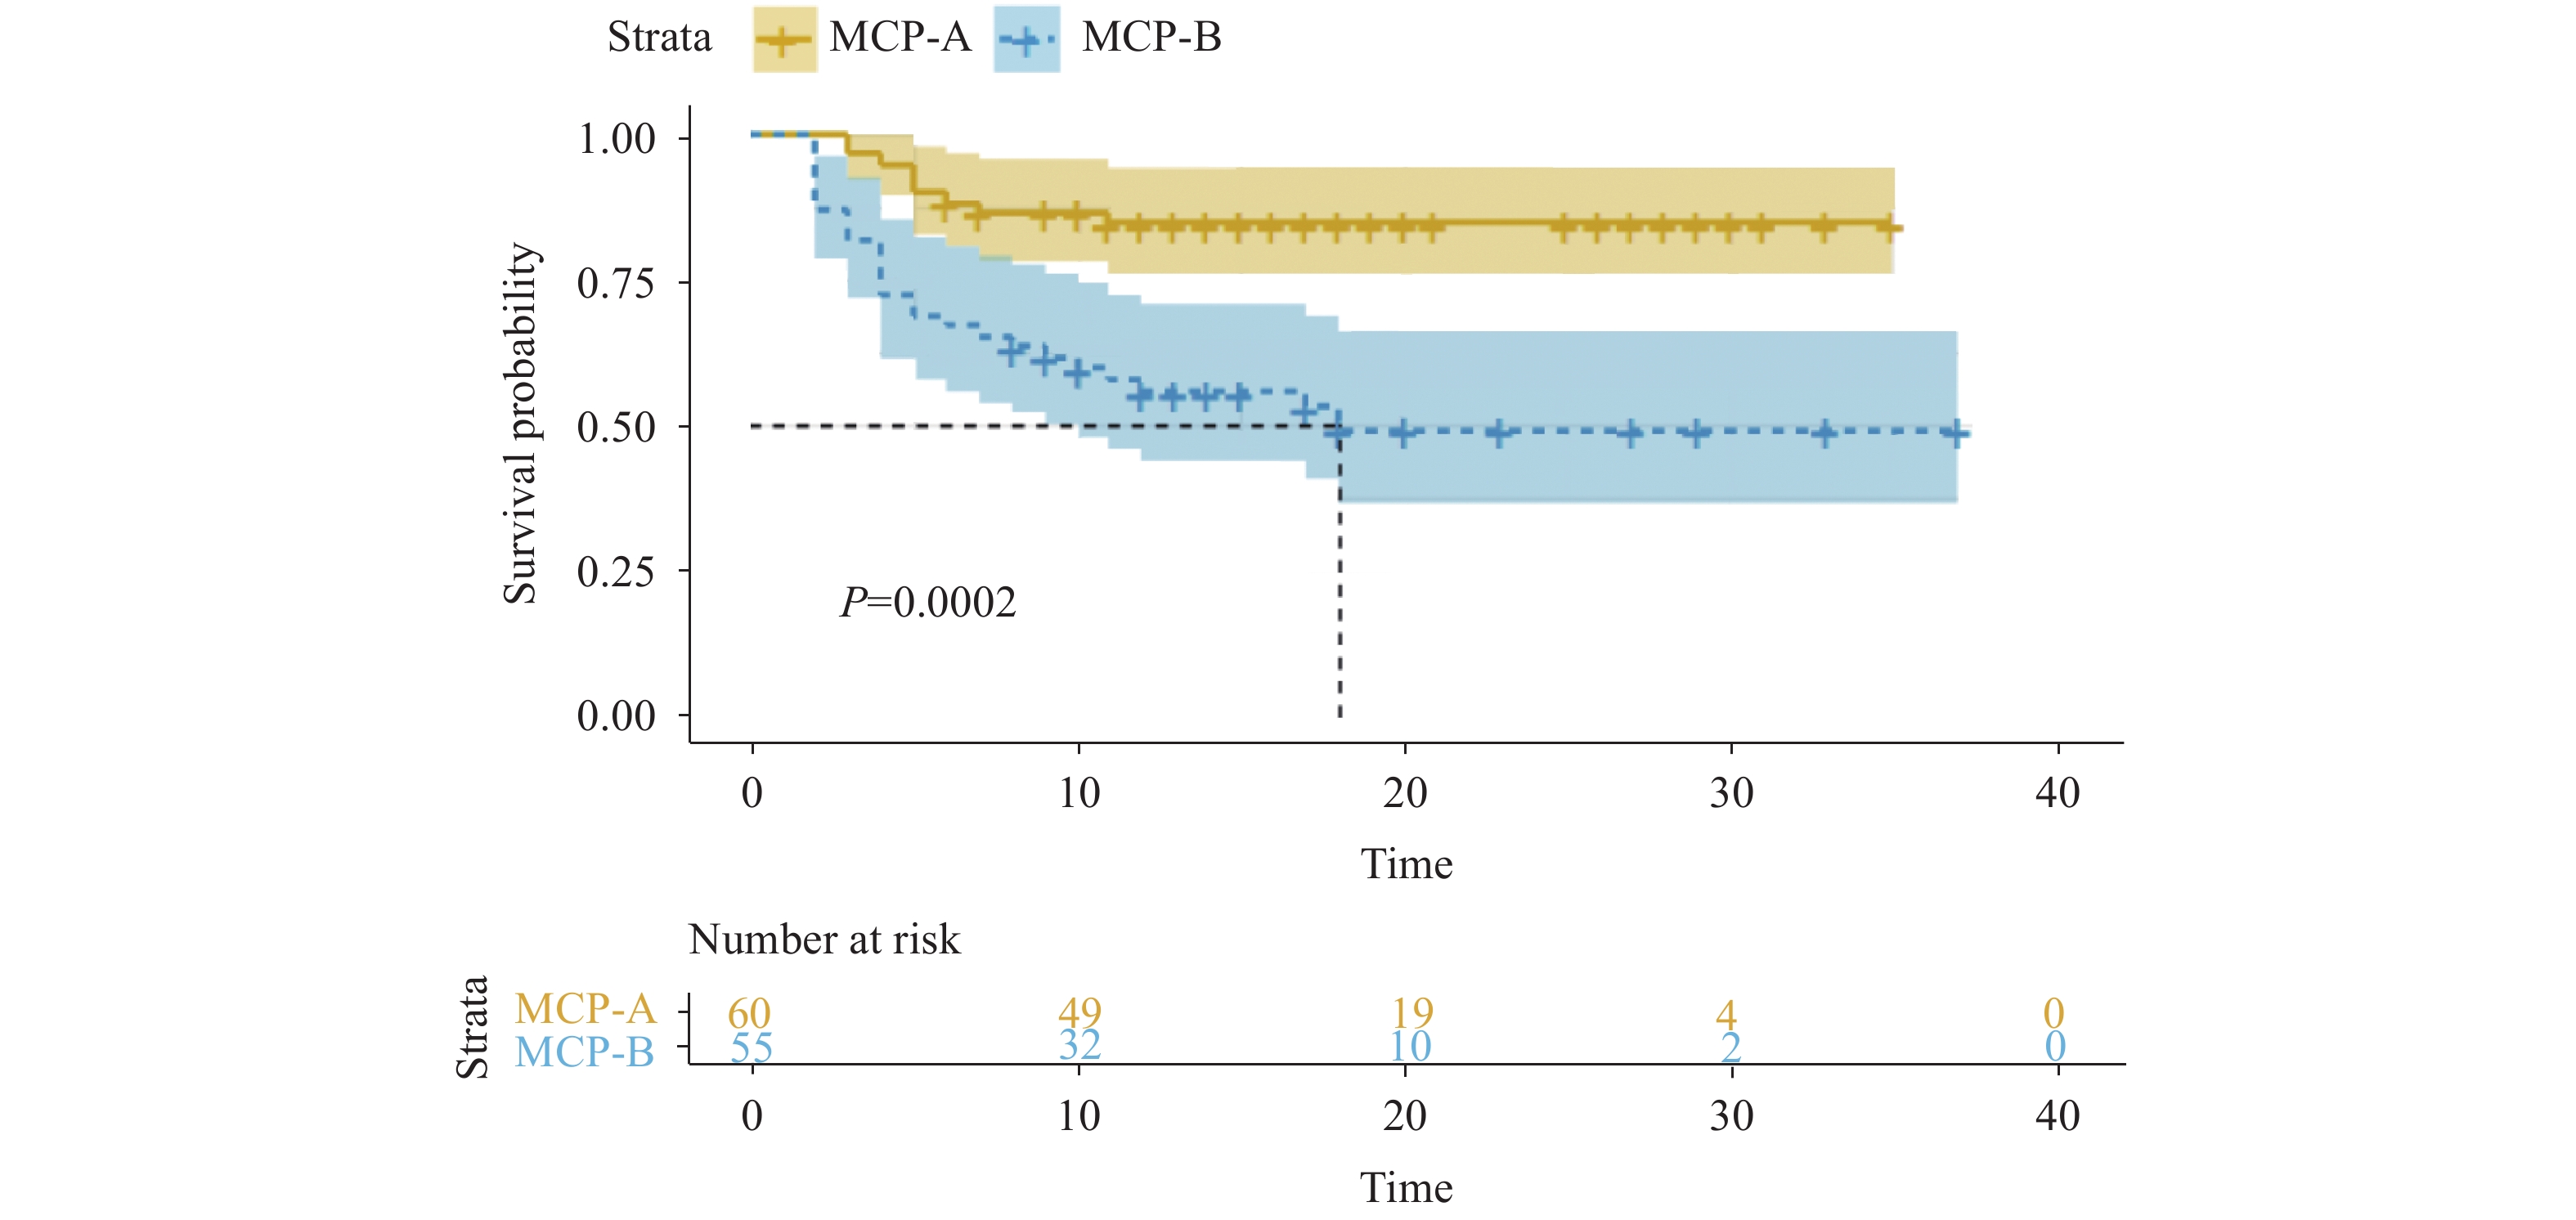 Figure 3.
Liver dysfunctions based on modified Child-Pugh (MCP) score and escalation-free survival.
Kaplan-Meier analysis of escalation-free survival in severe patients that were in need of extra oxygen support (3 points or above) within 30 days were plotted from the day of admission of every patient. Patients were stratified by which level they met the MCP score criteria. Predicted median survival is shown by the dashed line in the group with MCP-B level. -
Among the 35 patients that were eligible for escalated respiratory support, 20 survived and were discharged. Baseline laboratory results are summarized in the appendix (Supplementary Table S3). Patients that were eligible and survived were younger (61.33 years old), had a shorter PT (11.25 s), and elevated ALB levels (31.45 g/L).
A total of 9 (25.7%) patients met the MCP-A criteria upon admission while 26 (74.3%) patients met the MCP-B criteria. Overall, 5 (55.6%) patients in the MCP-A group did not survive, which was higher than the 10 (38.5%) in the MCP-B that did not survive. When analyzed using the mixed-effects Cox model, patients without liver disease comorbidities (adjusted HR: 0.128; 95% CI: 0.021–0.791; P=0.027) and that were male (adjusted HR: 0.176; 95% CI: 0.052–0.595; P=0.005) exhibited better survival probabilities (Figure 4).
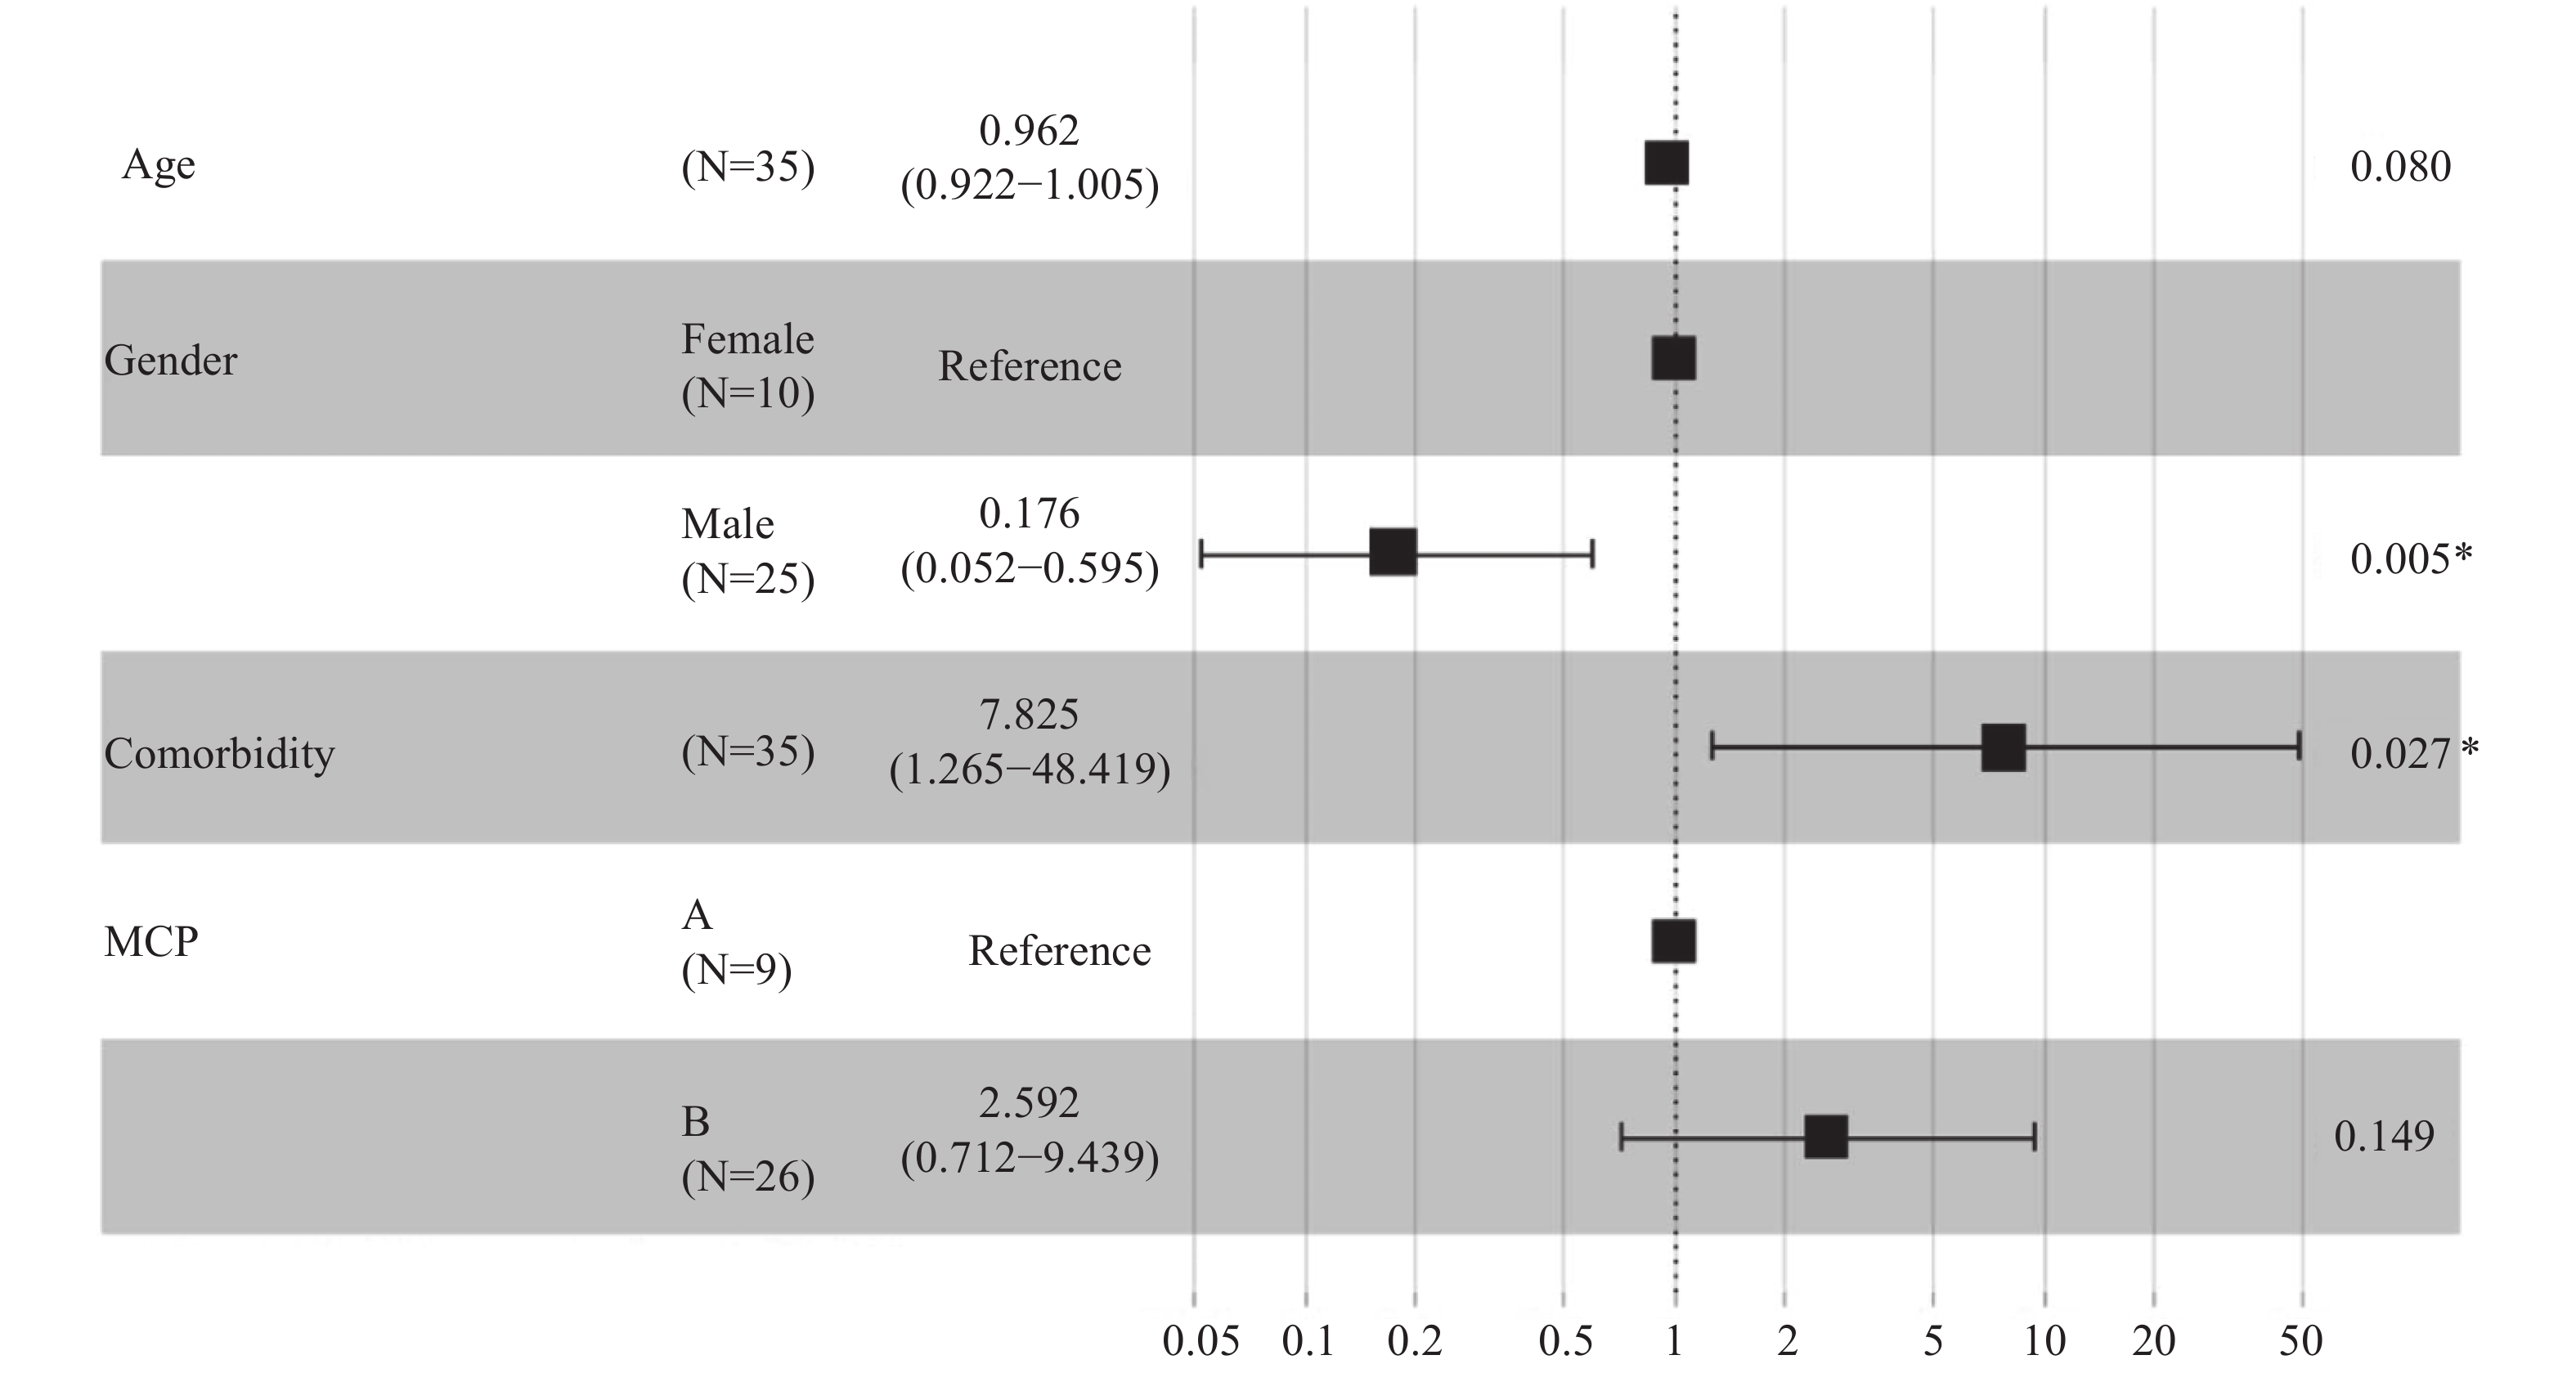 Figure 4.
Associations between modified Child-Pugh (MCP) score level and mortality
*: The P value is statistically significant. -
In this study, many patients with liver dysfunctions could be stratified based on MCP, which was closely associated with escalation of respiratory support during hospitalization. In the severe group, 47.0% of patients met the MCP-B criteria with 47.3% of them being put on escalated respiratory support.
Among the escalated patients, 74.3% were MCP-B while 25.7% were MCP-A. Eventually, lower proportions (MCP-B: 38.5%; MCP-A: 55.6%) survived. The exact reason could not be established but might be correlated with the standard of care as well as liver and multiorgan dysfunction. Moreover, it could be that more care was emphasized on severe liver dysfunction patients. In addition, liver disease comorbidity is a risk factor for escalated patients.
The association between longitudinal laboratory outcomes and clinical outcomes was also determined. Notably, at admission, elevated AST levels were frequent and more significant than increased PT in escalated patients (9). In addition, patients that were eligible for escalation had relatively the same ALB and TBIL levels upon admission, but a contradictory change was found as disease progressed, compared to those who were not eligible for escalation. Eligible patients had low ALB levels and elevated TBIL levels (7).
This study was subject to some limitations. The main limitation of this study is that it is single-center study that does not represent diverse group patients. Another limitation was that we used the last values of laboratory results to impute missing data, which could be a potential source of bias. Each patient was prescribed antibiotics, antivirals, and corticosteroids during treatment. Our data could not show the effects of the drugs for liver damage; however, drug-related liver dysfunctions should be evaluated further.
The MCP was associated with escalated respiratory support in COVID-19 patients. Since elevated levels of liver injury indicators were strongly associated with escalation, the MCP criteria should be validated with multicenter, randomized cohorts and monitored during hospitalization.
Acknowledgments: All doctors in Wuhan Jinyintan Hospital.
Conflicts of interest: No conflicts of interest.
HTML
Study Design and Participants
Data Collection
Definition
Statistical Analysis
Patient Population
Association Between Liver Dysfunction and Escalation of Respiratory Support
The Association Between Modified Child-Pugh Score Levels and Mortality
| Citation: |

|