
 Download:


-
Objective: This study aimed to identify a model for short-term coronavirus disease 2019 (COVID-19) trend prediction and intervention evaluation.
Methods: We compared the autoregressive integrated moving average (ARIMA) model and Holt exponential smoothing (Holt) model on predicting the number of cumulative COVID-19 cases in China. Based on the mean absolute percentage error (MAPE) value, the optimal model was selected and further tested using data from the United States, Italy and Republic of Korea. The intervention effect starting time points and abnormal trend changes were detected by observing the pattern of differences between the predicted and real trends.
Results: The recalibrated ARIMA model with a 5-day prediction time span has the best model performance with MAPEs ranged between 2% and 5%. The intervention effects started to show on February 7 in the mainland of China, March 5 in Republic of Korea and April 27 in Italy, but have not been detected in the US as of May 19. Temporary abnormal trends were detected in Korea and Italy, but the overall epidemic trends were stable since the effect starting points.
Conclusion: The recalibrated ARIMA model can detect the intervention effects starting points and abnormal trend changes; thus to provide valuable information support for epidemic trend analysis and intervention evaluation.
-
Coronavirus disease 2019 (COVID-19) is still a worldwide threat (1). Previous studies have developed a variety of mathematical models to simulate and predict the disease transmission pattern recently (2-3), which mainly focus on macro-level and long-term prediction over the entire course of an pandemic. However, those models may miss real-time trend changes and shorter-time disturbances. In this study, a model for short-term trend predictions and evaluation of interventions was developed. By comparing the autoregressive integrated moving average (ARIMA) model and Holt exponential smoothing (Holt) model on effects of predicting the number of cumulative cases in different regions and countries, the optimal model was identified and further tested using data from the US, Italy, and Republic of Korea. The results indicated that the recalibrated ARIMA model was suitable for short-term prediction of COVID-19 trends and could detect the intervention effect starting time points. Based on the analysis, the effects of interventions started to show on February 7, 2020 in the mainland of China, March 5, 2020 in Republic of Korea, April 27, 2020 in Italy, and May 19, 2020 in the United States. This model can provide valuable information to support evaluating interventions, resource allocation, decision-making, and situation monitoring. Given the ongoing COVID-19 pandemic, this study could serve as a reference to initiate more adaptable and practice-based epidemic trend analysis tools that can benefit pandemic responders in different countries.
-
Data of confirmed cases in the mainland of China were obtained from the official websites of China’s National Health Commission and local health commissions. Hubei Province was excluded since its diagnostic criteria was revised (4). The numbers of cumulative confirmed cases in Guangdong, Henan, Zhejiang, Hunan, and Anhui provinces, as well as the total number of cases in the mainland of China (except Hubei), were used for developing the model. Provincial data from the report starting date to February 24, 2020, and national data from January 19 to February 24, 2020 were included for analysis. The daily cumulative number of confirmed cases in the US, Republic of Korea, and Italy were collected from the World Health Organization (WHO) COVID-19 situation reports and the Johns Hopkins University dashboard (5), and these data were used for model testing and trend analysis.
ARIMA and Holt models were applied for short-term prediction on daily number of cumulative cases in China (except Hubei) and selected provinces. The ARIMA model capitalized on the associations in the sequentially lagged relationships that exist in the given dataset. The Holt method, also known as the double exponential model, is an extension of single exponential smoothing and can be used to analyze the time series data with levels and trends. Model performance was compared across a 5-day, a 6-day, and a 7-day prediction time spans, respectively. Mean absolute percentage error (MAPE) (Equation 1) was used to evaluate the prediction accuracy between the predicted and actual values, and the model with the best MAPE was selected.
$$ MAPE=\frac{\sum \frac{\left|A-P\right|}{A}\times 100}{N} $$ (1) A: actual value; P: predicted value; N: number of days predicted.
The mainland of China (except Hubei) with a 5-day prediction time span was used as an example. First, the number of daily cumulative cases from the first day to January 31, 2020 was used for prediction from February 1 to February 5. Then, data as of February 5 were used for prediction from February 6 to February 10, and the prediction would loop to the next 5-day span until February 24. The prediction was made for every 5-day period and each model was re-calibrated by including updated data. The epidemic trend was analyzed by applying the optimal model on data of the US, Italy, and Republic of Korea. Predictions started when the new cases were reported for three consecutive days. Therefore, the confirmed cases of the US, Republic of Korea, and Italy since the first report day to March 20, February 18, and February 23 was used as the first training set. Subsequent predictions were done every 5 days until May 19, 2020 using the same method. Since the prediction error tends to increase as the prediction time extend, only the predicted values for every fifth day were kept to exclude the influence of prediction error on epidemic trend analysis. By analyzing the pattern of differences between predicted and observed trends (Equation 2), the time points that might reflect either the starting of intervention effect or the occurrence of unexpected incidents can be detected. For example, if a negative difference pattern (more actual cases than predicted) changed to a positive one (more predicted cases than actual), the changing point might reflect the effects of interventions since the predicted trend still followed the previous upward trend pattern, whereas the real trend was flattened due to intervention effects.
$$ Difference=P-A $$ (2) Modelling analysis were performed using auto.arima() and holt() functions in the forecast package in R software (version 3.6.2; RStudio Inc; US) (6).
-
For a 5-day prediction time span, both ARIMA and Holt models showed excellent model performance (MAPE <5%) regardless of study regions (Table 1). The overall prediction accuracy of the ARIMA model was slightly better (overall MAPEs: 3.07% vs. 4.11%) than the Holt model (Figure 1). Lower MAPEs were observed in 5-day prediction (3.07%, range: 2.05%–5.05%) compared to that in the 6-day (4.31%, range: 3.06%–6.72%), and the 7-day (5.13%, range: 2.02%–10.26%) predictions. The Holt model yielded the similar result and also favored the 5-day prediction span.
Area Models MAPEs February 1–5 February 6–10 February 11–15 February 16–20 February 21–24 February 1–24 The mainland of China ARIMA 0.99 4.14 1.28 1.07 6.25 2.60 Holt 0.87 4.15 1.86 1.69 4.61 2.55 Guangdong ARIMA 14.80 5.01 0.89 3.13 0.54 5.05 Holt 14.80 4.95 1.21 4.76 0.63 5.47 Zhejiang ARIMA 2.99 5.16 1.99 0.57 5.64 3.17 Holt 3.82 5.16 3.45 0.64 5.64 3.66 Henan ARIMA 4.94 8.58 0.40 1.71 0.14 3.28 Holt 4.94 8.63 1.22 2.41 0.14 3.61 Hunan ARIMA 4.91 2.84 1.62 0.32 0.17 2.05 Holt 13.60 4.11 3.53 0.87 0.10 4.62 Anhui ARIMA 2.03 2.02 2.21 4.36 0.20 2.25 Holt 14.27 2.10 4.64 1.85 0.05 4.77 Abbreviations: ARIMA=autoregressive integrated moving average model; COVID-19=coronavirus disease 2019; Holt=Holt exponential smoothing model; MAPEs=mean absolute percentage errors. Table 1. MAPEs between reported and predicted numbers of COVID-19 cases of the mainland of China (excluding Hubei Province) and five provinces in China using ARIMA and Holt models (%).
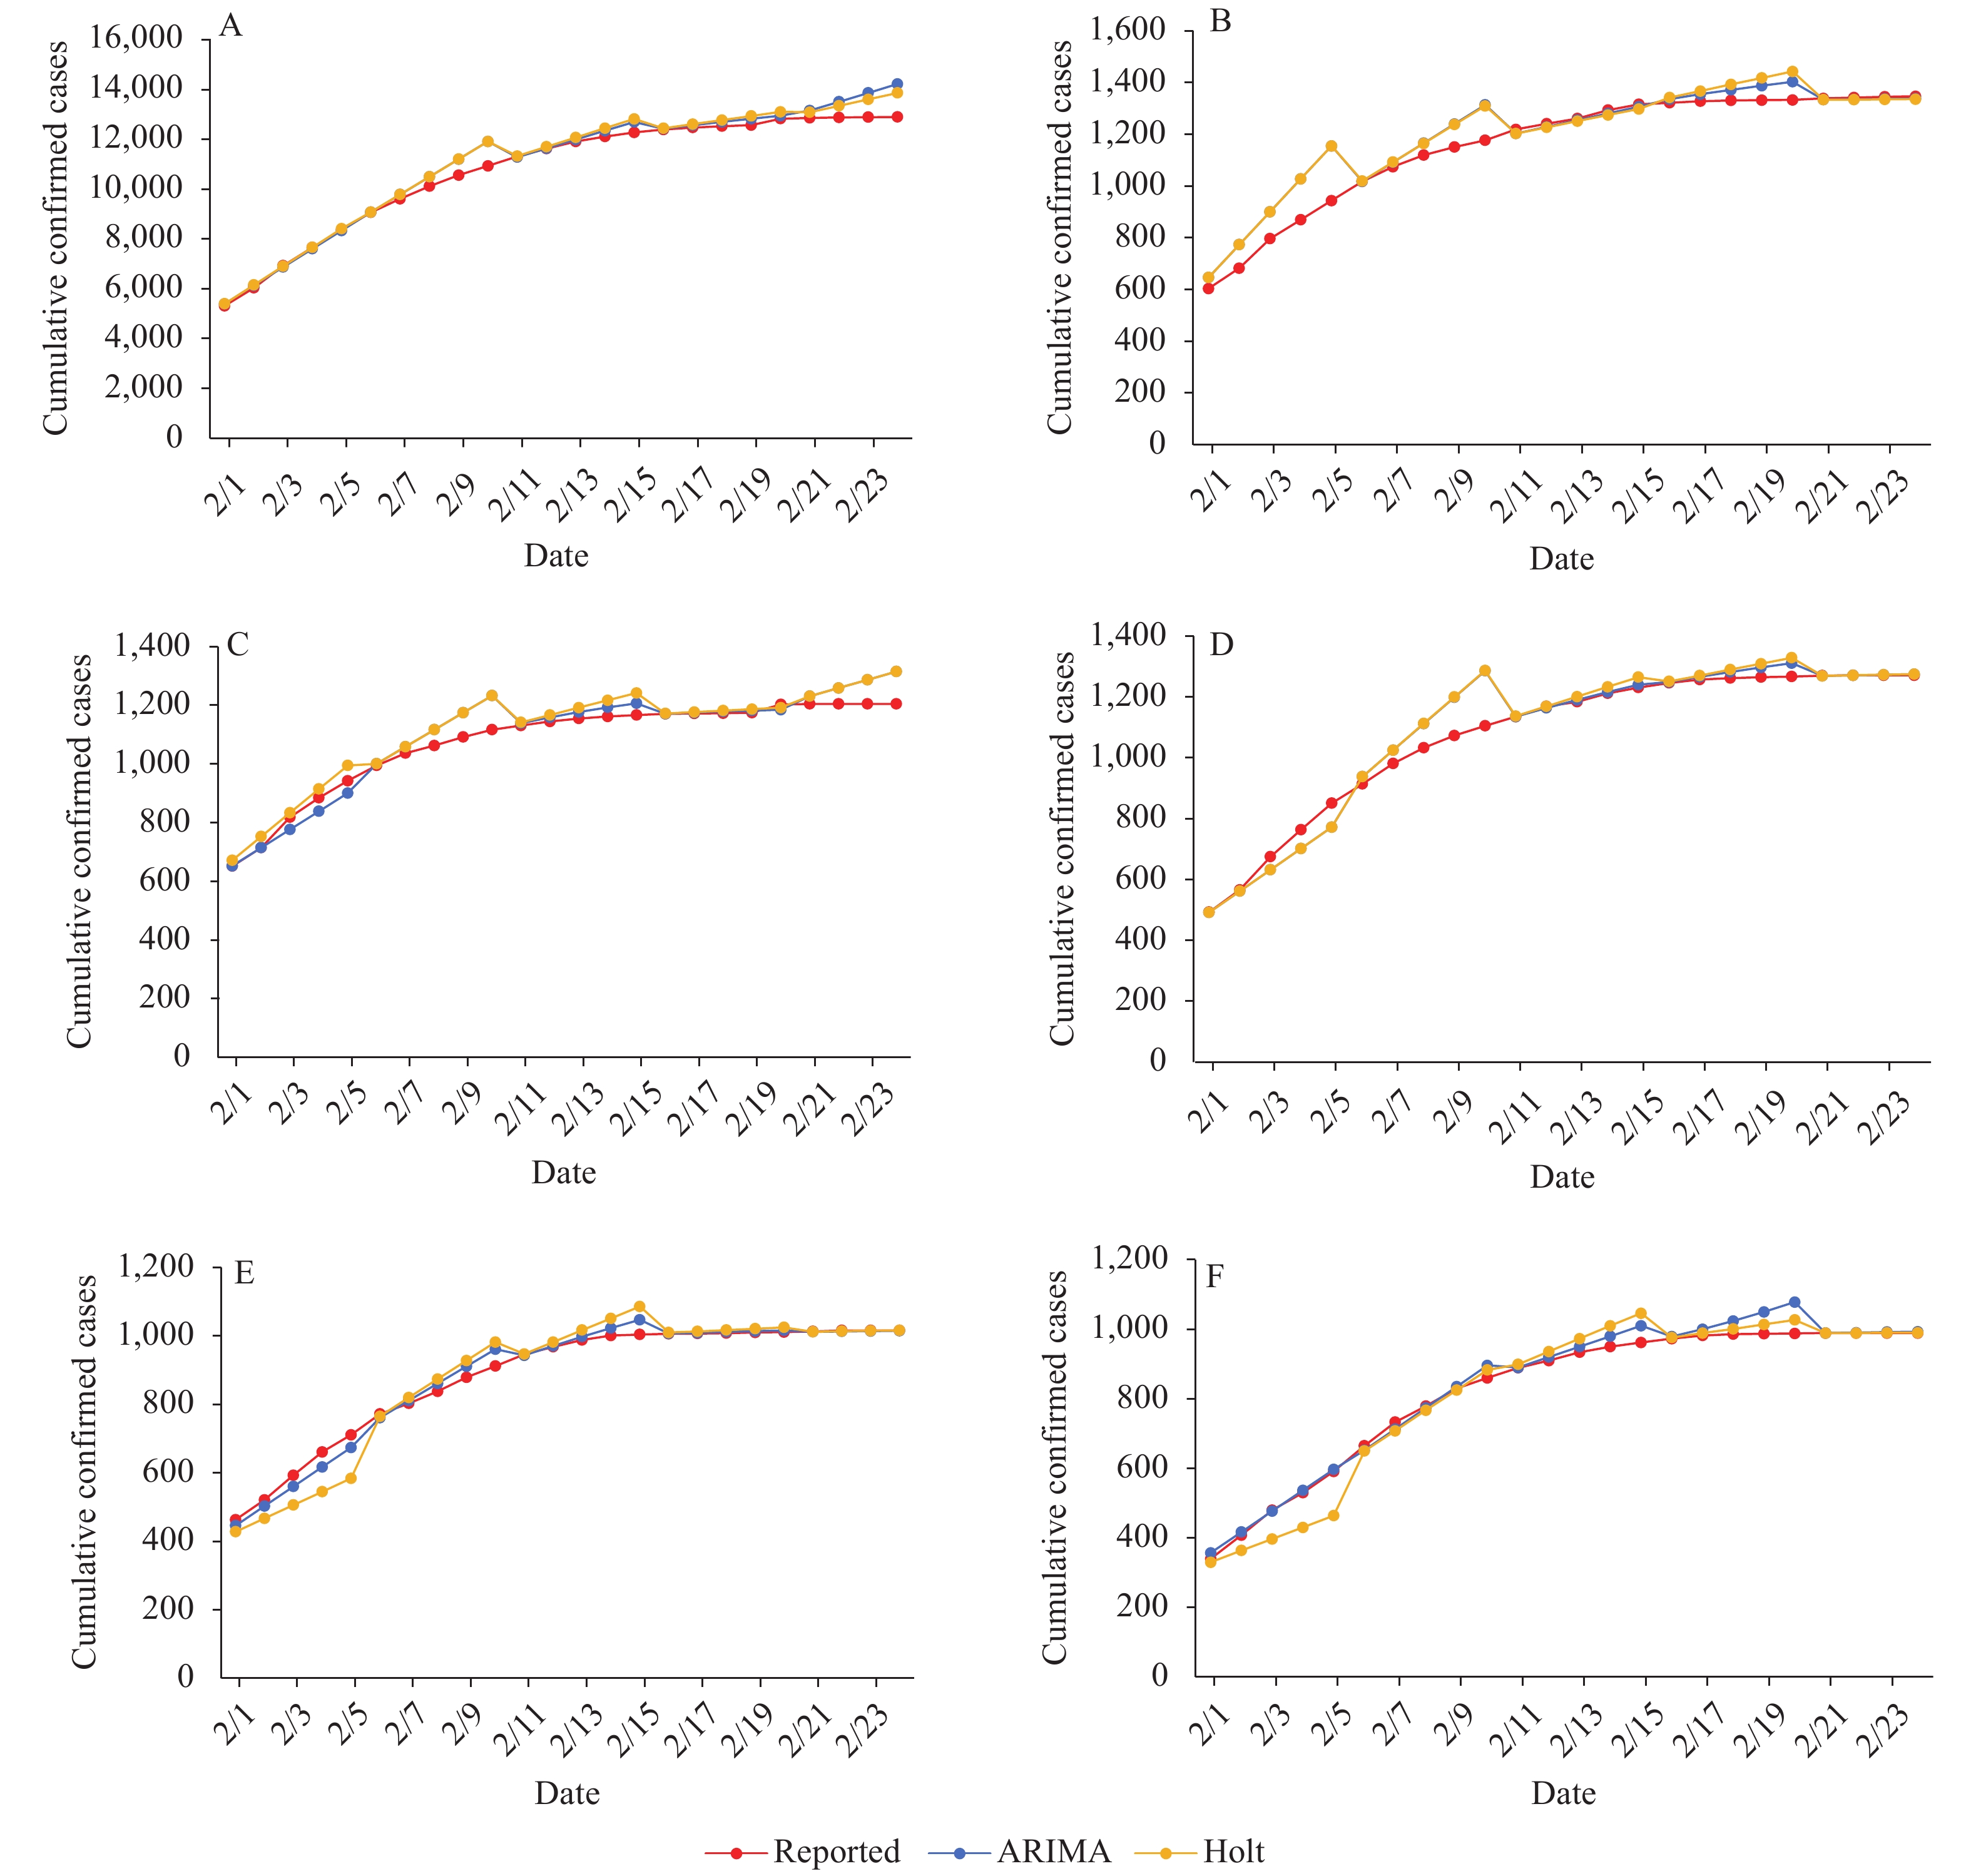 Figure 1.
Comparison between reported and predicted numbers of COVID-19 in the preceding 5 days using ARIMA model and Holt model in the mainland of China (except Hubei) (A), Guangdong (B), Zhejiang (C), Henan (D), Hunan (E), and Anhui (F).
Abbreviations: COVID-19=Coronavirus disease 2019; ARIMA=autoregressive integrated moving average model; Holt=Holt exponential smoothing model.Based on the results, the ARIMA model with a 5-day prediction time span was further tested using data from the US, Italy, and Republic of Korea. ARIMA also performed well for the other three countries in the late-stages (Figure 2). Almost all the difference values were positive after February 7 in the mainland of China, March 5 in Republic of Korea, and April 27 in Italy. However, the predicted versus observed differences still fluctuated between positive and negative values in the US as of May 19.
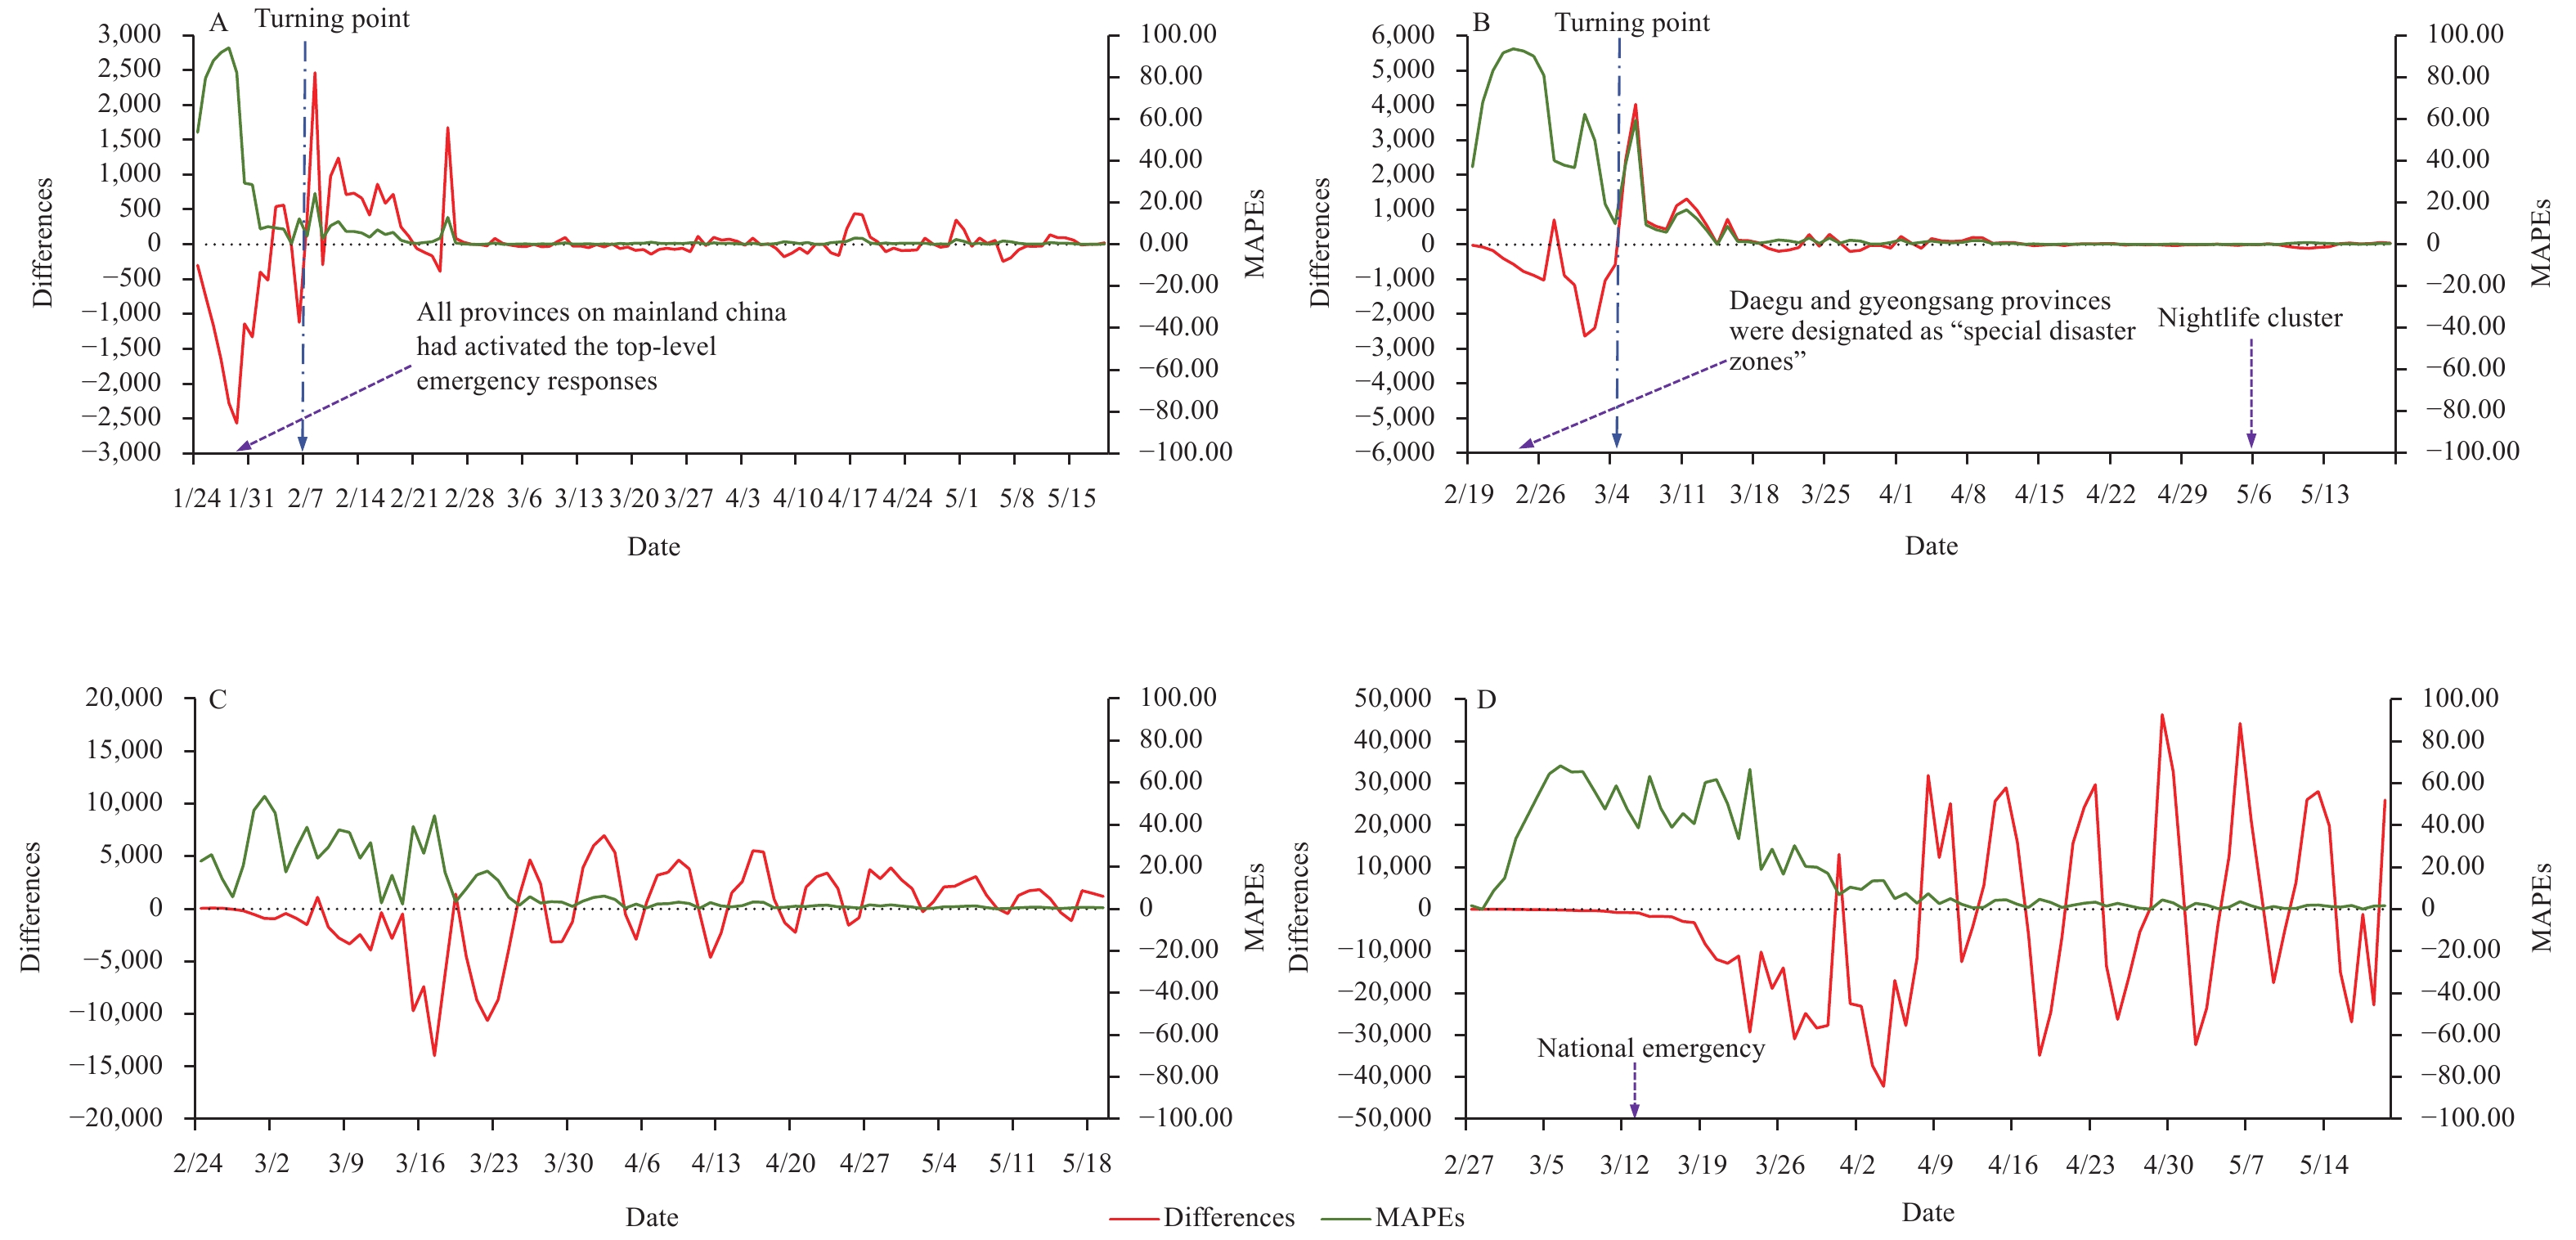 Figure 2.
Differences and MAPEs (%) between reported and predicted numbers of daily COVID-19 cumulative confirmed cases in the mainland of China (A), Republic of Korea (B), Italy (C), and the United States (D).
Abbreviations: COVID-19=corona virus disease 2019; MAPEs=mean absolute percentage errors; Differences: the predicted number minus the reported number. -
This study initiated a new framework for epidemic trend analysis by focusing on short-term prediction and real-time recalibrated modeling. Prospectively, the ARIMA model accurately predicted the number of cumulative cases over a 5-day prediction time span. Compared to the Holt model, the ARIMA model has its merits in more accurate predictions, especially during the early epidemic period when the trend was less stable, and the training data was insufficient. Retrospectively, the model can be applied to evaluate whether or not and when the intervention measures had taken effect and to detect the occurrences of abnormal incidents and whether the incidents’ effect had lasted by analyzing the pattern of differences between the predicted and observed trends. For China, Republic of Korea, and Italy, the predicted trend was generally lower than the observed trend before a certain date but were higher than or almost in accordance with the observed trend after that date. This alteration potentially reflected the infection control intervention effects. The Chinese government started to enact a series of infection control measures and implemented travel bans and urban transportation suspensions in Wuhan (7), and as of January 29, 2020, all provincial-level administrative divisions in the mainland of China had activated the top-level emergency responses to COVID-19 (8). Similarly, a series of measures were conducted in Republic of Korea since the first imported case was confirmed. In Italy, intensive and strict measures were implemented in late February and early March. Considering the incubation period and the latent effect, the intervention effect started to be sensible around February 7 in China, March 5 in Republic of Korea, and April 27 in Italy. Considering the time between the intervention starting point and the effect point, China had the shortest interval to reach the point of effect and was followed by the Republic of Korea.
In addition, we noticed several abnormal trend changes. For example, the observed trends slightly exceeded the predicted trends in the last several days after a considerably stable period in the Republic of Korea (Figure 2). Further investigation revealed that this fluctuation might be related to a reported cluster of cases in a popular nightlife district (9).
This study was subject to some limitations. Since the ARIMA modeling must be based on sufficient training data, the short-term prediction is not applicable when the epidemic just started, and time series data were lacking. The model performance may vary based on the reliability and diverse epidemic characteristics in different regions; therefore, the generalizability of the model may be limited to some degree. As such, we recommend that real situation should be fully considered before applying.
Above all, the real-time recalibrated modeling method has its merits in capturing the dynamic nature of the epidemic and providing time sensitive information to guide public health responses to COVID-19.
Conflicts of interest: The authors who have taken part in this study declared that they did not have any potential conflicts of interest.
Funding: Zhejiang University special scientific research fund for COVID-19 prevention and control (2020XGZX003), Zhejiang Provincial Innovation Team (2019R01007), Zhejiang Province Key Laboratory (2020E10004), Zhejiang Provincial Natural Science Foundation (LEZ20H260002).
HTML


| Citation: |

|