
 Download:


-
Introduction: In the early stages of the coronavirus disease 2019 (COVID-19) epidemic in China, the highest level of public health emergency response (Level 1 Response) was launched in all province-level administrative divisions (PLADs) across the country. Provision of vaccination services was selectively suspended due to the physical distancing and gathering restrictions required of the Level 1 Response. The purpose of this paper is to evaluate the impact of COVID-19 on vaccination services and the effectiveness of selective vaccination service suspension and catch-up vaccinations in China.
Methods: Vaccine doses administered, routine vaccination coverage levels, catch-up vaccine doses administered, and coverage levels after the catch-up campaign were determined from individual vaccination records in sampled clinics, standard routine immunization administrative coverage reports, and catch-up vaccination activity reports submitted by PLADs between October 2019 and October 2020.
Results: National Immunization Program (NIP) and non-NIP vaccine doses administered in sampled clinics decreased by 80% and 90%, respectively, compared with doses administered before the COVID-19 pandemic. Coverage with the birth dose of hepatitis B vaccine (HepB1) and the Bacillus Calmette-Guérin vaccine (BCG) — two vaccinations recommended to continue throughout the epidemic due to their time-critical nature — were maintained at over 85%, while coverage of other NIP vaccines decreased to below 60% by February 2020. Catch-up vaccination coverage of the 29 PLADs, excluding Xinjiang and Xizang (Tibet), began in April 2020 and exceeded 90%; Hubei catch-up coverage was 95% by October 2020.
Conclusions and Implications for Public Health Practice: The COVID-19 pandemic had a great impact on China’s vaccination services. During the epidemic and time of local transmission of the coronavirus, HepB1, BCG, rabies vaccine for postexposure prophylaxis, and tetanus antitoxin (TAT) for wound prophylaxis were maintained at high levels. Of the 69 million vaccine doses postponed during the time of local transmission of the coronavirus, 94% were administered in the catch-up campaign. China’s pandemic immunization practices may provide evidence for other countries’ immunization programs.
-
The coronavirus disease 2019 (COVID-19) pandemic is the fastest spreading, most widespread, and most difficult to prevent and control public health emergency of the last 100 years (1). In the early stages of the pandemic in China, the highest level of public health emergency response (Level 1) was launched by the government for all province-level administrative divisions (PLADs) (2). Strict countermeasures, including limiting crowded gatherings, stopping in-person schooling, and closing factories were used to prevent community transmission of the coronavirus (3).
Provision of vaccination services was hampered by the physical distancing and restrictions on crowded gatherings required of a Level 1 Response. On February 3, 2020 the China CDC issued “Interim Guidelines for Vaccinations during the COVID-19 Epidemic,” and the Professional Committee on Vaccines and Health (PCVH) issued “Guiding Principles for Vaccination During the COVID-19 Pandemic.” These guidelines required that four vaccines — the birth dose of hepatitis B vaccine (HepB1), the birth dose of Bacillus Calmette-Guérin vaccine (BCG), rabies vaccine for postexposure prophylaxis, and tetanus antitoxin (TAT) for wound prophylaxis — continued to be administered on time and that most vaccination services were to be suspended in response to the outbreak (4). Most children therefore missed or had delays in routine vaccination due to professional and parental concerns about risk of infection in vaccination clinics (5).
In early March 2020, the highest level of public health emergency response was lowered in most areas outside of Hubei Province. On March 15, the National Health Commission (NHC) of the People’s Republic of China issued a notice on coordinating the prevention and control of the COVID-19 epidemic and carrying out vaccination in a comprehensive and orderly manner (6). On March 16, China CDC developed guidelines for catch-up vaccinations for children who missed or had delays in vaccination due to COVID-19. China CDC delivered more than ten online training sessions for the guidelines to ensure proper implementation of catch-up and routine vaccination services.
Key elements of the catch-up vaccination guidelines were as follows: 1) make full use of the joint prevention and control mechanism for the COVID-19 pandemic to mobilize and inform parents of children at appropriate ages for vaccination through rural government officials, sub-district offices (resident committees), and community service centers; 2) strengthen staff safety and protection, provide timely routine vaccination services, establish a reasonable vaccination catch-up process by identifying individual children in need of catch-up vaccinations and enhance pre-examination and consultation on vaccinations; and 3) implement vaccination services according to dynamically-adjusted coronavirus risk levels and avoid crowds at vaccination clinics by using appointments, increasing daily service hours, offering vaccination services during weekends, and reducing the number of accompanying persons.
This study reported an evaluation of the impact of the COVID-19 pandemic on routine vaccinations, compliance with suspension and catch-up guidelines, and completion of catch-up vaccinations in China.
-
The study setting was the mainland of China. Population sizes served in China’s 40,134 townships were collected based on the administrative division code. The Probability Proportional to Zize (PPS) method was used to select 200 townships at random for evaluation. First, the reported numbers of children served in the townships in 2019 were used as the sampling frame to calculate the cumulative numbers of the children served. The last cumulative number (i.e., the total number) was divided by 200 to obtain a sampling interval. Second, a random number smaller than the sampling interval was generated as a starting number. The township with the first cumulative number containing the starting number was taken as the 1st primary sampling unit (PSU). Third, the 2nd PSU was selected by the township with the cumulative number containing the total of the starting number plus 1×the sampling interval. The 3rd PSU containing the total of the starting number plus 2×the sampling interval. The sampling process was repeated until all the 200 PSUs were determined. These townships had a total of 324 vaccination clinics, and all vaccination clinics (county and above levels, township health centers, community health service centers, village-level clinics, obstetrics clinics, non-NIP vaccine independent clinics, and rabies vaccination clinics) were included.
In 2017, the Immunization Information System (IIS) functionally operated in 95% (49,704/52,263) of the vaccination clinics in China (7). When more than 80% of the children were included in IIS and the consistency rate of vaccine doses administered was more than 90%, the IIS was used to evaluate the vaccine doses administered quickly and accurately (8). In these sampled vaccination clinics where IIS was functional, provincial-level CDCs obtained IIS records of individual children under 8 years old who were served by the clinics between October 2019 and June 2020.
Monthly routine immunization administrative reports were obtained from all township vaccination clinics nationwide and aggregated the reports by county, city, provincial, and national levels. We enumerated monthly changes of vaccine doses administered and coverage of NIP and non-NIP vaccines with these reports.
Provincial immunization programs reported catch-up vaccination activities conducted from July to October, including progress of catch-up vaccination, routine services provided by vaccination clinics, vaccine doses administered, and coverage attained through catch-up vaccination with NIP and non-NIP vaccines.
SQL (version 11.0.6.1776; Oracle Research Institute) was used to calculate vaccine doses administered.
-
The December 2019 average weekly vaccine doses administered was used as the baseline of doses administered. On January 25, 2020, the Level 1 Response was declared, and most vaccination clinics suspended services. Figure 1 shows the number of NIP vaccine doses administered over time in Hubei Province and China outside of Hubei. The week after the declaration of the Level 1 Response, NIP vaccine doses administered declined by 90% for 4 weeks; in Hubei Province, doses administered remained low for 6 weeks. Following issuance of catch-up guidance, national catch-up vaccination activity began during the week of March 16–March 22, and vaccinations rapidly returned to pre-pandemic levels. Figure 1 also shows non-NIP vaccine doses administered over time. Non-NIP vaccine doses administered declined more sharply than NIP vaccine doses administered and remained low for a longer time.
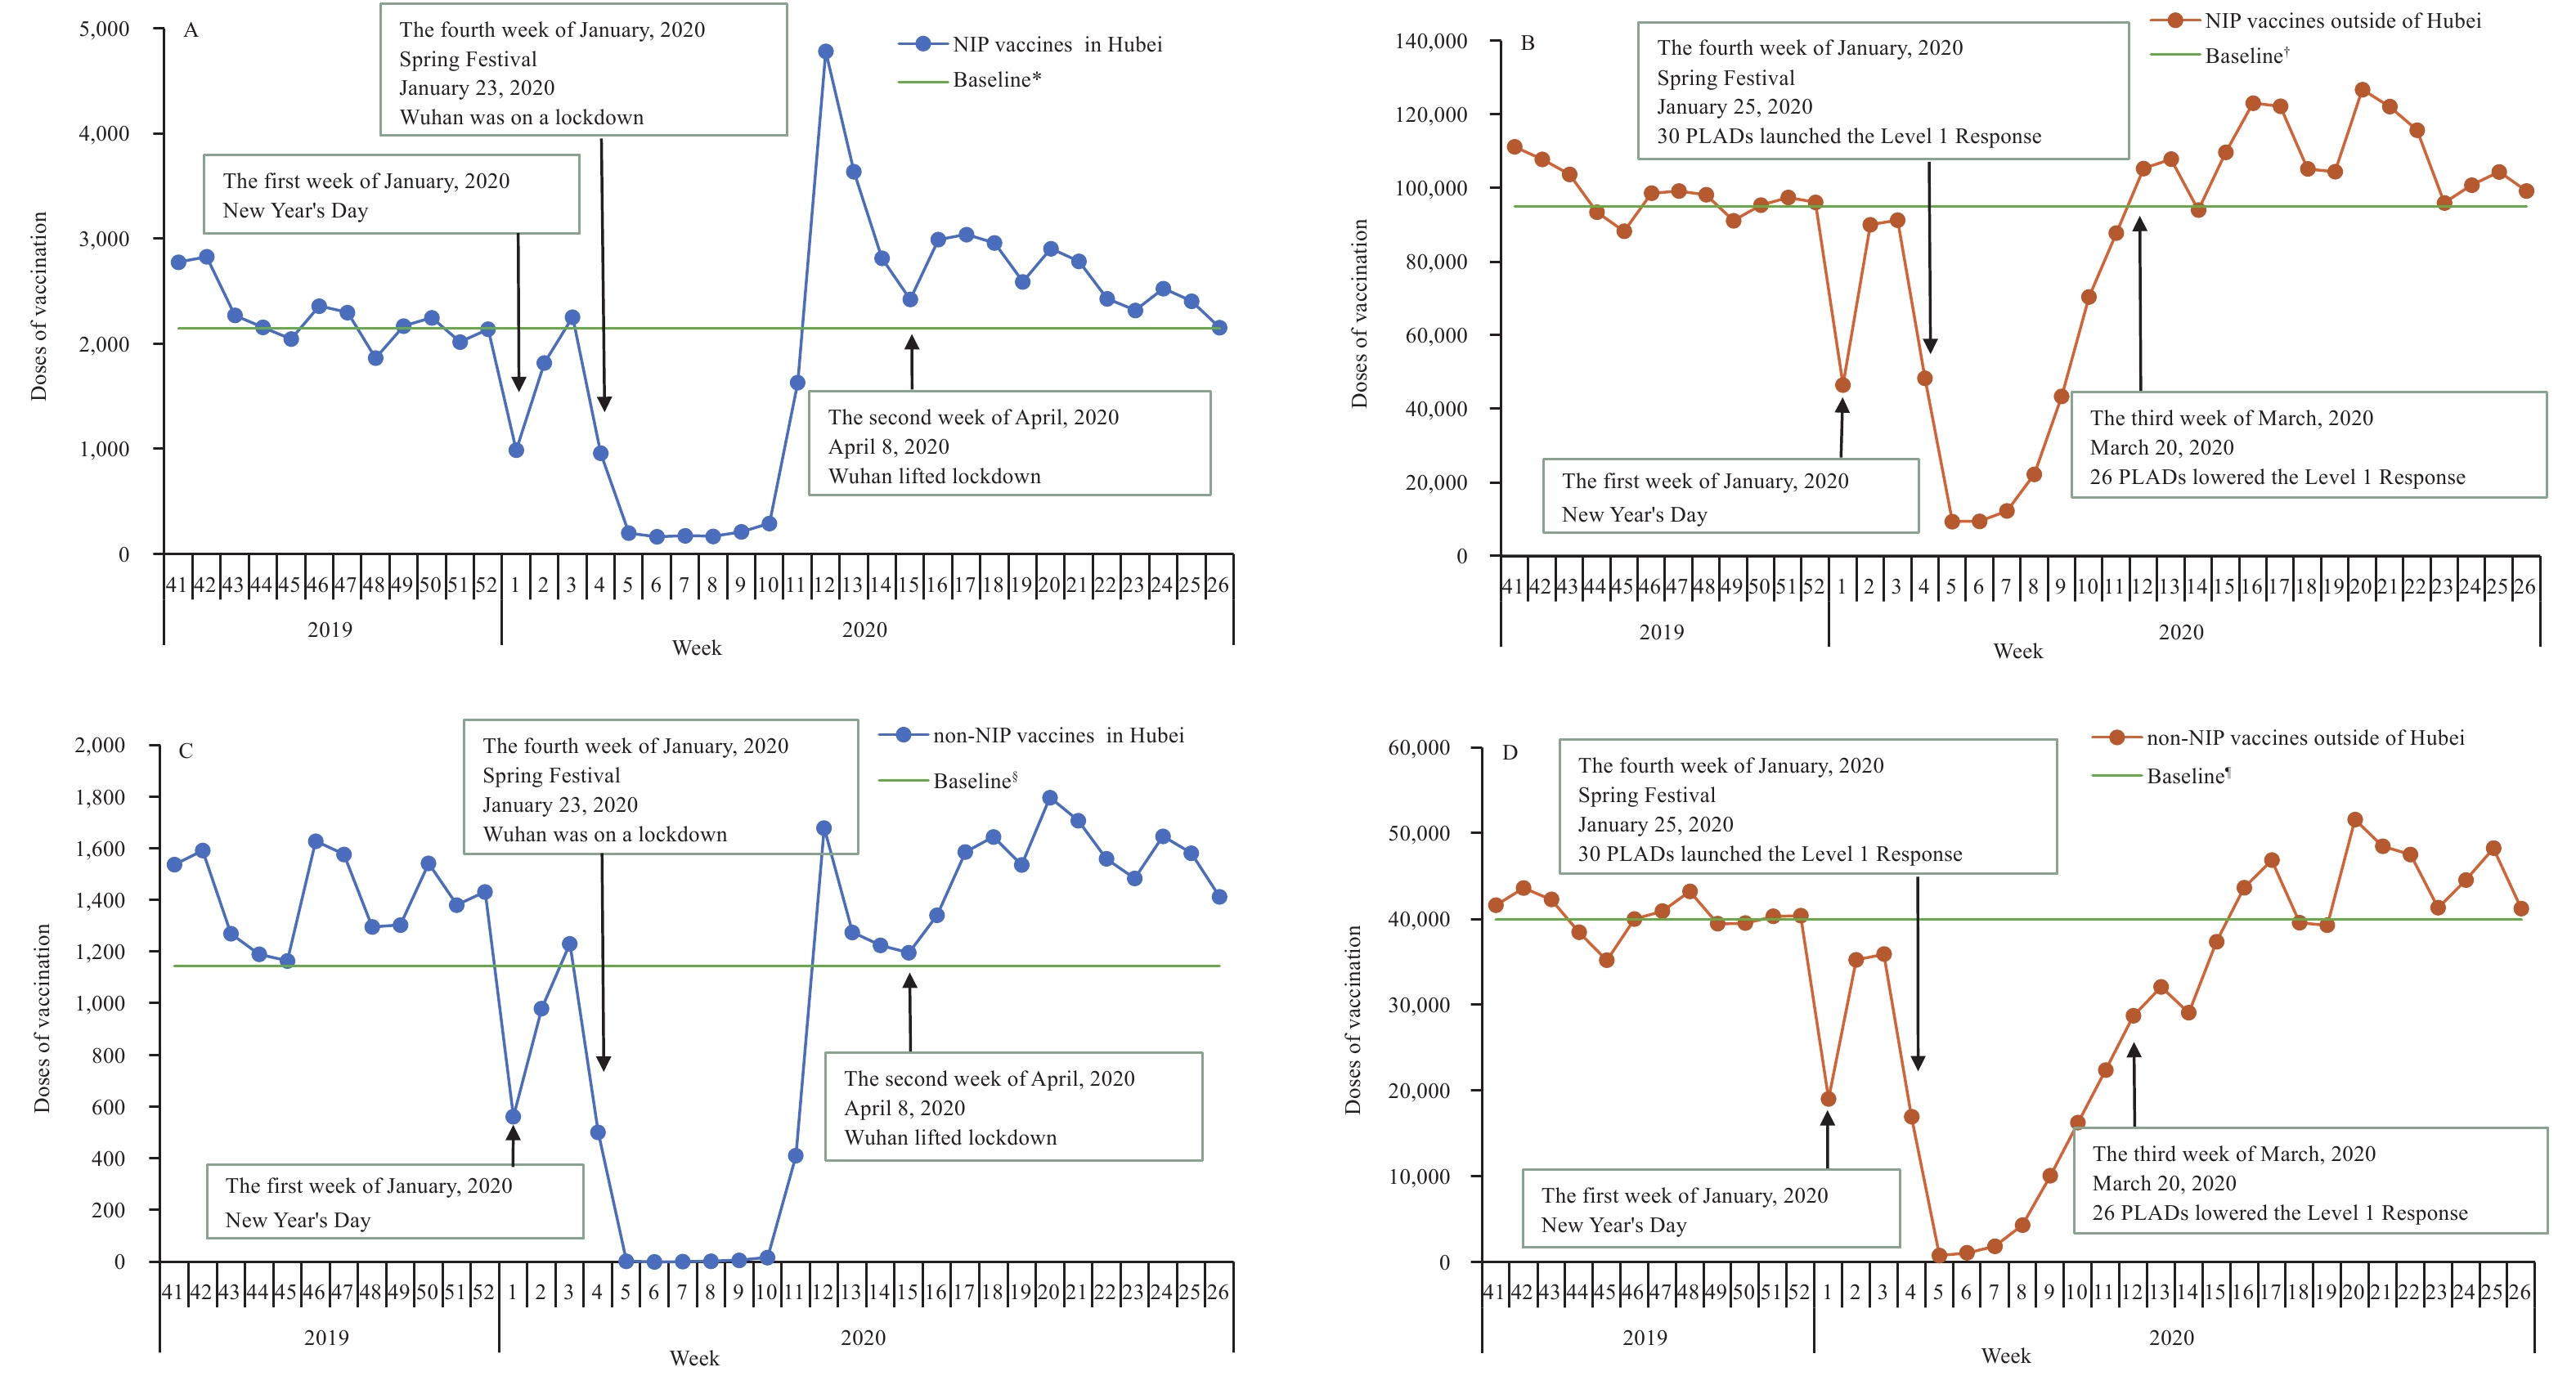 Figure 1.
NIP and non-NIP vaccine doses administered weekly in sampled vaccination clinics. (A) NIP vaccine doses administered in Hubei Province. (B) NIP vaccine doses administered outside of Hubei Province. (C) Non-NIP vaccine doses administered in Hubei Province. (D) Non-NIP vaccine doses administered outside of Hubei Province. Abbreviations: NIP=National Immunization Program; PLADs=province-level administrative divisions.
* The December 2019 average weekly NIP vaccine doses administered as a baseline of doses administered in Hubei Province. † The December 2019 average weekly NIP vaccine doses administered as a baseline of doses administered in China outside of Hubei Province. § The December 2019 average weekly non-NIP vaccine doses administered as a baseline of doses administered in Hubei Province. ¶ The December 2019 average weekly non-NIP vaccine doses administered as a baseline of doses administered in China outside of Hubei Province.Between January 23, 2020 and March 20, 2020, 41 (13%) of the 324 vaccination clinics surveyed continuously provided routine vaccination services for all vaccines; 283 (87%), including all Hubei clinics, suspended vaccination services for vaccines other than HepB1, BCG, rabies, and tetanus.
Figure 2 shows coverage on the 20th of each month for timely HepB1 and BCG vaccines, the primary series of 3 doses of poliovirus vaccine, 2 doses of measles-containing vaccine (MCV), 3 doses of hepatitis B vaccine (HepB), and 3 doses of diphtheria, tetanus toxoids and acellular pertussis combined vaccine (DTaP). Coverage began to decline in January 2020 and reached the lowest levels in February. Coverage for vaccines that were recommended to continue during clinic suspensions (HepB1 and BCG) decreased little, but the other vaccines had marked declines in coverage. Coverage began to recover in March after vaccination catch-up activities began and returned to December 2019 levels by May or June.
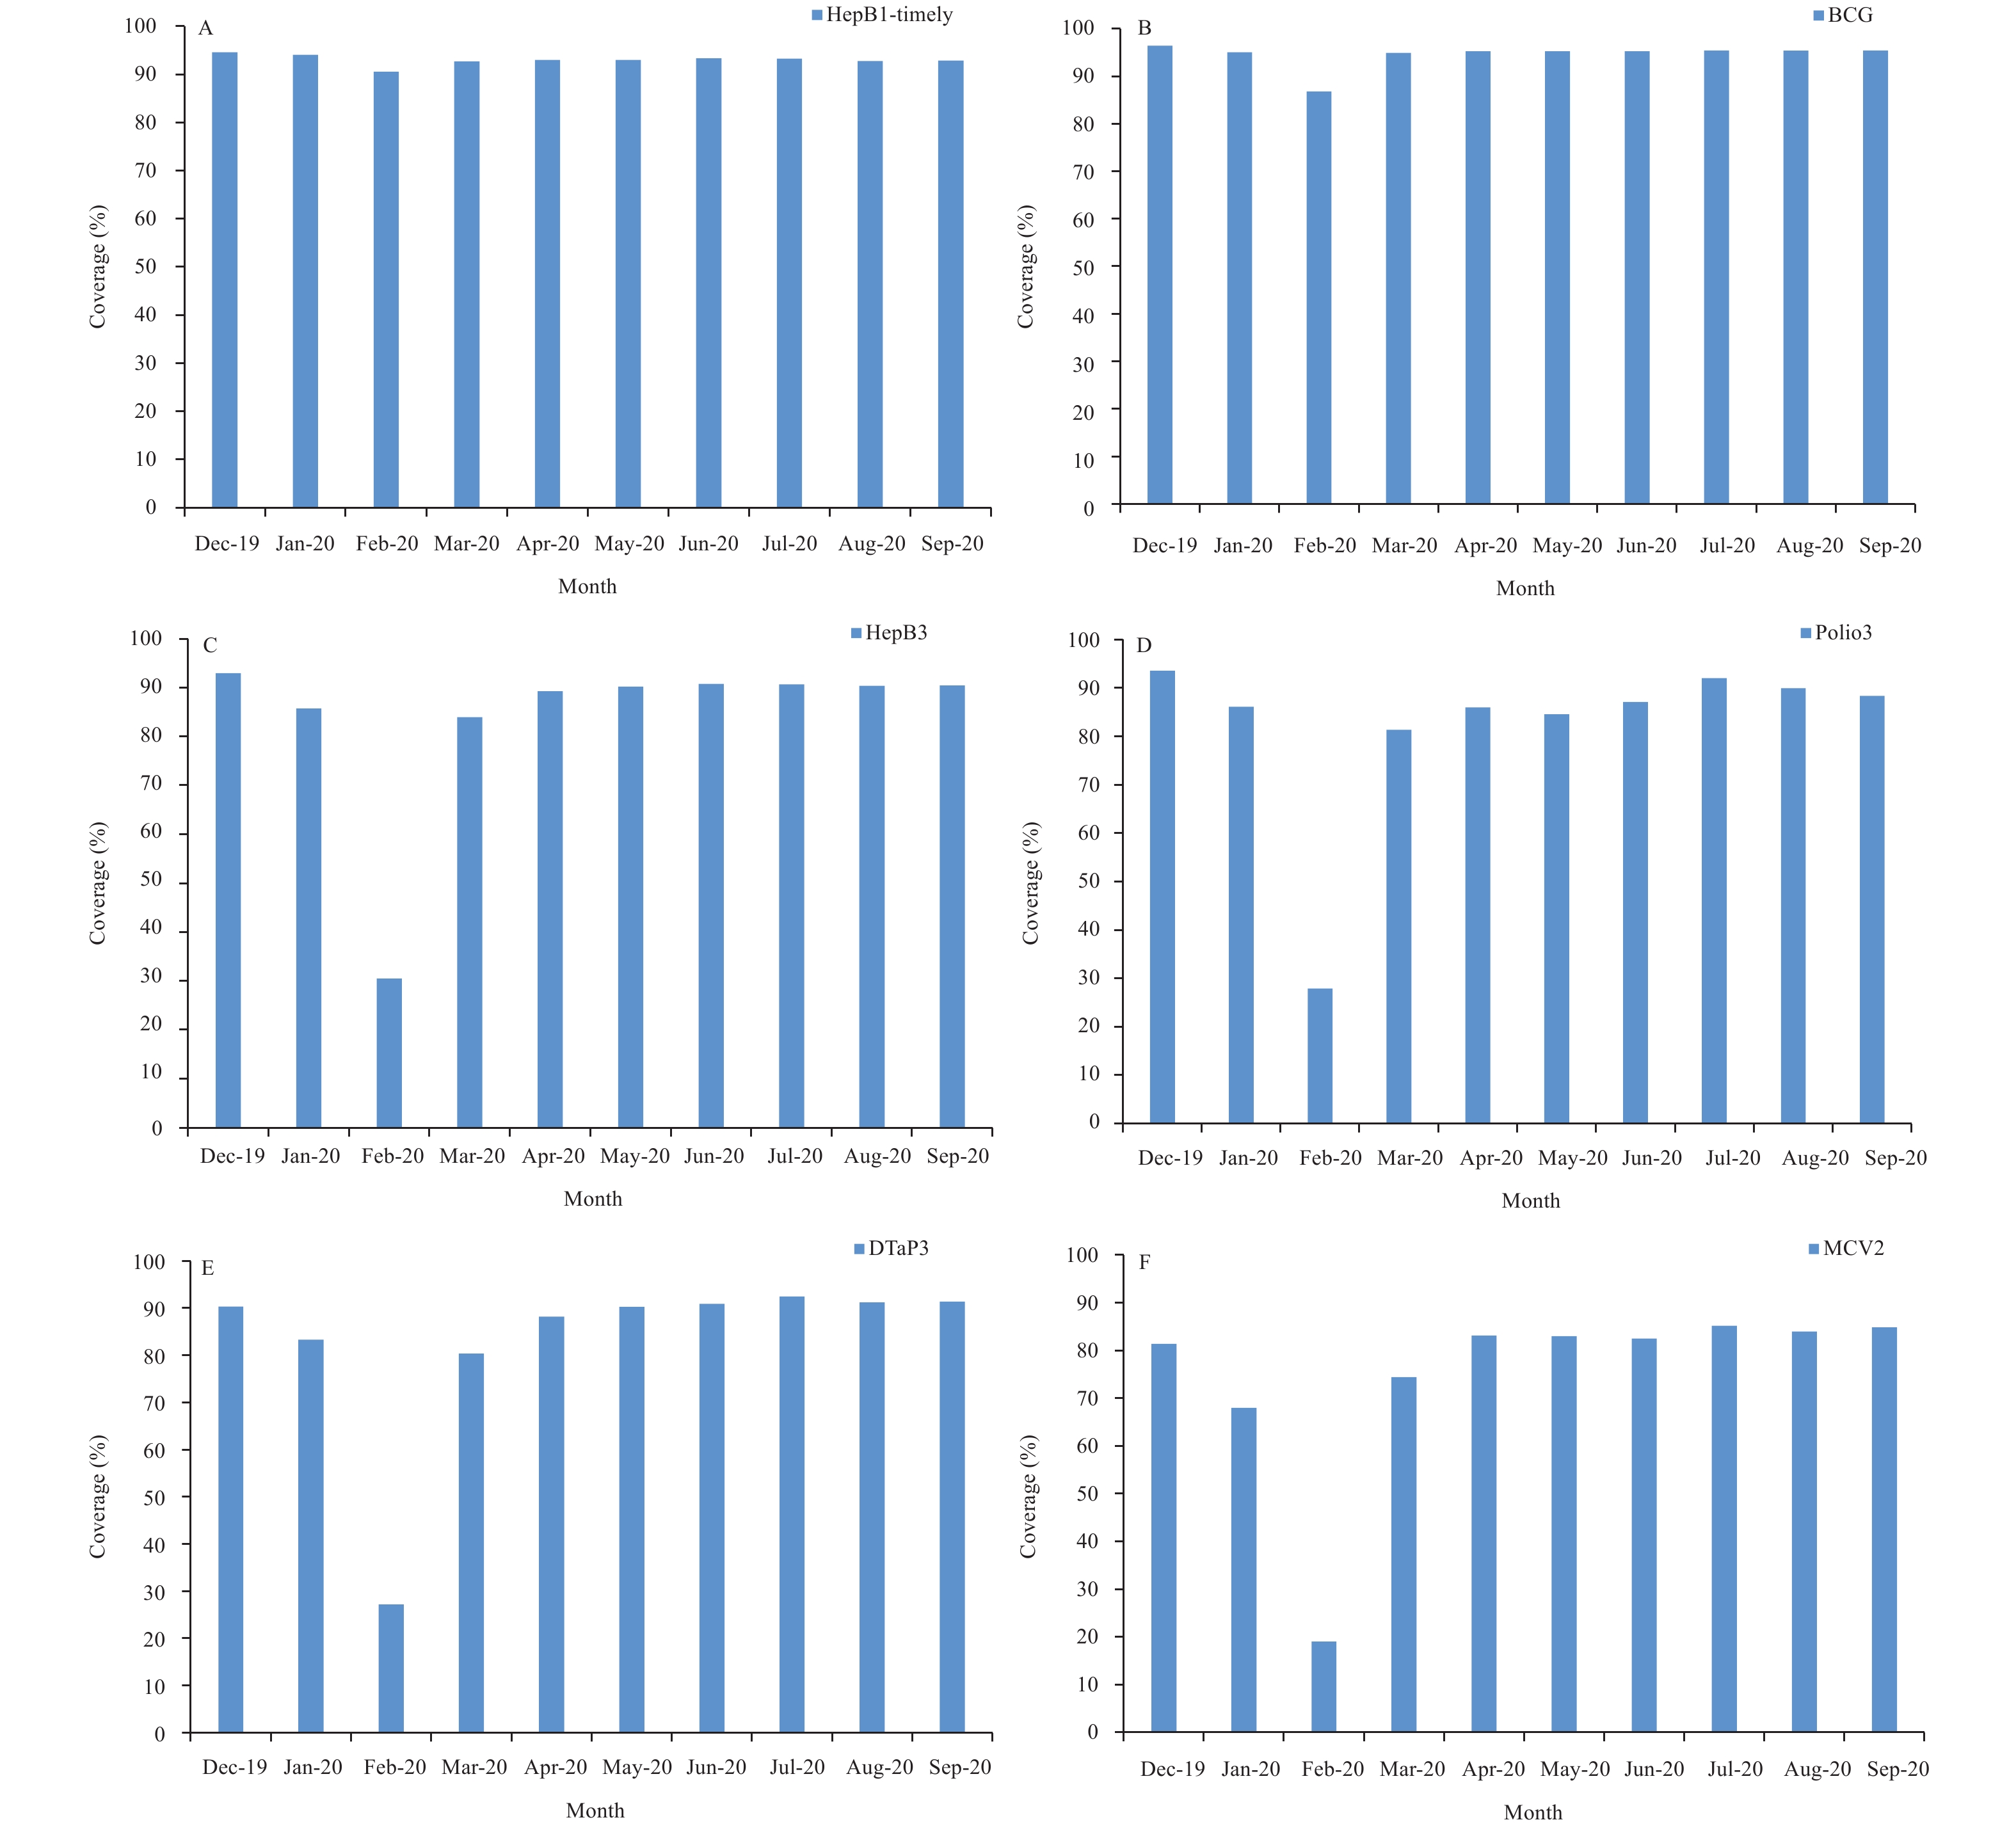 Figure 2.
Coverage for specific vaccines reported by provincial-level administrative divisions based on standard vaccine administrative coverage reports. (A) Coverage for the 1st dose of HepB-timely vaccine. (B) Coverage for BCG vaccine. (C) Coverage for the 3rd dose of HepB vaccine. (D) Coverage for the 3rd dose of poliovirus vaccine. (E) Coverage for the 3rd dose of DTaP vaccine. (F) Coverage for the 2nd dose of measles-containing vaccine. Abbreviations: HepB=hepatitis B vaccine; BCG=Bacillus Calmette-Guérin vaccine; Polio=polioviru vaccine; DTaP=diphtheria, tetanus toxoids and acellular pertussis vaccine; MCV=measles-containing vaccine.
Table 1 shows results of the catch-up activities and resumption of routine immunization services PLAD-by-PLAD as of October 31, 2020. Among all clinics, 98.6% (range by PLAD: 83.6%–100.0%) were offering routine immunization services; PLADs had identified 69,245,168 NIP vaccine doses that needed to be caught up; among these, 93.9% (rang: 61.1%–100.0%) were administered by the end of October. Provinces identified 21,125,450 non-NIP vaccines that needed to be caught up; by the end of October, 96.2% (range: 87.0%–100.0%) had been administered.
PLADs Vaccination clinics NIP vaccines Non-NIP vaccines Percent providing services (%) Delayed doses* Catch-up doses Proportion (%) Delayed doses† Catch-up doses Proportion (%) Beijing§ − − − − − − − Tianjin 100.0 32,075 31,630 98.6 9,762 9,502 97.3 Hebei 99.9 7,228,632 6,964,041 96.3 2,669,102 2,509,140 94.0 Shanxi 99.9 1,462,997 1,346,620 92.1 405,745 382,112 94.2 Inner Mongolia 99.8 939,486 893,109 95.1 186,617 183,835 98.5 Liaoning 99.9 1,118,704 1,054,974 94.3 261,928 251,225 95.9 Jilin 98.7 382,524 349,567 91.4 130,856 122,509 93.6 Heilongjiang 99.9 637,656 577,515 90.6 115,797 110,763 95.7 Shanghai 100.0 897,991 865,132 96.3 185,417 185,417 100.0 Jiangsu 100.0 3,528,687 3,478,797 98.6 639,167 628,668 98.4 Zhejiang 99.9 2,986,684 2,950,844 98.8 1,455,320 1,391,286 95.6 Anhui 99.9 4,447,023 4,155,207 93.4 2,179,128 2,038,938 93.6 Fujian 100.0 1,562,159 1,499,684 96.0 430,223 417,319 97.0 Jiangxi 99.8 1,774,694 1,700,334 95.8 813,939 771,354 94.8 Shandong 100.0 3,919,999 3,738,325 95.4 1,757,863 1,757,863 100.0 Henan 100.0 6,790,723 6,493,789 95.6 2,174,028 2,078,188 95.6 Hubei 99.7 4,794,164 4,589,315 95.7 66,752 62,933 94.3 Hunan 100.0 1,045,019 995,186 95.2 483,531 420,817 87.0 Guangdong 100.0 5,742,000 5,397,965 94.0 858,000 802,230 93.5 Guangxi 100.0 3,588,731 3,294,704 91.8 2,311,663 2,311,663 100.0 Hainan 100.0 560,774 528,880 94.3 130,154 126,392 97.1 Chongqing 100.0 928,856 903,312 97.3 51,775 51,775 100.0 Sichuan 100.0 2,846,229 2,665,495 93.7 1,238,050 1,167,422 94.3 Guizhou 100.0 3,124,650 3,114,981 99.7 799,961 798,538 99.8 Yunnan 98.1 765,741 722,294 94.3 263,412 252,670 95.9 Tibet 100.0 1,049,504 641,587 61.1 89,130 89,130 100.0 Shaanxi 99.9 1,512,670 1,482,942 98.0 340,744 332,159 97.5 Gansu 100.0 18,793 18,793 100.0 111,965 111,965 100.0 Qinghai 100.0 56,579 53,220 94.1 14,057 13,890 98.8 Ningxia 100.0 390,378 382,662 98.0 82,498 82,498 100.0 Xinjiang 83.6 5,043,800 4,044,873 80.2 859,350 859,350 100.0 Production and Construction Corps 100.0 67,246 67,246 100.0 9,516 9,250 97.2 Total 98.6 69,245,168 65,003,023 93.9 21,125,450 20,330,801 96.2 Note: The COVID-19 epidemic period was calculated from the date of the first province in China launched the Level 1 Response to the date of the last province in China lowered the Level 1 Response (24 January 2020–2 May 2020).
Abbreviations: NIP=National Immunization Program; PLADs=province-level administrative divisions.
* The doses of the NIP vaccines for children who missed or delayed vaccine doses due to COVID-19, including children who have reached the vaccine starting age specified in the NIP vaccine immunization procedure on any day during the COVID-19 epidemic and those who have missed the NIP vaccine, were included in the doses of delayed NIP vaccinations due to the COVID-19 epidemic.
† The doses of the non-NIP vaccines for children who missed or delayed vaccine doses due to COVID-19, including children who have reached the starting age of the vaccine immunization program of the non-NIP vaccines, have been scheduled for vaccination on any day during the COVID-19 epidemic. The doses of delayed non-NIP vaccinations due to the COVID-19 epidemic will be counted.
§ Beijing Municipality provided routine vaccination services during COVID-19 epidemic, so no date was reported.Table 1. Vaccination clinics providing services at the end of October 2020 and delayed and caught up vaccinations of NIP and non-NIP vaccines based on reports from PLADs.
Table 2 shows results of the catch-up activities month-by-month and vaccine-by-vaccine for selected NIP vaccines. Using vaccine doses administered in December 2019 as a comparison, the table illustrates declines from baseline followed by catch-up vaccinations above baseline.
Vaccines 19-Dec* 20-Jan 20-Feb 20-Mar 20-Apr 20-May 20-Jun Doses Doses Ratio (%) Doses Ratio (%) Doses Ratio (%) Doses Ratio (%) Doses Ratio (%) Doses Ratio (%) HepB 61,799 47,484 76.8 25,931 42.0 71,183 115.2 64,802 104.9 55,201 89.3 −† − BCG 20,312 18,405 90.6 15,676 77.2 18,519 91.2 16,252 80.0 14,333 70.6 −§ − Polio¶ 73,633 51,338 69.7 12,283 16.7 75,659 102.8 92,596 125.8 87,722 119.1 87,125 118.3 DTaP** 85,204 55,422 65.1 12,194 14.3 79,239 93.0 103,876 121.9 102,910 120.8 94,691 111.1 DT 14,104 9,208 65.3 1,040 7.4 13,058 92.6 22,226 157.6 25,616 181.6 25,380 180.0 MCV†† 37,892 23,970 63.3 6,303 16.6 50,293 132.7 54,040 142.6 45,852 121.0 42,650 112.6 MPSV-A§§ 36,656 21,193 57.8 3,756 10.3 26,745 73.0 31,280 85.3 43,666 119.1 42,846 116.9 MPSV-AC¶¶ 27,485 18,800 68.4 1,914 7.0 24,462 89.0 41,057 149.4 40,179 146.2 41,912 152.5 JE*** 42,771 27,052 63.3 5,072 11.9 39,428 92.2 55,883 130.7 50,079 117.1 48,013 112.3 HepA††† 24,056 16,121 67.0 2,672 11.1 21,371 88.8 33,712 140.1 33,047 137.4 32,676 135.8 Total 423,912 288,993 68.2 86,841 20.5 419,957 99.1 515,724 121.7 498,605 117.6 415,293 121.5 Abbreviations: HepB=hepatitis B vaccine; BCG=Bacillus Calmette-Guérin vaccine; Polio=poliovirus vaccine; DTaP=diphtheria, tetanus toxoids and acellular pertussis vaccine; DT=diphtheria and tetanus toxoids vaccine; MCV=measles-containing vaccine; MPSV-A=group A meningococcal polysaccharide vaccine; MPSV-AC=group A and C meningococcal polysaccharide vaccine; JE=Japanese encephalitis vaccine; HepA=hepatitis A vaccine.
* The baseline was vaccine doses administered in December 2019.
† The HepB1 vaccine doses administered was not available in June 2020.
§ The BCG vaccine doses administered was not available in June 2020.
¶ Included children who might have been vaccinated with bivalent oral attenuated live poliovirus vaccine, trivalent inactivated poliovirus vaccine, diphtheria,tetanus toxoids,acellular pertussis (adsorbed),inactivated poliovirus and haemophilus type b conjugate vaccine.
** Included children who might have been vaccinated with diphtheria-tetanus toxoids-acellular pertussis combined vaccine (adsorbed), diphtheria, tetanus toxoids, acellular pertussis (adsorbed) and haemophilus type b combined vaccine, diphtheria, tetanus toxoids, acellular pertussis (adsorbed), inactivated poliovirus and haemophilus type b conjugate vaccine.
†† Included children who might have been vaccinated with live attenuated measles vaccine, live attenuated measles and rubella combined vaccine, live attenuated measles and mumps combined vaccine, live attenuated measles, rubella and mumps combined vaccine.
§§ Included children who might have been vaccinated with group A meningococcal polysaccharide vaccine, group A and C meningococcal conjugate vaccine, group A and C meningococcal and haemophilus type b conjugate vaccine.
¶¶ Included children who might have been vaccinated with group A and C meningococcal polysaccharide vaccine, and group ACYW135 meningococcal polysaccharide vaccine.
*** Included children who might have been vaccinated with live attenuated Japanese Encephalitis vaccine, and inactivated Japanese encephalitis vaccine.
††† Included children who might have been vaccinated with live attenuated hepatitis A vaccine, inactivated hepatitis A vaccine, inactivated hepatitis A and rDNA hepatitis B combined vaccine.Table 2. Comparison of vaccine doses administered monthly in sampled vaccination clinics from January 2020 to June 2020 with vaccine doses administered in December 2019 based on individual records from Immunization Information System (IIS).
-
During the early stages of the COVID-19 epidemic when there was local transmission of the coronavirus, about 80% of the vaccination clinics in China suspended services for all vaccines other than HepB1, BCG, rabies vaccine, and TAT. During the worst weeks of the pandemic in February 2020, most vaccinations decreased significantly while HepB1 and BCG vaccinations remained relatively stable and high. Following containment of COVID-19, vaccination services resumed in an orderly manner beginning in the second week of March.
During the 3 to 6 months of catch-up, 94.4% of the nearly 90 million vaccine doses that had been delayed were caught up. Because timely HepB1 and BCG vaccines were administered in birthing hospitals and birthing centers and rabies vaccine and TAT were administered in hospitals or special rabies clinics, it was possible to continue these time-critical vaccinations when immunization clinics were suspended.
International studies have shown that vaccinations in many countries and regions have also been impacted significantly by the COVID-19 pandemic, with vaccine supplies being hindered (9), vaccination services interrupted (10), and number of vaccine doses administered and coverage declining sharply (11-12). Disruption of vaccination services has potential to decrease coverage and set the stage for outbreaks of measles, polio, and other vaccine-preventable diseases. The COVID-19 pandemic threatens to set back progress that has been made in global vaccine initiatives, putting more than 80 million children worldwide at risk of vaccine-preventable diseases (VPDs) (13). Outbreaks of VPDs can lead to increased morbidity and mortality among young children and other vulnerable populations, placing an even greater burden on health systems already overburdened by COVID-19 (14). Under safe conditions, routine vaccination services should be provided continuously to maintain high levels of coverage and establish an effective immune barrier to VPDs (15).
This study has some implications for the immunization program. Because time-critical vaccinations are normally delivered by venues other than immunization clinics (e.g. birthing centers), it was possible to continue these vaccinations. For example, since the HepB1 is a medical emergency for babies born to hepatitis B carriers, it was essential to be able to continue HepB as post-exposure prophylaxis. Planning vaccination services based on the risk level of the epidemic allowed catch-up and routine immunization to move forward in areas with no local transmission of the coronavirus. China’s containment of COVID-19 allowed nationwide resumption of routine immunization within a few months of the start of the epidemic. The IIS played critically important roles in catch-up vaccination activities, such as identifying children in need of catch-up vaccinations, helping to make appointments for catch-up vaccinations, planning services to match clinic availability with need, and tracking the progress of catch-up vaccinations. The IIS fosters precision public health. For example, improving IIS data mining and analytic capacity will help identify hard-to-reach populations, such as children in remote areas and migrant populations and will serve the program well into the future.
This study was subject to some limitations. First, the IIS does not cover every vaccination clinic in China (7), and because the vaccine doses administered of catch-up vaccinations was based on IIS data, the results cannot be generalized to clinics without an IIS. Second, the COVID-19 epidemic occurred before the Chinese Spring Festival. Because vaccination services temporarily decline during Spring Festival every year, it was not possible to determine the depth of the decline in vaccinations caused by the epidemic versus the normal Spring Festival decline. However, this limitation does not impact coverage assessments and catch-up vaccination effectiveness.
The COVID-19 pandemic had a tremendous short-term impact on vaccination services in China. While preventing and controlling the epidemic, effective measures were taken to selectively suspend and then restore vaccination services and conduct catch-up vaccination activities. Approximately 94.4% of missed vaccinations were caught up, and vaccination clinics resumed routine vaccination services in an orderly manner.
Acknowledgements: Provincial, prefectural, and county-level CDC staff and township EPI clinicians.
Funding: This study was funded by grants from the Vaccine Preventable Diseases and Immunization (VDI) of World Health Organization Office in China (No. 2020/1017283-0).
Conflicts of interest: The authors who have taken part in this study declared that they did not have any other potential conflicts of interest.
HTML
| Citation: |

|