
 Download:


-
In recent years, mental and substance use disorders have captured the attention of policymakers in China. A national survey showed that approximately one in ten people were suffering from mental disorders in the past year (1). The Global Burden of Disease Study 2010 (GBD 2010) showed that mental, neurological, and substance use disorders accounted for 13% of disability-adjusted life years (DALYs) of non-communicable diseases in China (2). In GBD 2019 accompanied by changes in methodology, the disease burden for 1990, 2000, and 2019 was recalculated. In this report, we aimed to summarize the latest estimates of mental and substance use disorders of GBD 2019 in China and explore the trends from 1990 to 2019. In 2019, mental disorders and substance use disorders accounted for 20.29 million and 5.76 million DALYs in China. Depressive disorders were the leading cause, accounting for 29.03% of DALYs of mental and substance use disorders, followed by anxiety disorders and schizophrenia. The number of DALYs attributed to mental disorders increased by 12.06% between 2000 and 2019, which was mainly driven by population and aging, and the standardized rate of DALYs declined 5.24% in the period. Our findings showed the significant challenge that mental and substance use disorders still posed to health care systems in China. Actions should be taken to make these disorders a public health priority.
In GBD 2019, mental disorders included schizophrenia, depressive disorders, bipolar disorder, anxiety disorders, eating disorders, autism spectrum disorders, attention-deficit/hyperactivity disorder (ADHD), conduct disorder, idiopathic developmental intellectual disability, and other mental disorders. Substance use disorders included alcohol use disorders and drug use disorders.
Mortality was derived from vital registration, surveillance, and other sources, including data from the Chinese National Disease Surveillance Points System and the China CDC Cause of Death Reporting System. Considering insufficient available data, mortality was only estimated for eating disorders, alcohol use disorders, and drug use disorders.
Systematic reviews of community representative epidemiological studies were conducted to extract the estimates of indications of disease burden, including prevalence, incidence, remission, and duration. DisMod-MR, a Bayesian meta-regression instrument, was used to compute the sex-specific and age-specific estimates from the available data.
Years of life lost (YLLs) were the product of mortality estimates and the standard life expectancy. Years lived with disability (YLDs) were the product of prevalence and disability weight. DALYs were calculated by adding YLLs and YLDs.
Data on disease burden indicators were obtained, and their standardized rates were adjusted based on China’s 2010 National Census. Percent change was calculated as the difference in quantities between 2019 and 2000 divided by the quantity in 2000. Because the indicators related to death of most mental and substance use disorders were not estimated, the mortality and YLLs were not listed in the current report. SAS 9.4 (SAS Institute Inc., Cary, NC, USA) was used to perform all the analyses.
In China, mental disorders and substance use disorders accounted for 20.29 million and 5.76 million DALYs, or 5.31% and 1.51% of total burden in 2019, respectively (Table 1). Considering the number of YLDs, mental disorders and substance use disorders accounted for 13.19% and 2.95% of all YLDs in China, respectively. Among the total DALYs attributable to mental disorders, 10.91 million DALYs (53.76%) was in females. In the case of substance use disorders, only 1.57 million DALYs (27.29%) were in females. As expected, the number of DALYs attributable to mental disorders increased in the 3 decades, rising by 12.06% between 2000 and 2019. However, the number of DALYs attributed to substance use disorders fluctuated in recent years decreasing by 8.52%. The standardized rates of DALYs of mental disorders and substance use disorders decreased by 5.24% and 18.52%, respectively (Table 1).
Disease Gender Year Incidence Prevalence YLDs DALYs N P’ N P’ N P’ N P’ Mental disorders Male 1990 17,202,840 2,970.34 67,652,491 11,446.77 7,273,363 1,317.04 7,273,427 1,317.05 2000 19,931,663 3,064.56 77,058,444 11,458.69 8,488,240 1,323.53 8,488,287 1,323.54 2019 21,301,694 2,863.96 78,905,611 10,926.44 9,382,016 1,275.38 9,382,921 1,275.52 2019 vs. 2000*(%) 6.87 −6.55 2.40 −4.64 10.53 −3.64 10.54 −3.63 Female 1990 25,699,004 4,897.47 64,975,588 12,391.56 8,364,066 1,638.24 8,364,774 1,638.36 2000 26,844,223 4,487.62 75,693,881 12,437.26 9,620,483 1,612.06 9,621,742 1,612.25 2019 31,423,301 4,221.31 81,257,083 11,297.32 10,909,569 1,502.04 10,910,906 1,502.27 2019 vs. 2000*(%) 17.06 −5.93 7.35 −9.17 13.40 −6.82 13.40 −6.82 Both 1990 42,901,844 3,908.01 132,628,079 11,913.81 15,637,430 1,473.49 15,638,201 1,473.55 2000 46,775,886 3,763.25 152,752,326 11,951.35 18,108,723 1,465.29 18,110,029 1,465.38 2019 52,724,995 3,541.04 160,162,694 11,141.86 20,291,586 1,388.44 20,293,827 1,388.63 2019 vs. 2000*(%) 12.72 −5.90 4.85 −6.77 12.05 −5.24 12.06 −5.24 Substance use disorders Male 1990 8,129,143 1,479.60 17,723,860 3,247.16 2,586,887 460.62 3,639,417 667.18 2000 8,993,793 1,401.98 19,580,679 3,083.95 2,839,423 440.24 4,454,353 701.94 2019 10,006,860 1,417.60 22,632,420 3,168.36 3,120,261 439.82 4,184,659 586.44 2019 vs. 2000*(%) 11.26 1.11 15.59 2.74 9.89 −0.10 −6.05 −16.45 Female 1990 2,456,217 464.82 5,916,017 1,082.33 1,210,470 217.95 1,873,445 345.66 2000 3,109,561 502.29 6,869,216 1,103.42 1,275,070 203.93 1,837,561 293.89 2019 3,072,714 457.06 7,347,936 1,081.51 1,416,512 206.30 1,571,000 228.24 2019 vs. 2000*(%) −1.18 −9.01 6.97 −1.99 11.09 1.16 −14.51 −22.34 Both 1990 10,585,360 991.07 23,639,877 2,204.45 3,797,357 343.90 5,512,862 512.71 2000 12,103,354 964.63 26,449,895 2,120.34 4,114,493 325.35 6,291,914 503.51 2019 13,079,574 945.99 29,980,356 2,141.67 4,536,773 325.07 5,755,658 410.24 2019 vs. 2000*(%) 8.07 −1.93 13.35 1.01 10.26 −0.09 −8.52 −18.52 Note: N: Number of cases for incidence and prevalence; number of person years for years lived with disability (YLDs) and disability-adjusted life years (DALYs).
P’: Standardized rate calculated using the 2010 National Census as the standard population, expressed as 1/100,000.
* Percent change was calculated as difference value between 2019 and 2000 divided by quantity in 2000.Table 1. Overall incidence, prevalence, and burden indicators of mental and substance use disorders — China, 1990−2019.
Table 2 presented the numbers and standardized rates of the disease burden of 4 important groups of disorders from 1990 to 2019. Percent change in the numbers of DALYs attributable to schizophrenia, depressive disorders, and alcohol use disorders increased, while the percent change of standardized rates of depressive disorders declined.
Disease Year Incidence Prevalence DALYs N P’ N P’ N P’ Depressive disorders 1990 31,303,436 3,058.19 34,143,548 3,553.28 5,486,751 553.93 2000 33,867,949 2,883.82 39,716,857 3,467.03 6,176,680 532.88 2019 41,005,280 2,667.68 50,056,236 3,233.18 7,561,985 491.61 2019 vs. 2000*(%) 21.07 −7.49 26.0 −6.74 22.43 −7.74 Anxiety disorders 1990 6,667,495 557.36 41,687,414 3,747.77 4,045,138 359.37 2000 7,732,908 568.00 48,860,682 3,832.95 4,736,062 368.63 2019 7,285,634 516.55 47,842,153 3,345.40 4,574,328 322.37 2019 vs. 2000*(%) −5.78 −9.06 −2.08 −12.72 −3.41 −12.55 Schizophrenia 1990 253,270 20.69 3,551,298 366.15 2,319,765 237.48 2000 268,487 20.67 4,387,832 366.77 2,872,739 239.07 2019 258,038 20.66 5,498,737 377.36 3,569,946 246.31 2019 vs. 2000*(%) −3.89 −0.07 25.32 2.89 24.27 3.03 Alcohol use disorders 1990 7,573,050 722.29 15,091,555 1,486.95 1,934,370 194.61 2000 8,789,123 701.62 17,719,725 1,447.20 2,325,521 192.68 2019 9,856,282 700.27 20,796,992 1,446.71 2,833,114 196.66 2019 vs. 2000*(%) 12.14 −0.19 17.37 −0.03 21.83 2.07 Note: N: Number of cases for incidence and prevalence; number of person years for disability-adjusted life (DALYs).
P’: Standardized rate calculated using the 2010 National Census as the standard population, expressed as 1/100,000.
* Percent change was calculated as difference value between 2019 and 2000 divided by quantity in 2000.Table 2. Incidence, prevalence, and DALYs of four disorders — China, 1990−2019.
In 2019, depressive disorders were the leading cause of mental and substance use disorders in both sexes. These mental disorders accounted for 20.93% of all mental and substance use disorder DALYs in males and 37.84% in females. In males, alcohol use disorders and schizophrenia followed depressive disorders. In females, anxiety disorders and schizophrenia ranked second and third (Figure 1). The burden due to substance use disorders, especially for alcohol use disorders, was substantially higher in men compared with women.
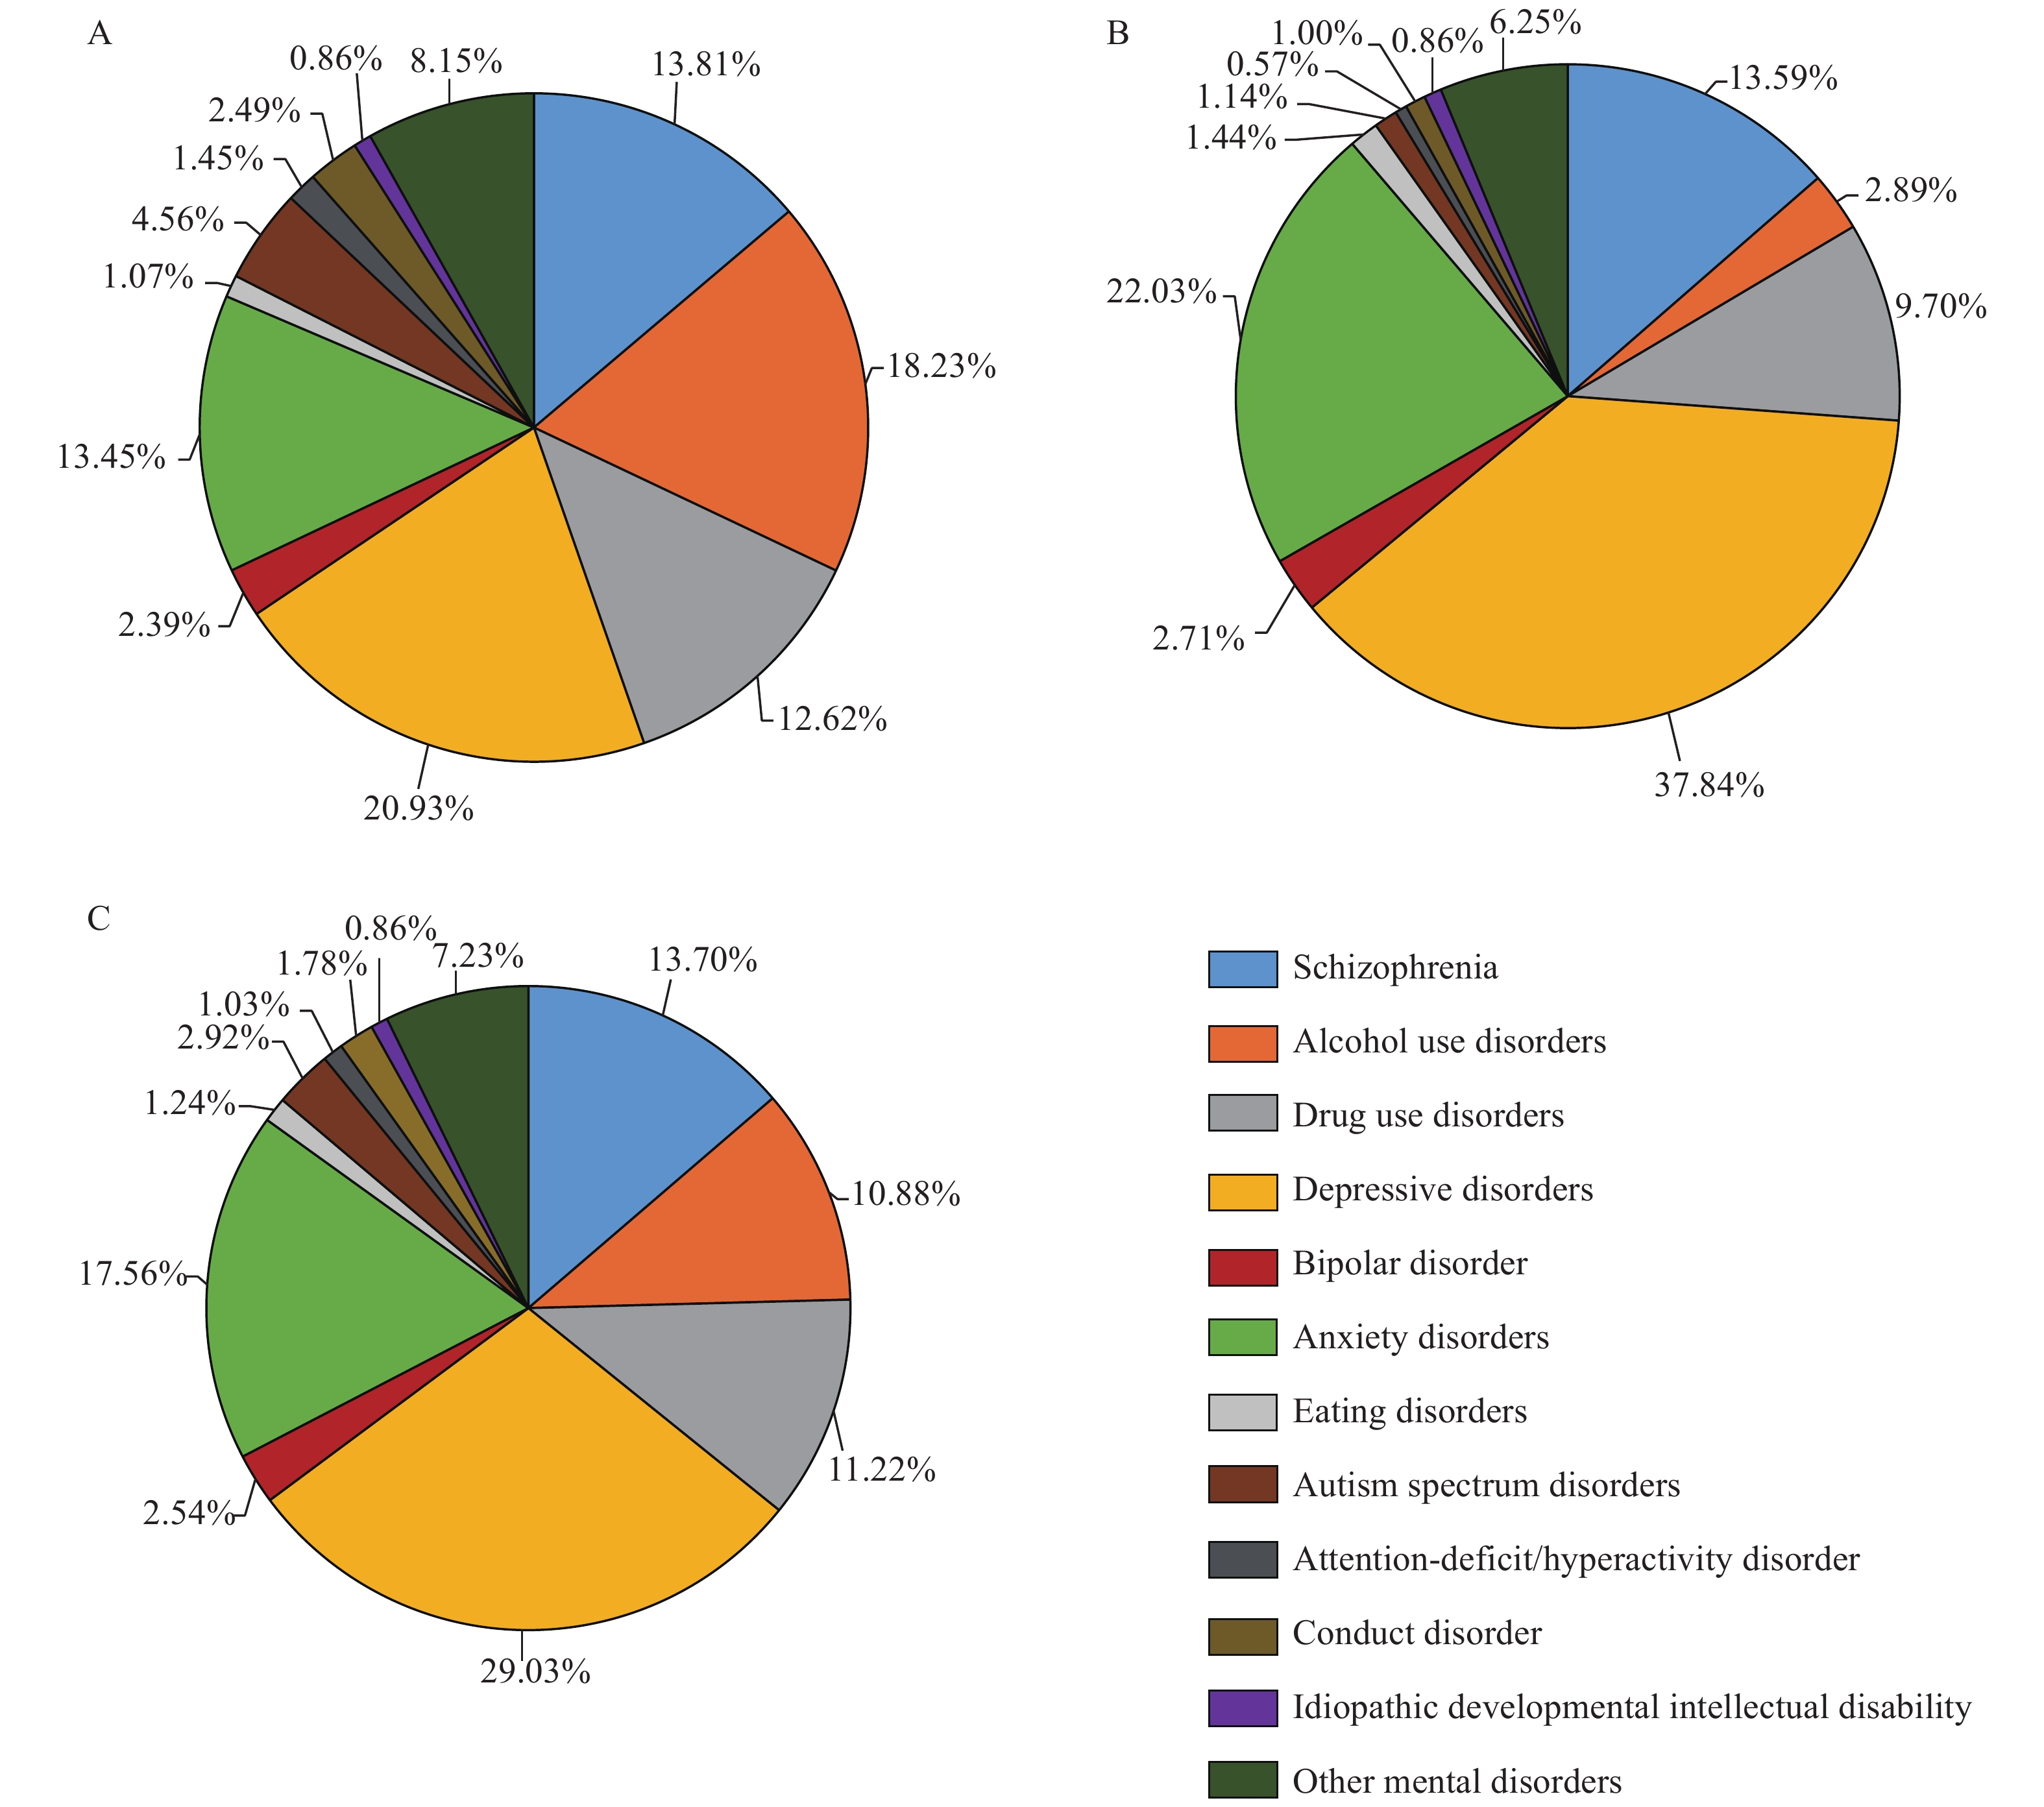 Figure 1.
Contribution of disorders to the overall number of disability-adjusted life years (DALYs) due to mental and substance use disorders by sex, 2019. (A) male; (B) female; (C) both.
Figure 2 illustrated the differences in the number of DALYs for females and males for 2000 and 2019 by age group for some mental and substance use disorders. For both males and females, two of the leading causes of DALYs between both time periods included depressive disorders and schizophrenia. Depressive disorders and anxiety disorders predominantly occurred in females at all ages, becoming notably evident from age 10–14 years old and continuing throughout all subsequent age groups. The highest number of DALYs of depressive disorders in a specific age group occurred between age 25–44 years old in 2000, which was delayed to age 45–59 years old in 2019. Drug use disorders and alcohol use disorders predominantly occurred in males at all ages. Drug use disorder climbed to a peak of 500,000 between 25–30 years old in 2000, which was far more than alcohol use disorders. However, the peak only reached 300,000 in 2019, which was similar to alcohol use disorders.
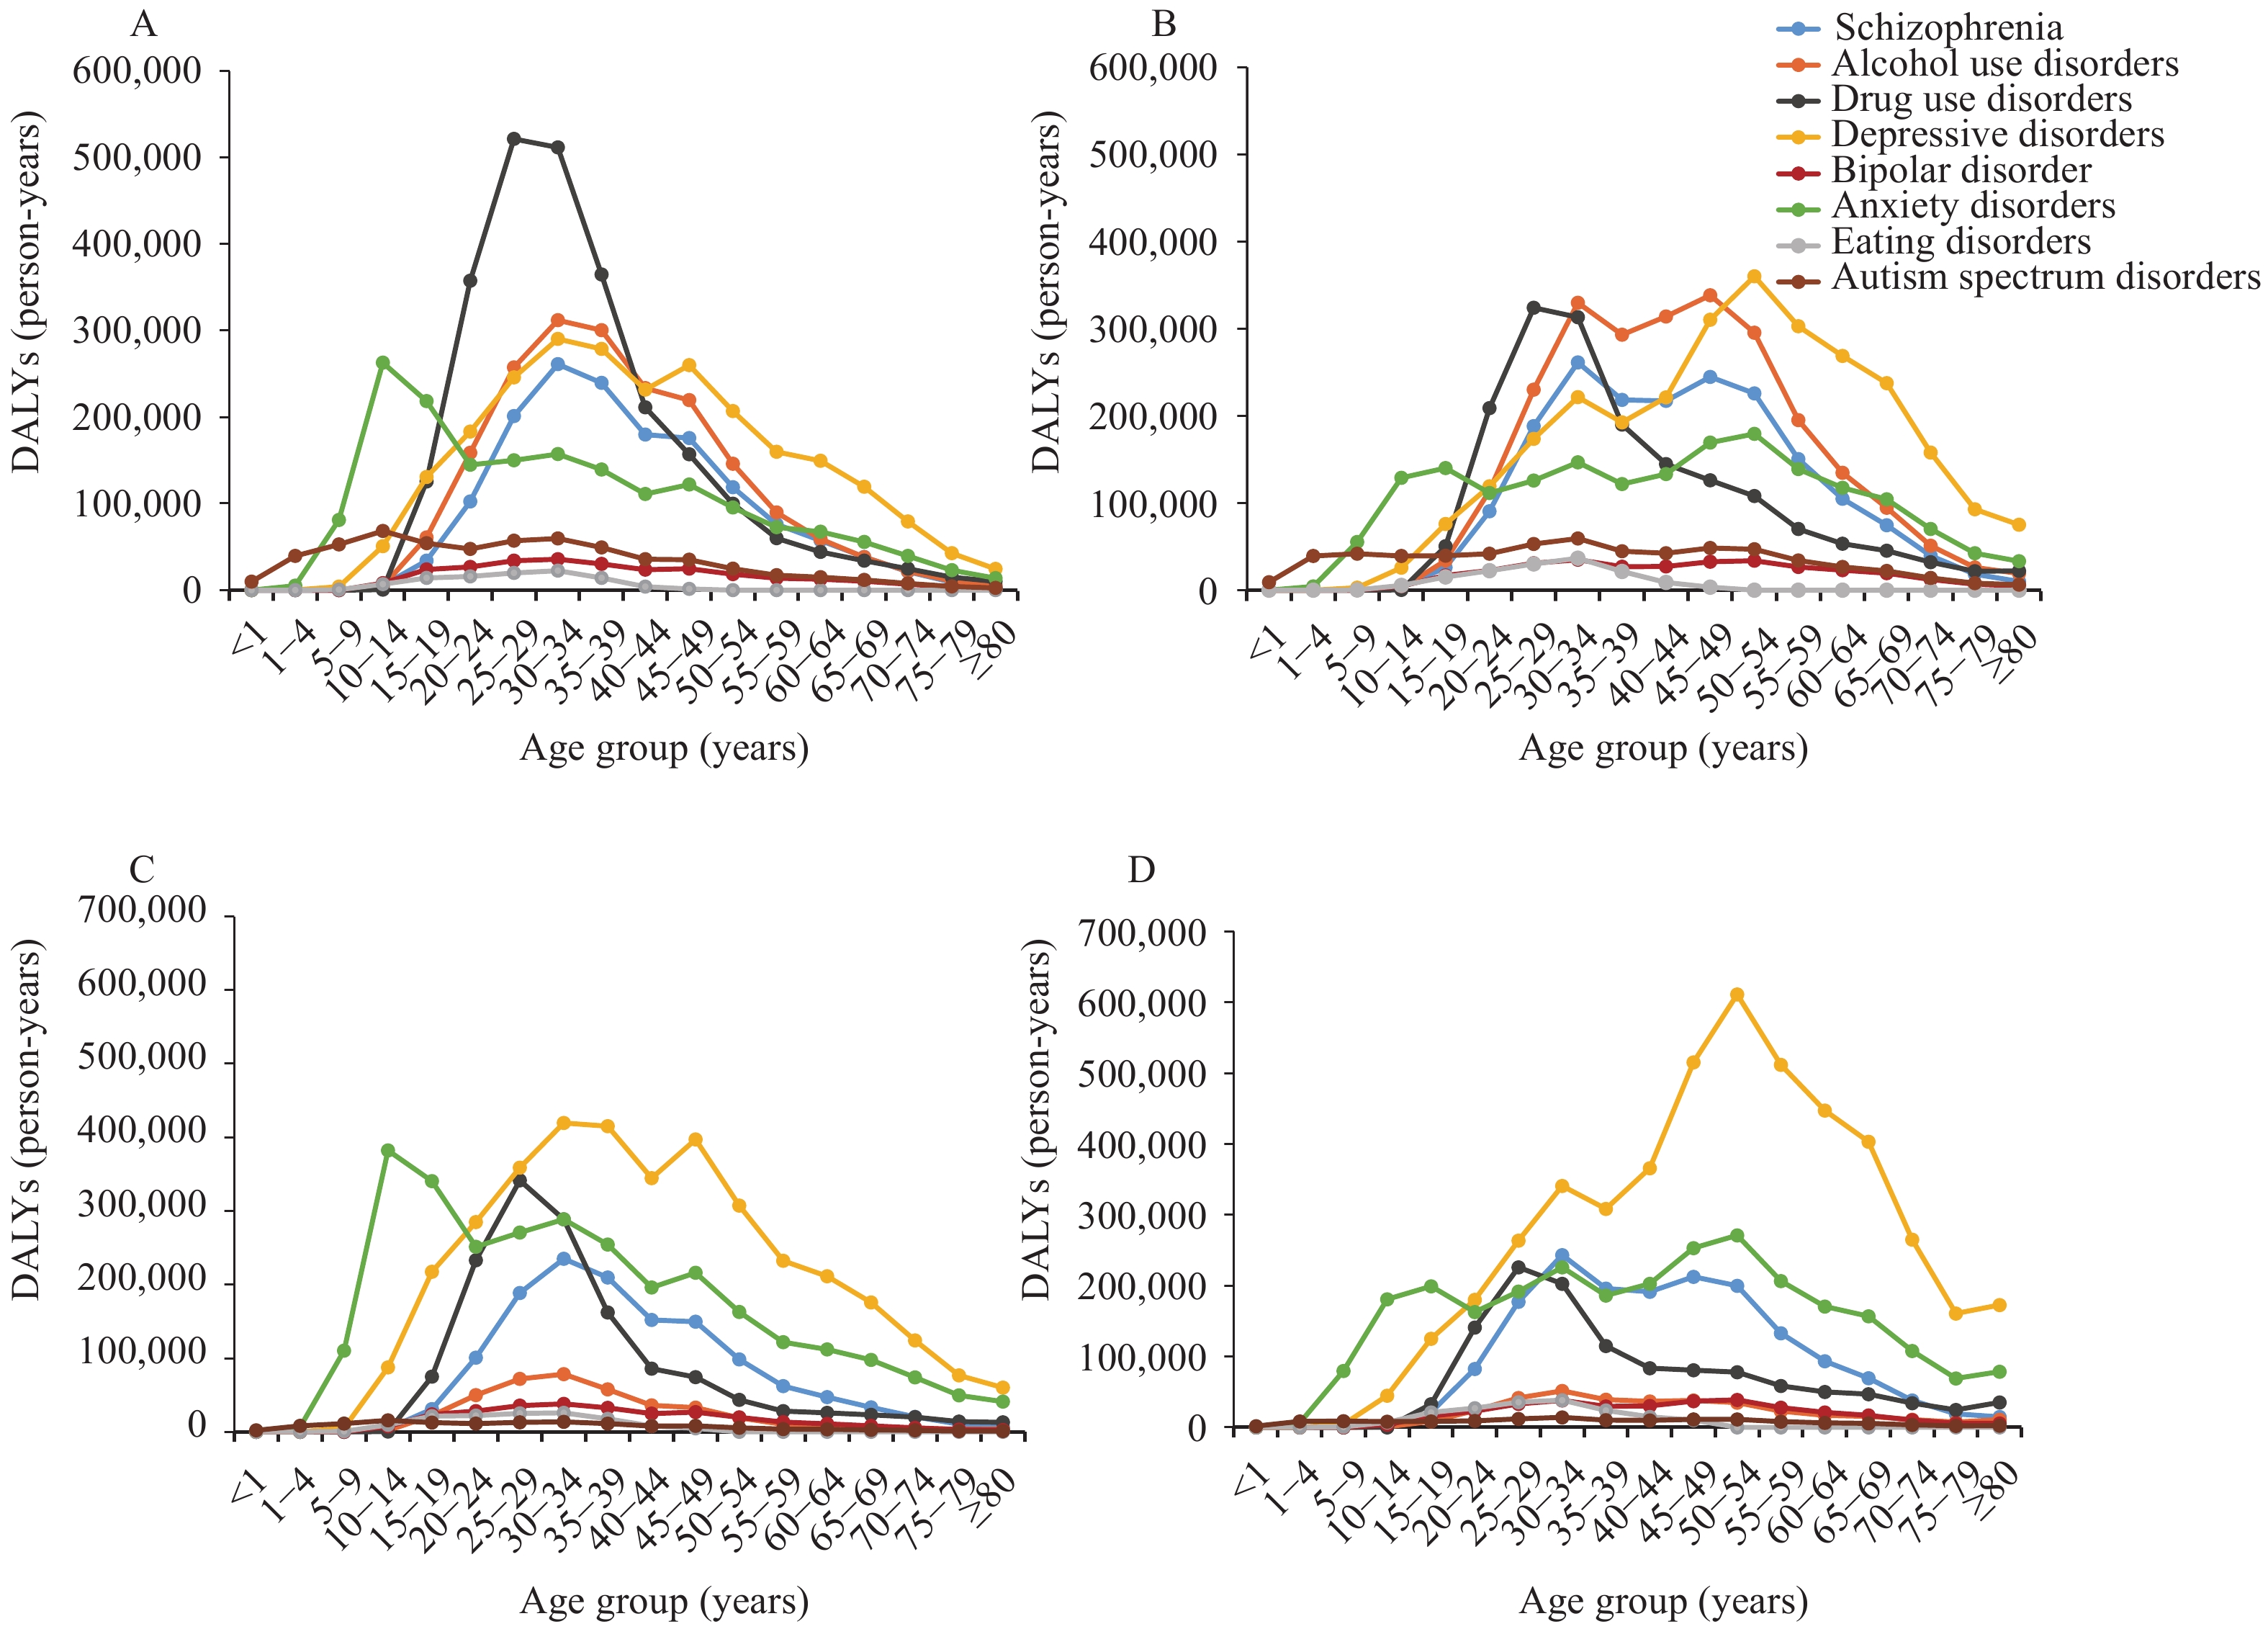 Figure 2.
Numbers of disability-adjusted life years (DALYs) for some mental and substance use disorders in 2000 and 2019 by age and sex. (A) in 2000 by age in male; (B) in 2019 by age in male; (C) in 2000 by age in female; (D) in 2019 by age in female.
-
Between 1990 and 2019, the profile of the disease burden of China changed rapidly. The number of the disease burden of mental disorders in 2019 increased but the standardized rates declined. Overall, mental and substance use disorders were notable contributors to the disease burden in China, directly accounting for nearly 7%. These disorders were responsible for more DALYs than neurological disorders, HIV/AIDS, chronic respiratory diseases, and diabetes and kidney diseases in GBD 2017 (3).
Although the numbers of DALYs due to mental disorders increased from 1990 to 2019, the change was largely attributed to population growth and aging considering the decreasing standardized rates. Population growth and aging played an important role in the dynamic changes of disease burden. The increases in life expectancy and population will lead to more people living with mental disorders for a longer time.
Compared with severe mental disorders, including schizophrenia and bipolar disorder, common mental disorders (e.g. depressive disorders and anxiety disorders) accounted for a greater proportion of mental and substance use disorders. Depressive disorders featured prominently in DALY ranking in both sexes because of its high prevalence. Previous studies suggested that depressive disorders were the most prevalent mental disorders (1,4). Severe mental disorders were highly debilitating but did not rank highly in terms of DALYs because of relatively lower prevalence.
The current results showed that challenges were still posed to healthcare systems in China. An economic burden study showed that the total annual costs of mental disorders increased more than 3 times from 2005 to 2013 in China. The total costs of mental disorders in 2013 accounted for more than 15% of the total health expenditure in China, equivalent to 1.1% of the gross domestic product (GDP) (5). In spite of such a heavy burden to individuals and the society, the majority of individuals with mental disorders rarely seek treatment. Unmet needs for mental health treatment were common globally and especially concerning in still-developing countries including China. Even among persons seeking treatment, delays in initial treatment contact still existed (6). The main reasons for this included the lack of recognition of diseases, stigma, and the scarcity of available resources. The adoption of China’s first mental health law in 2013 was a milestone development as the Chinese Government committed to strengthening public health and primary healthcare including increasing investment and training qualified professionals (7). Mental health professionals could reduce the prevalence by reducing remission and develop public education programs to boost mental health literacy and combat stigma.
This study was subject to several limitations. First, epidemiological data of many disorders were not available. Most of the existing studies concentrated on common mental disorders and were limited in terms of scope. In GBD 2019, if no data or insufficient data were available for the country, estimates would be generated from surrounding countries using DisMod-MR, which might not accurately present the disease burden of the country. However, with more attention paid to mental and substance use disorders, a nationally epidemiological survey in China, the China Mental Health Survey, was conducted, which might contribute to more precise data of prevalence and disease burden (1). Second, mental disorders were rarely listed as the cause of death in GBD. When several factors, including mental disorders, contributed to a death, the death was always coded to the direct disease but not mental disorders, which could underestimate the disease burden of mental disorders. Third, the current report only presented the disease burden at the national level. Data at the provincial level and municipal level can offer more valuable information and help inform local policies in China.
Acknowledgment: We would like to thank the team of the GBD 2019.
Conflicts of interest: No conflicts of interest were reported.
Funding: The study was supported by the National Key Research and Development Program “Applied Study on the Data-driven Prevention and Control Strategies of the Major Chronic Disease” (2018YFC1315305).
HTML
| Citation: |

|