
 Download:


-
Introduction Notifiable infectious disease surveillance is important for understanding the trends in morbidity for certain diseases, especially detection of acute infectious disease outbreaks and changing epidemiology. A web-based reporting system was deployed in January 2004, which has improved data collection and speed tremendously. This report provides an updated analysis for reports published in 2013 and 2015.
Methods Data from the National Notifiable Disease Reporting System (NNDRS) was used. The NNRDS shows data from 39 notifiable diseases split into three categories (A, B, and C) based on severity and importance. A descriptive analysis was conducted to analyze the morbidity of notifiable diseases in China.
Results In 2018, the morbidity of national notifiable diseases was 559.41 per 100,000 population, an increase of 12.88% compared with the average of 2015–2017. The proportion of laboratory confirmed cases was 36.22%, which decreased 4.03% compared with the average of that in the recent three years. Diseases transmitted by direct contact/fecal–oral transmission accounted for the largest proportion, 49.37% of the total reported cases, followed by the respiratory transmitted diseases, blood-borne/sexually transmitted diseases, and the zoonotic and vector-borne diseases with a proportion of 25.18%, 24.60%, and 0.85%, respectively. Pathogenic descriptive analysis showed that the viral-infected cases accounted for 73.78% of the totals, followed by the bacterial-infected and parasitic diseases.
Conclusion The national morbidity of notifiable infectious diseases showed increases in 2018, mostly due to higher morbidity of category C diseases, such as HFMD, infectious diarrhea, and influenza, and these diseases need to be further prioritized in disease control and prevention efforts. Laboratory confirmed cases remain low and need to be improved to improve data quality.
-
The National Notifiable Disease Reporting System (NNDRS) in China was established in the 1950s, and since 2004, compulsory guidelines mandate that medical and health institutions at all levels must report infectious diseases to the NNDRS in real time (3). The NNDRS is the most important infectious disease surveillance system in China and has played an important role in infectious disease prevention and control. Timely analysis of outbreak surveillance data and understanding the relevant trends and characteristics are the foundation for the prevention and control of infectious diseases (4). Therefore, a descriptive analysis of notifiable diseases in 2018 based on data from NNDRS is invaluable to Chinese public health efforts.
-
Data on clinical and laboratory diagnoses between January 1 and December 31 in 2018 were collected from NNDRS. Data from certain regions of China (Taiwan, Hong Kong, and Macau) and cases of foreign travelers are not included in the analysis. A total of 39 notifiable diseases (shown in Supplementary Table S1) are required to be reported under the regulations and management of the Law of the People’s Republic of China on the Prevention and Treatment of Infectious Diseases (5), These diseases are divided into three categories: Class A, B, and C. Descriptive analysis was conducted by Microsoft Excel 2010, and ArcGIS 10.2 was used for geo-analysis.
-
Overall, 7,770,749 notifiable diseases cases were reported through the NNDRS, and the morbidity of notifiable diseases was 559.41 cases per 100,000 population, with an increase of 12.88% compared with the average of the recent three years. There were no cases of plague, severe acute respiratory syndrome associated coronavirus disease (SARS), poliomyelitis, avian influenza (H5N1), diphtheria, and filariasis reported in China in 2018. The morbidity of Class A and B notifiable diseases was 220.51 cases per 100,000 population, which was relatively stable in the recent years with only 0.03% higher than that of the recent three years. However, the morbidity of Class C was 338.90 cases per 100,000 population, with a remarkable increase of 23.18% compared with the recent three-year average. The top five notifiable diseases with the highest reported morbidity were HFMD, infectious diarrhea, hepatitis B, tuberculosis, and influenza, accounting for 80.10% of the total morbidity and HFMD alone accounting for 30.28%. Compared to the average of 2015-2017, the diseases with the highest increase in reported morbidity were pertussis, influenza, and Japanese encephalitis, while the diseases with the highest decline in morbidity were human infection with H7N9, schistosomiasis, and measles (Table 1).
Disease 2018 The Average of 2015-2017 Compared with the Average of 2015-2017 Cases Morbidity
(1/100,000)Laboratory Confirmed Proportion (%) Cases Morbidity
(1/100,000)Laboratory Confirmed Proportion (%) Percent Change in Morbidity
(%)Percent Change in Laboratory Confirmation (%) Classifications Class A, B, and C 7,770,749 559.4101 36.22 6,794,496 495.5761 37.74 12.88 −4.03 Class A and B 3,063,049 220.5065 71.28 3,022,320 220.4416 68.34 0.03 4.30 Class C 4,707,700 338.9036 13.41 3,772,176 275.1345 13.23 23.18 1.36 Transmission routes Direct Contact/Fecal-oral Transmitted Diseases 3,836,152 276.1616 12.55 3,398,466 247.8769 13.16 11.41 −4.64 Respiratory Transmitted Diseases 1,956,719 140.8627 25.58 1,472,774 107.4210 18.34 31.13 39.48 Zoonotic/Vector-Borne Diseases 65,865 4.7415 81.07 86,082 6.2786 71.41 −24.48 13.53 Blood-Borne/Sexually Trans- mitted Diseases 1,911,909 137.6368 93.04 1,790,671 130.6077 92.65 5.38 0.42 Pathogen Viruses 4,787,198 344.6264 32.15 4,021,239 293.3007 35.16 17.50 −8.56 Bacteria 1,693,219 121.8928 57.26 1,671,194 121.8933 52.95 0 8.14 Parasitic 8,062 0.5789 54.17 13,057 0.9523 25.70 −39.21 110.78 Single notifiable infectious disease Plague 0 0 − 1 0 100.00 −100.00 − Cholera 28 0.0020 100.00 18 0.0013 100.00 53.85 0 SARS-CoV 0 0 − 0 0 − − − Acquired Immune Deficiency Syndrome (AIDS) 64,170 4.6195 99.86 53,961 3.9358 99.64 17.37 0.22 Viral Hepatitis 1,280,015 92.1473 88.14 1,241,316 90.5390 87.55 1.78 0.67 Hepatitis A 16,196 1.1659 79.81 20,942 1.5275 83.52 −23.67 −4.44 Hepatitis B 999,985 71.9881 96.13 959,478 69.9823 94.48 2.87 1.75 Hepatitis C 219,375 15.7926 57.06 209,584 15.2866 62.56 3.31 −8.79 Hepatitis D 356 0.0256 81.18 262 0.0191 77.48 34.03 4.78 Hepatitis E 28,603 2.0591 86.55 28,035 2.0448 89.20 0.70 −2.97 Hepatitis, Unspecified 15,500 1.1158 24.28 23,014 1.6786 28.04 −33.53 −13.41 Poliomyelitis 0 0 − 0 0 − − − Human Infection with H5N1 Virus 0 0 − 2 0.0001 100.00 −100.00 − Measles 3,940 0.2836 97.08 24,374 1.7778 95.28 −84.05 1.89 Epidemic Hemorrhagic Fever 11,966 0.8614 77.90 10,143 0.7398 80.24 16.44 −2.92 Rabies 422 0.0304 11.61 654 0.0477 7.04 −36.27 64.91 Japanese Encephalitis 1,800 0.1296 92.83 1,003 0.0731 89.73 77.29 3.45 Dengue 5,136 0.3697 76.67 3,934 0.2869 93.42 28.86 −17.93 Anthrax 336 0.0242 16.37 327 0.0238 15.92 1.68 2.83 Dysentery 91,152 6.5620 12.52 123,856 9.0338 15.34 −27.36 −18.38 Tuberculosis 823,342 59.2717 34.01 845,148 61.6433 28.89 −3.85 17.72 Typhoid & Paratyphoid Fever 10,843 0.7806 40.63 11,109 0.8103 45.28 −3.67 −10.27 Meningococcal Meningitis 104 0.0075 68.27 108 0.0079 53.54 −5.06 27.51 Pertussis 22,057 1.5879 35.18 7,544 0.5502 30.02 188.60 17.19 Diphtheria 0 0 − 0 0 − − − Neonatal Tetanus* 83 0.0052 1.20 192 0.0140 1.04 −62.86 15.38 Scarlet Fever 78,864 5.6774 4.22 67,300 4.9087 4.47 15.66 −5.59 Brucellosis 37,947 2.7318 91.32 47,561 3.4690 92.11 −21.25 −0.86 Gonorrhea 133,156 9.5858 100.00 118,041 8.6097 100.00 11.34 0 Syphilis 494,867 35.6251 100.00 449,344 32.7742 100.00 8.70 0 Leptospirosis 157 0.0113 47.77 303 0.0221 62.64 −48.87 −23.74 Schistosomiasis 144 0.0104 10.42 12,751 0.9300 3.69 −98.88 182.38 Malaria 2,518 0.1813 99.56 2,981 0.2174 99.24 −16.61 0.32 Human Infection with H7N9 Virus 2 0.0001 100.00 350 0.0255 100.00 −99.61 0 Influenza 765,186 55.0851 25.90 319,708 23.3188 36.43 136.23 −28.90 Mumps 259,071 18.6503 1.50 203,525 14.8447 1.18 25.64 27.12 Rubella 3,930 0.2829 88.52 4,758 0.3470 79.36 −18.47 11.54 Acute Hemorrhagic Conjunctivitis 38,250 2.7536 0.73 34,494 2.5159 0.61 9.45 19.67 Leprosy 225 0.0162 80.89 310 0.0226 77.72 −28.32 4.08 Typhus 971 0.0699 16.68 1,183 0.0863 34.73 −19.00 −51.97 Visceral Leishmaniasis 160 0.0115 65.00 331 0.0242 43.06 −52.48 50.95 Echinococcosis 4,327 0.3115 26.21 4,560 0.3326 27.13 −6.34 −3.39 Filariasis 0 0 − 0 0 − − − Infectious Diarrhea† 1,282,270 92.3096 23.53 1,080,288 78.7939 24.05 17.15 −2.16 Hand, Foot, and Mouth Disease 2,353,310 169.4129 5.19 2,123,020 154.8486 5.38 9.41 −3.53 * The unit of the morbidity of neonatal tetanus is 1/1,000.
† Infectious diarrhea excludes cholera, dysentery, typhoid fever, and paratyphoid fever.
− Denotes the number cannot be counted.Table 1. The morbidity of notifiable diseases and the proportion of laboratory confirmation proportion in China, 2018 and 2015-2017
In 2018, 73.78% of all national notifiable disease cases were attributable to viral diseases. The morbidity of viral infectious diseases was 344.63 cases per 100,000 population with an increase of 17.50% compared with the average of 2015–2017. Bacterial pathogens were responsible for 26.10% of all national notifiable disease cases. The morbidity of bacterial diseases was 121.89 cases per 100,000 population, which was nearly same as that of the recent three years. Parasitosis represented 0.12% of the total cases, and the corresponding morbidity was 0.58 cases per 100,000 population, which was a decrease of 39.21% compared with average of 2015–2017. The reported morbidity of schistosomiasis and visceral leishmaniasis has significantly decreased.
The morbidity analysis by the main route of transmission and the reservoir of the organism showed that diseases transmitted by direct contact/fecal–oral transmission are the largest proportion 49.37% of the total cases, and the related morbidity was 276.16 cases per 100,000 population, which was an increase of 11.41% compared with the average of 2015–2017. The major contributors were HFMD and infectious diarrhea.
Respiratory transmitted diseases contributed 25.18% of total cases, and the morbidity of respiratory transmitted diseases was 140.86 cases per 100,000 population, which was an increase of 31.13% compared with 3-year average. The largest contributors in this category were tuberculosis and influenza.
Blood-borne/sexually transmitted diseases accounted for 24.60% of the totals, and the morbidity was 137.64 cases per 100,000 population, which was an increase of 5.38% compared with the 3-year average. Hepatitis B and syphilis were the major contributors.
The smallest contributor for total cases was zoonotic and vector-borne diseases, which accounted for 0.85%, and the morbidity was 4.74 cases per 100,000 population, which was a decrease of 24.48% compared with the 3-year average. These diseases include brucellosis and epidemic hemorrhagic fever (Table 1, Figure 1).
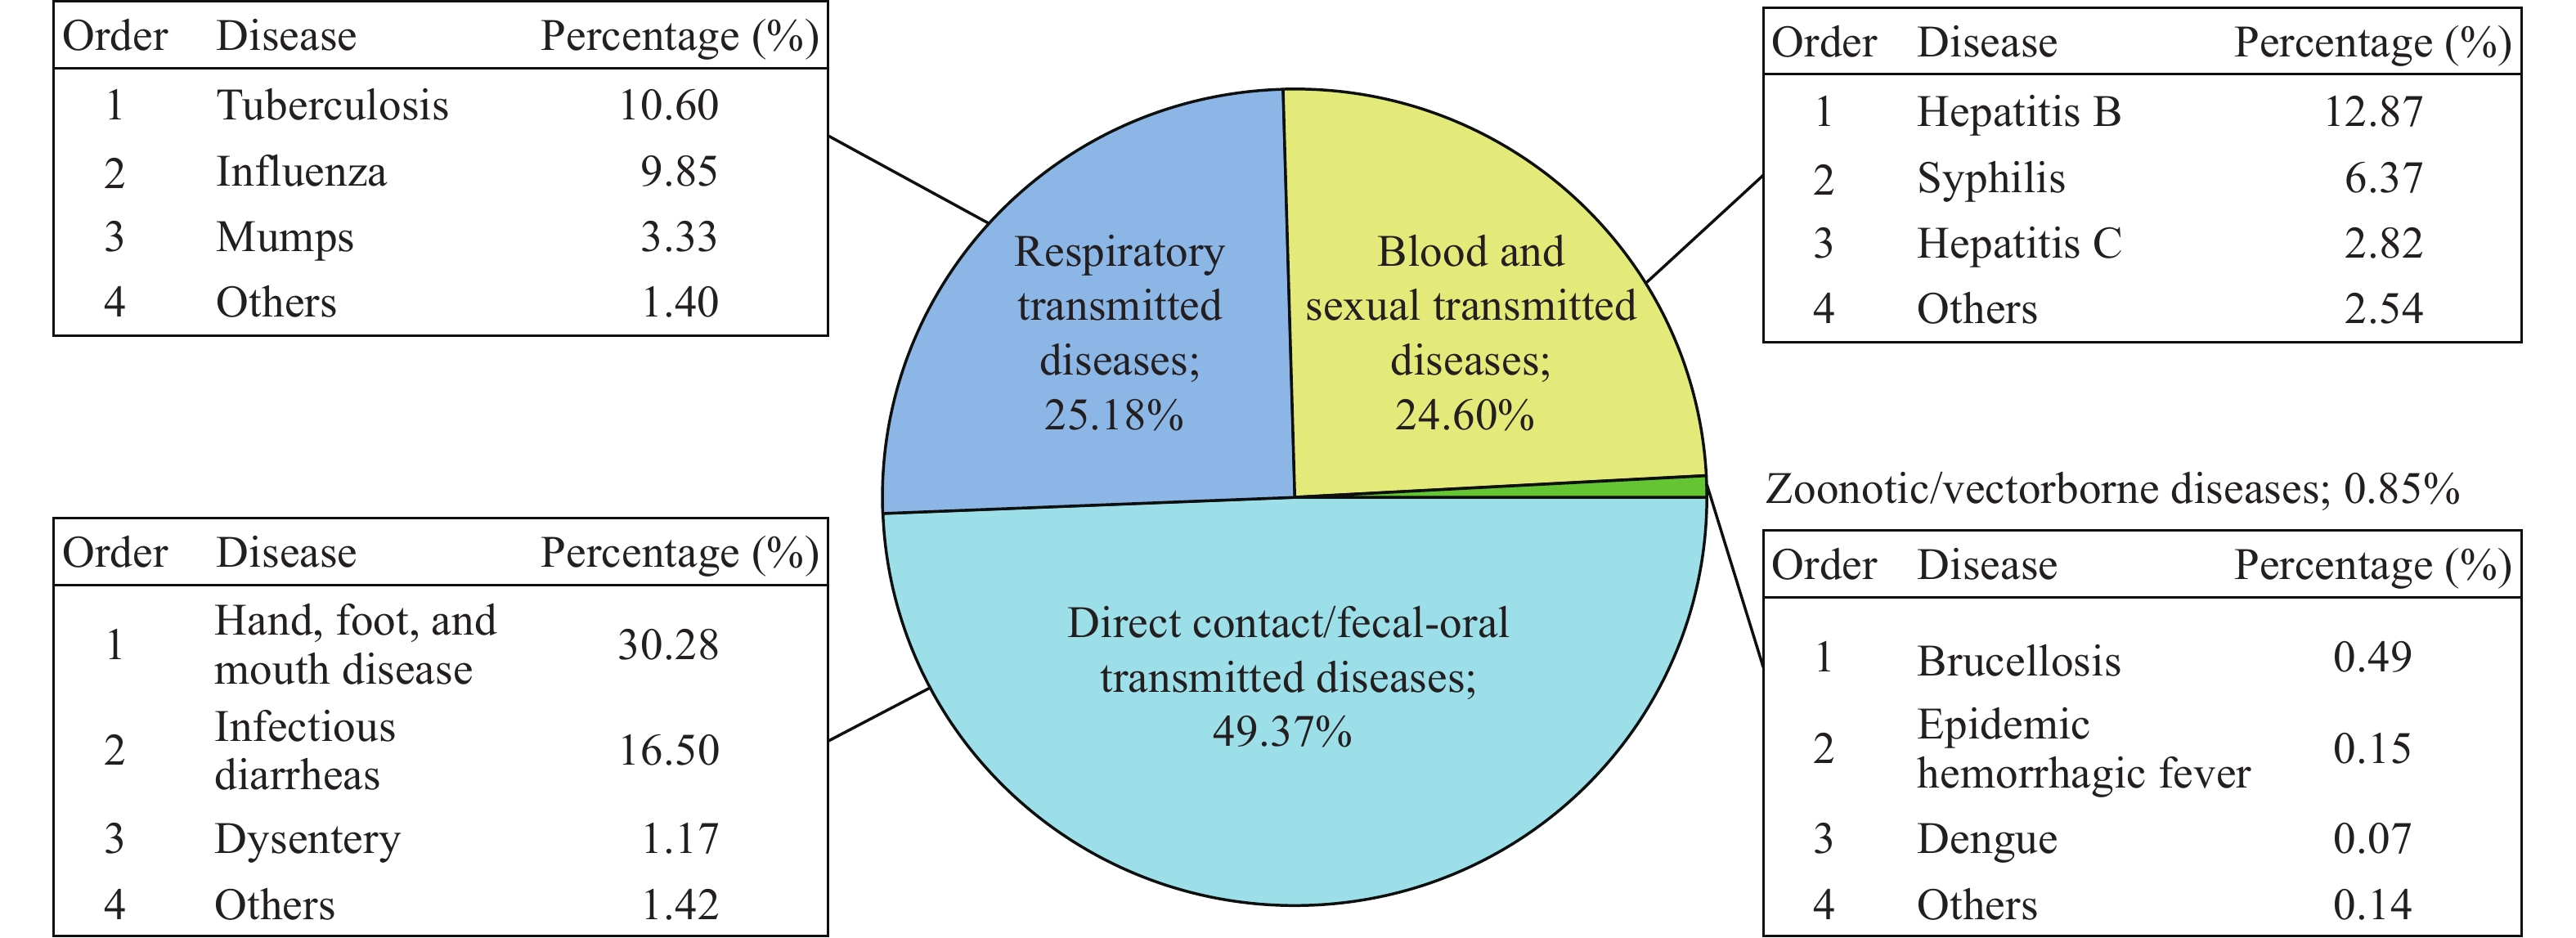 Figure 1.
The morbidity analysis by the main route of transmission and the reservoir of the organism in China, 2018.
Zhejiang Province, Guangxi Autonomous Region, Guangdong Province, Beijing Municipality, and Xinjiang Autonomous Region are the five regions with the highest reported morbidity of infectious diseases, and the morbidities were 986.47, 981.61, 932.64, 840.72, and 813.49 cases per 100,000 population, respectively. For the top four regions, the leading diseases were mainly HFMD, infectious diarrhea, influenza, all of which belong to Class C. However, hepatitis B, syphilis, and infectious diarrhea were the three leading diseases in Xinjiang Autonomous Region of western China. Combining the regional distribution of infectious diseases with different transmission routes, Guangxi Autonomous Region and Zhejiang Province had higher morbidity of direct contact/fecal-oral transmitted diseases than other regions in China including HFMD and infectious diarrhea diseases. Beijing Municipality, Xinjiang Autonomous Region, and Tibet Autonomous Region reported more morbidity of respiratory infectious diseases like tuberculosis and influenza than other provinces. The morbidity of zoonotic infectious diseases was higher in northern regions, including Inner Mongolia Autonomous Region, Ningxia Autonomous Region, and Xinjiang Autonomous Region, than other regions. These diseases include brucellosis and epidemic hemorrhagic fever. Xinjiang Autonomous Region, Hainan Province, and Qinghai Province reported more morbidity of blood and sexually transmitted diseases, including hepatitis B and syphilis (Figure 2).
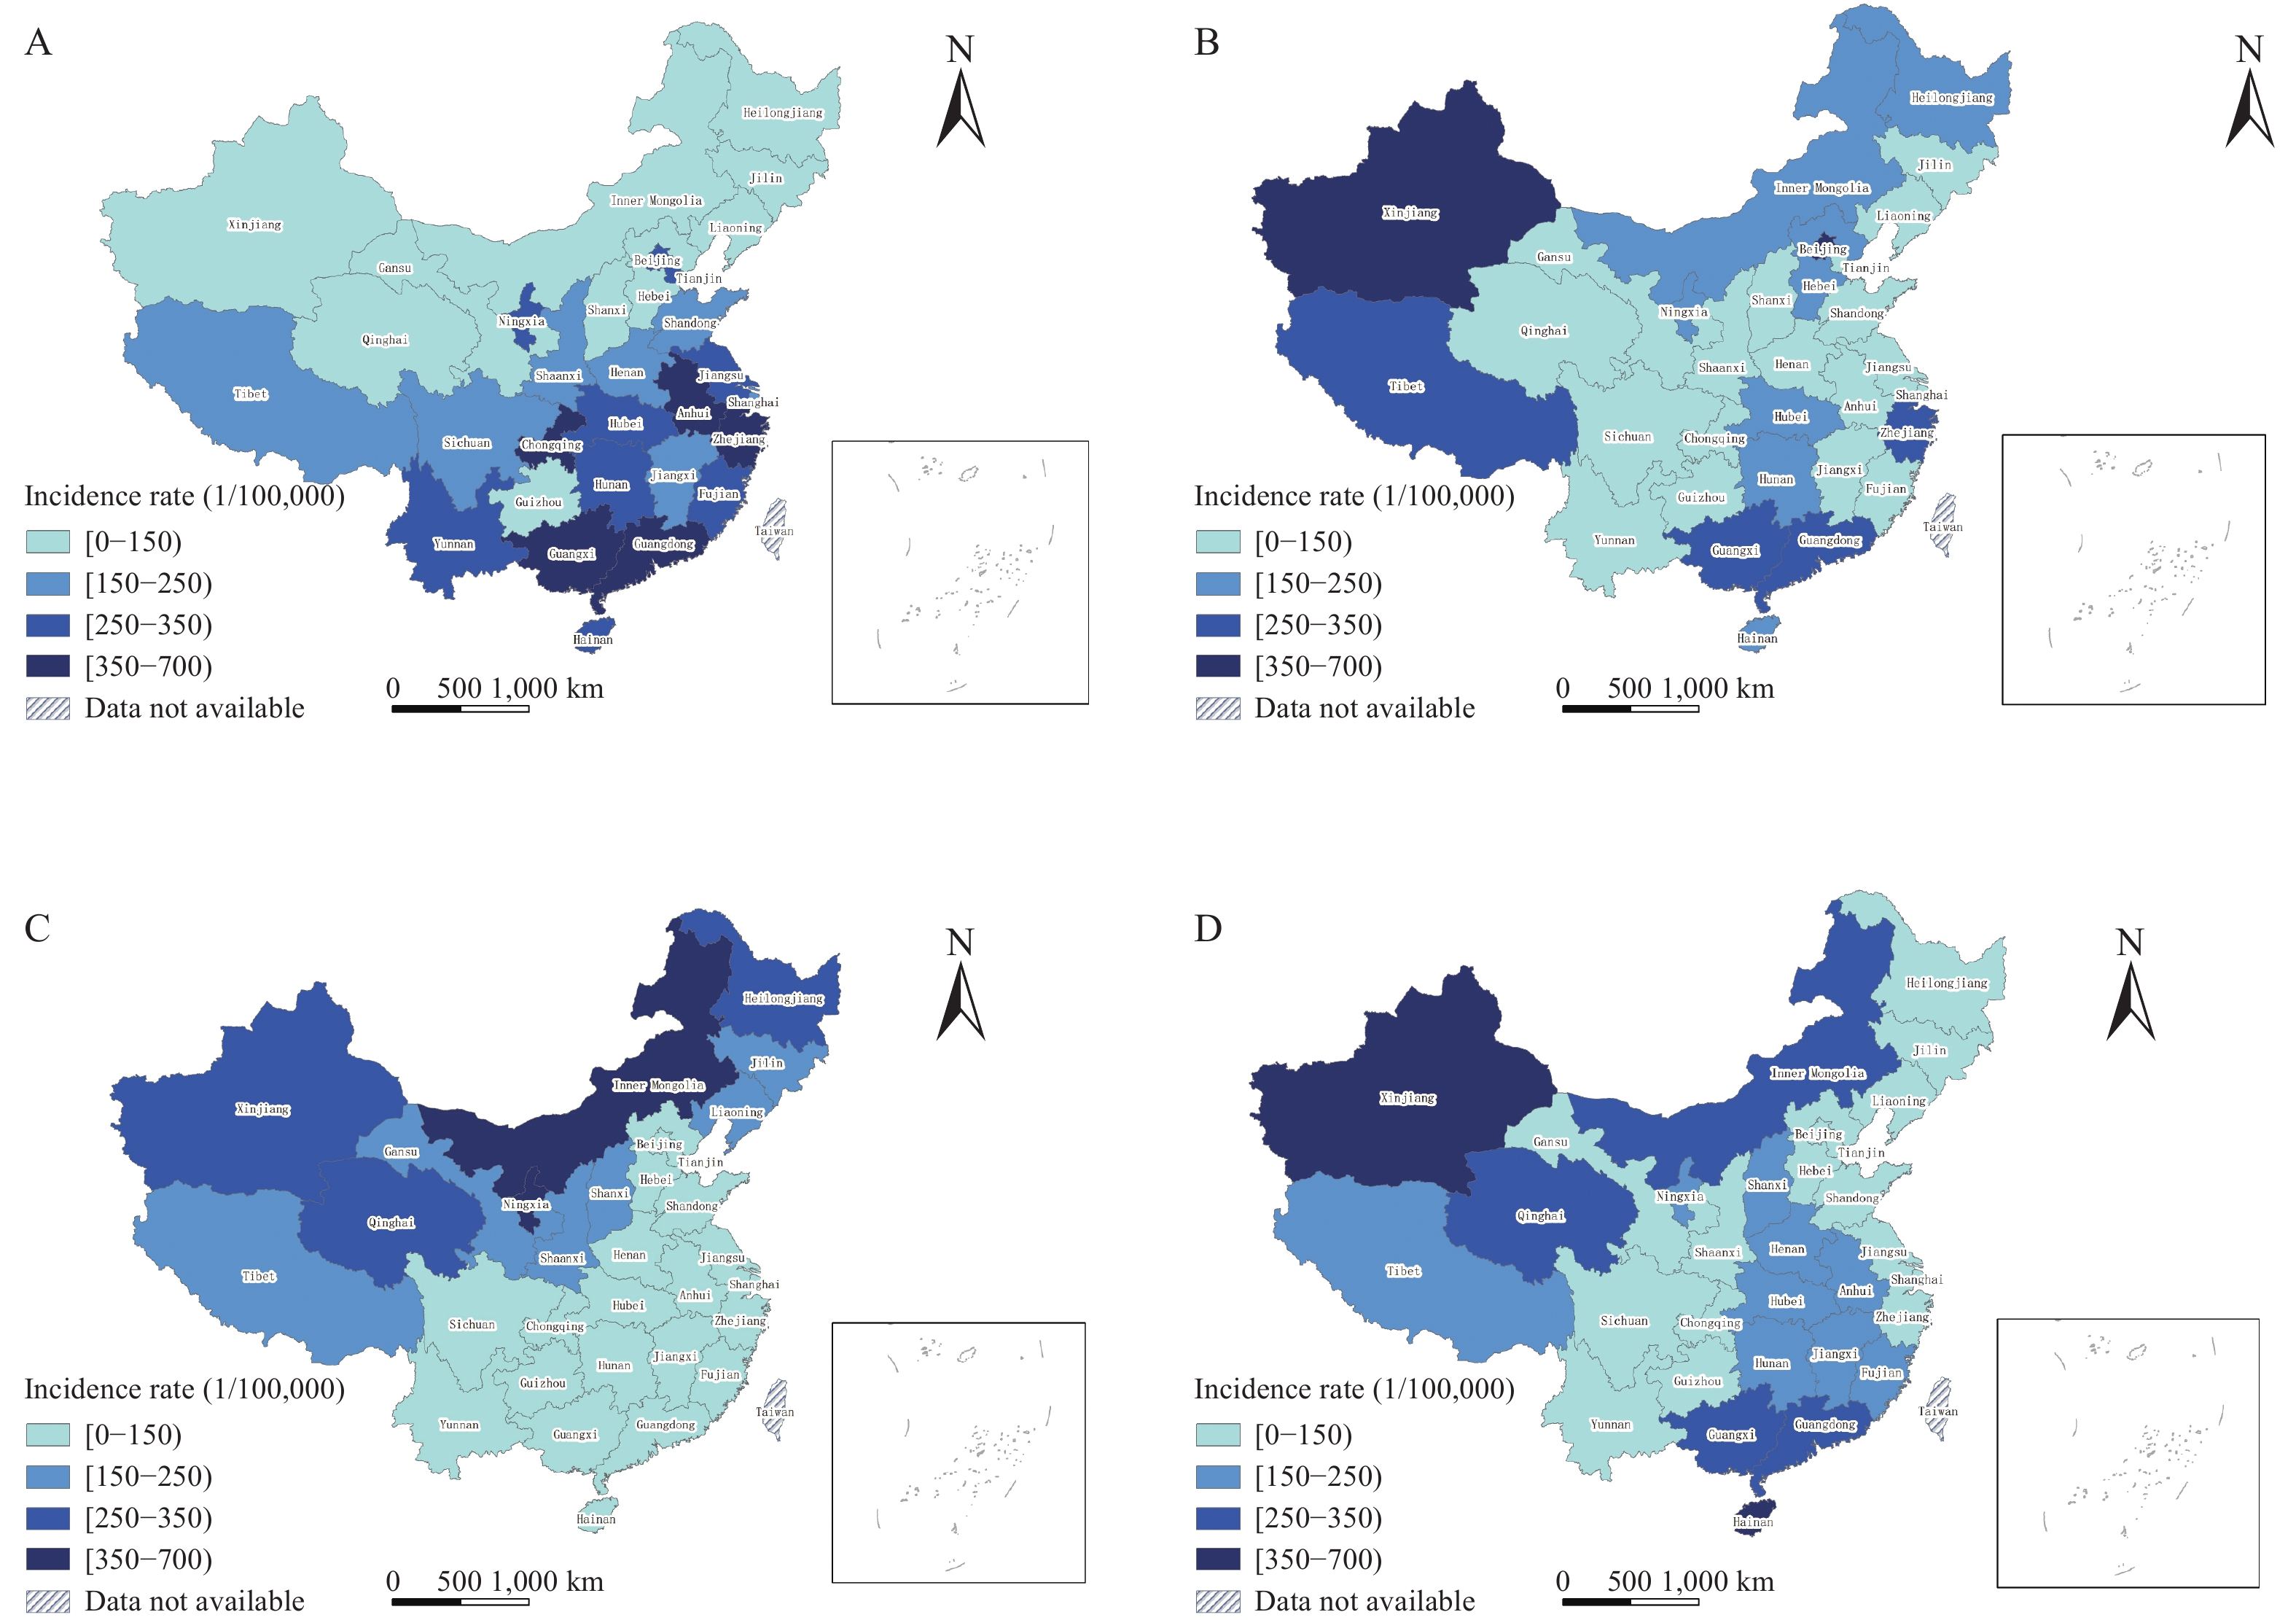 Figure 2.
Geographical distribution of the morbidity of notifiable diseases in China, 2018. (A) Direct contact/fecal-oral transmitted diseases; (B) Respiratory transmitted diseases; (C) Zoonotic and vector-borne diseases; (D) Blood and sexual transmitted diseases.
In 2018, 36.22% of national notifiable disease cases were laboratory diagnosed, 4.03% lower than the average rate between 2015–2017. The proportion of bacterial pathogens with laboratory confirmation was 57.26%, an increase of 8.14% compared to the 3-year average. However, the proportion of viral disease cases with laboratory confirmation was 32.15%, a decrease of 8.56% compared with the average of 2015–2017. The proportion of parasitic cases with laboratory confirmation was 54.17%, an increase of 110.78% compared with the average of 2015–2017. All cases of cholera, H7N9, gonorrhea, and syphilis were laboratory confirmed, but the proportions of scarlet fever, neonatal tetanus, mumps, and acute hemorrhagic conjunctivitis with laboratory confirmation were less than 5% (Table 1).
-
The national morbidity of notifiable infectious diseases showed an increase in 2018 compared with the average of 2015–2017, and all the morbidities of direct contact/fecal-oral transmitted diseases, respiratory transmitted diseases, and blood-borne/sexually transmitted diseases increased, which can be attributed primarily to the higher morbidity of category C diseases, such as HFMD, infectious diarrhea, and influenza. There was 2,353,310 HFMD cases reported in 2018, an increase over 230,000 cases compared with the average of 2015–2017, and this was the largest contributor of direct contact/fecal–oral transmission cases. The HFMD morbidity is higher in eastern and southern provinces of China, and children less than three years old should be the primary targets for interventions (6).
There were 1,282,270 infectious diarrhea cases reported in 2018, an increase of over 200,000 cases compared with the average of 2015–2017, becoming one of the great health threats to infants and children since the year of 2008. The seasonal influenza epidemic increased 136.23% in 2018 compared with the average of 2015–2017. Increasing recognition of influenza and increasing awareness of diagnosis and reporting by doctors, espeically in developed provinces such as Beijing, might explain this increase.
Tuberculosis morbidity was reported as 59.27 cases per 100,000 population and contributes the most to the burden of respiratory transmitted diseases. The World Health Organization (WHO) reported over 10 million new tuberculosis cases globally in 2018, and China was one of 20 countries with the highest tuberculosis burden (7).
Hepatitis B morbidity was reported as 71.99 cases per 100,000 population, an increase of 2.87% compared with the average of the recent three years, which accounted for the largest proportion of blood/sexually transmitted diseases. The most cost-effective way to control hepatitis B is to prevent a susceptible person from acquiring Hepatitis B virus infection by the interruption of the transmission route and by immunization of susceptible hosts (8).
Zoonotic and vector-borne disease morbidity decreased slightly. Brucellosis morbidity was reported as 2.73 cases per 100,000 population and was the leading zoonotic and vector-borne disease. Brucellosis morbidity is high in northern provinces such as Inner Mongolia Autonomous Region, Heilongjiang Province and Xinjiang Autonomous Region, and sporadic outbreaks occured in southern regions caused by infected imported animals from northern regions.
Rabies morbidity was 0.03 cases per 100,000 population and has progressively decreased since 2008. Rabies outbreaks have been effectively controlled. China has the ability to achieve the WHO global goal of eliminating rabies transmission from dog to human by 2030 (9).
Dengue fever morbidity increased by 28.86% in 2018, compared with the average of 2015–2017. In recent years, dengue outbreaks occurred frequently in coastal areas, such as Zhejiang Province and Guangdong Province, and most dengue cases in China were imported (10).
Overall, the laboratory diagnosis rate of notifiable disease decreased 4.03% compared with the average of 2015–2017. The laboratory diagnosis rate of class C infectious diseases is still lower than that of class A and B infectious diseases. Parasitic infectious diseases had a significantly higher laboratory diagnostic rate in 2018 compared with the average of 2015–2017. However, there is still a big gap in terms of laboratory evidence of pathogen diagnosis between China and western countries (11). Even though China has uniform diagnostic standards and reporting requirements for infectious diseases, unbalanced develpoment of laboratory diagnostic facilities and economic status within the country may limit the laboratory confirmation rates, which is reflected in the laboratory diagnosis rate of notifiable disease cases varies across the country. Thus, further strengthening the construction of infectious disease laboratory systems in China and the laboratory testing capabilities are major priorities.
Conflict of interest statement: The authors who have taken part in this study declared that they do not have any other potential conflicts of interest.
Financial support statement: This study was funded by grants from the National Science and Technology Major Project of China (No. 2018ZX10713001-001) and National Natural Science Foundation of China (No. 91846302).
Authors’ contributions: Shuaibing Dong and Xiang Ren contributed equally to this work. Zhongjie Li, Liping Wang, and Lijie Zhang designed and supervised this study; Shuaibing Dong and Xiang Ren wrote the manuscript; Cuihong Zhang, Mengjie Geng, Yuliang Zhu, and Lusha Shi prepared and cleaned the data; Shuaibing Dong, Xiang Ren, and Cuihong Zhang carried out the analysis; All authors interpreted the data and critically revised the manuscript for important intellectual content.
HTML
| Citation: |

|