

 Download:


-
Measles, an acute respiratory infectious disease caused by the measles virus, was responsible for millions of deaths annually before the introduction of the measles vaccine (MV) (1). Widespread availability of measles vaccines and the initiation of the Expanded Program on Immunization, approved at the 27th World Health Assembly in 1974 (2), have significantly improved global measles control. In China, measles has been a statutorily notifiable disease since the establishment of the National Notifiable Diseases Reporting System (NNDRS) in 1950 (3). From 1950 to 1986, data were collected by subnational institutions of disease control and aggregated by the national institution using paper documentation. In 1987, an electronic documentation system replaced the paper-based system (3). In 2004, China upgraded the NNDRS to enable direct reporting via the Internet (4).
The measles vaccine was first introduced in China as a liquid formulation in 1965. In 1978, the National Expanded Program on Immunization (EPI) was launched, initiating a one-dose routine measles vaccination schedule (5). Between 2003 and 2009, 27 out of 31 provincial-level administrative divisions (PLADs) in China carried out unsynchronized provincewide supplementary immunization activities to combat measles, targeting approximately 185.7 million children (6). In 2010, China executed synchronized nationwide supplementary immunization activities against measles.
The epidemiology of measles has been described at subnational levels across four stages; however, a quantitative evaluation of the effects of major interventions at the national level has not yet been conducted. Interrupted time series (ITS) analyses are commonly employed to assess the impact of public health interventions, as they offer quantitative comparisons before and after interventions and evaluate both short-term changes and long-term trends. In this study, we utilized ITS analyses to examine the influence of three significant MV interventions at both the national and regional levels in China. These findings will enhance our understanding of the effects of previous immunization strategies and provide valuable evidence for the future development of immunization policies and strategies.
We obtained measles incidence data from the Public Health Science Data Center, along with provincial population data and per capita gross domestic product (GDP) data from the National Bureau of Statistics. We divided the study period from 1952 to 2021 into four stages based on the history of measles control in China:
Stage 1: Pre-vaccine (1952–1964) — Prior to the introduction of the MV, measles was a nearly ubiquitous childhood illness.
Stage 2: Pre-EPI (1965–1977) — Following MV introduction but before the EPI, MV availability was limited, and coverage rates remained low in China.
Stage 3: EPI (1978–2008) — During the EPI period, a standard routine immunization schedule was implemented to vaccinate a defined target population, resulting in gradually increased coverage.
Stage 4: Post-SIAs (2009–2021) — After the implementation of national and subnational Supplementary Immunization Activities (SIAs), MV coverage in children remained high.
The study period involved four stages that included three interventions as the focus of our research: 1) vaccine introduction in 1965, 2) the implementation of the EPI in 1978, and 3) the initiation of SIAs in 2009. The year 2009 was presumed to be when SIAs were conducted nationwide, taking into account the timeline of subnational and national SIAs.
Based on the economic status in China, four economic regions by PLADs were identified: western China (Inner Mongolia, Guangxi, Chongqing, Sichuan, Guizhou, Yunnan, Tibet, Shaanxi, Gansu, Qinghai, Ningxia, Xinjiang); central China (Shanxi, Anhui, Jiangxi, Henan, Hubei, Hunan); eastern China (Beijing, Tianjin, Hebei, Shanghai, Jiangsu, Zhejiang, Fujian, Shandong, Guangdong, Hainan); and northeastern China (Liaoning, Jilin, Heilongjiang). Eastern China exhibits the highest GDP level, followed sequentially by central China, western China, and northeastern China (7).
A single-group ITS analysis was conducted on annual measles incidence data to assess the impact of three interventions on measles control in China from 1952 to 2021. In the ITS model, the outcome variable Y represents the annual incidence of measles, with X1 representing the year (0, 1, 2, ..., n by year). X2 signifies the first intervention (0 before 1965 and 1 after 1965), while X3 denotes a trend variable following the first intervention (0 before 1965, with the value of 0, 1, 2, …, n by year after 1965). The second intervention is illustrated by X4 (0 before 1978 and 1 after 1978), and X5 corresponds to a trend variable following the second intervention (0 before 1978, with values of 0, 1, 2, …, n by year after 1978). X6 represents the third intervention (0 before 2009 and 1 after 2009), and X7 is a trend variable after the third intervention (0 before 2009, with values of 0, 1, 2, …, n by year after 2009). Lastly, X8 denotes per capita GDP. The ITS model equation was as follows:
$$ \begin{aligned} Y=&{\beta }_{0}+{\beta }_{1}{X}_{1}+{\beta }_{2}{X}_{2}+{\beta }_{3}{X}_{3}+{\beta }_{4}{X}_{4}+{\beta }_{5}{X}_{5}+{\beta }_{6}{X}_{6}\\ &+{\beta }_{7}{X}_{7}+{\beta }_{8}{X}_{8}+\varepsilon \end{aligned}$$ In the given model, β0 represents the intercept term, signifying the average measles incidence at the beginning of the study. Meanwhile, β1 indicates the slope or trend of the incidence before the introduction of the measles vaccine, reflecting the average direction of measles incidence over time. β2 denotes the change in incidence after the measles vaccine was introduced in 1965, and β3 signifies the slope change following the vaccine’s introduction. Additionally, β4 represents the change subsequent to the EPI implementation, and β5 corresponds to the trend after the second intervention, illustrating the long-term impact of EPI implementation. Furthermore, β6 demonstrates the short-term change resulting from SIAs; while β7 indicates long-term trends after SIAs. Lastly, β8 represents the association between per capita GDP and incidence.
The current study employed ITS analyses to assess the impact of three primary interventions on measles incidence in China. Segmented regression within a quasi-Poisson model was utilized, with annual measles cases as the dependent variable. In this model, annual measles incidence functioned as the response variable, accompanied by an offset component representing the total population for the given year. Additionally, GDP per capita was incorporated into the model to estimate its association with alterations in the level of measles incidence.
In this study, Microsoft Excel 2019 (Microsoft Corporation, Redmond, WA, USA) was employed to construct the measles incidence database. Statistical analyses were performed using the Statistical Analysis System (SAS, version 9.4; SAS Institute Inc, Cary, NC, USA).
Figure 1 shows the temporal patterns of measles incidence in China from 1952 to 2021. The annual reported measles incidence significantly decreased from 189.44 cases per 100,000 individuals in 1952, with a maximum of 1,432.41 cases per 100,000 in 1959, to 0.04 cases per 100,000 in 2021. From 1952 to 1978, incidence remained high, ranging from 157.51 to 1,432.41 cases per 100,000, and exhibited periodic peaks every 3–5 years. A decline in incidence became evident after 1978, accompanied by the disappearance of periodic peaks. Incidence consistently remained low after 1987, falling below 10 cases per 100,000 in most years, and reached a nadir in 2012 (0.45 cases per 100,000). In 2015, incidence increased to 3.09 cases per 100,000, but subsequently declined to a historical low in 2021 (0.04 cases per 100,000). The annual measles incidence in China decreased by more than 99.99% from its peak in 1959 to 2021.
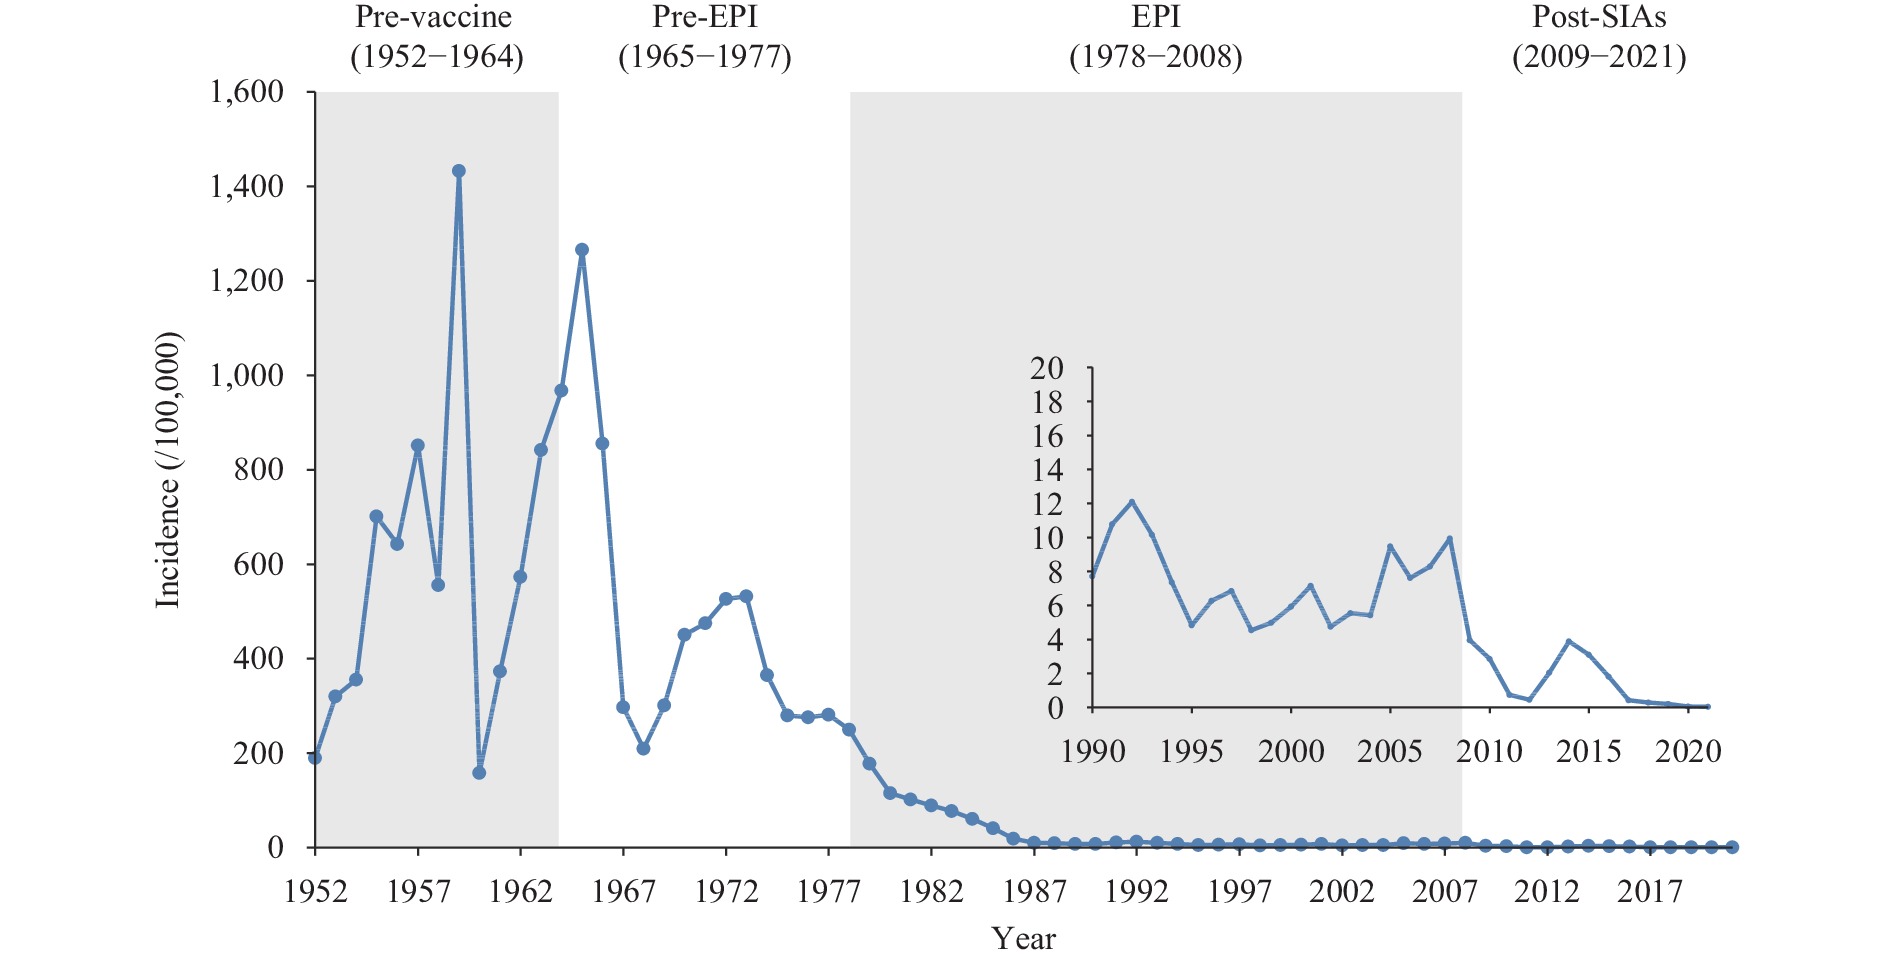 Figure 1.
Annual reported measles incidence in China, 1952 to 2021.
Abbreviation: EPI=expanded program on immunization; SIAs=supplementary immunization activities.Between 1952 and 2021, a total of 111,925,154 measles cases were reported, averaging 1,599,316 cases annually and a cumulative average incidence of 153.45 per 100,000 population. Approximately 90% of these cases occurred during the pre-vaccine and pre-EPI stages. The average incidence rates for the pre-vaccine, pre-EPI, EPI, and post-SIAs stages were 615.06, 450.91, 31.15, and 1.62 per 100,000, respectively. This data demonstrate a declining trend in measles incidence from the pre-vaccine stage to the post-SIAs stage (Table 1).
Stage Duration No. of cases (%) Average No. of cases/year Average incidence rate (/100,000) Pre-vaccine 1952–1964 51,189,211 (45.72) 3,937,632 615.06 Pre-EPI 1966–1977 49,324,478 (44.06) 3,794,191 450.91 EPI 1978–2008 11,147,975 (9.96) 359,612 31.15 Post-SIAs 2009–2021 290,490 (0.26) 22,345 1.62 Total 1952–2021 111,952,154 (100) 1,599,316 153.45 Abbreviation: EPI=expanded program on immunization; SIAs=supplementary immunization activities. Table 1. National incidence of measles in different stages from 1952 to 2021.
According to analyses examining the spatial distribution of measles incidence across different stages and throughout the entire study period (1952–2021), high incidences were observed in eastern, central, and western China. The incidence was highest in western China (252.58/100,000) and lowest in eastern China (4.61/100,000). In the pre-vaccine era, eastern China displayed high incidence rates, peaking at 1,599.07/100,000. During the pre-EPI stage, most high-incidence PLADs were located in central China, but the highest incidence (848.96/100,000) was observed in western China. High incidence rates were reported in both western and central China during the EPI stage, with the highest rate of 200.74/100,000 occurring in western China. Finally, in the post-SIAs stage, most high incidences were observed in western China, peaking at 9.17/100,000.
In the pre-vaccine stage, measles incidence increased by 5.9% per year [incidence rate ratio (IRR)=1.059, P=0.016], as demonstrated in our Poisson model (Table 2). Following the introduction of the measles vaccine during the pre-EPI stage, incidence decreased by 13.9% (IRR=0.861, P<0.001) each year compared to the pre-vaccine stage. This resulted in a short-term decrease in measles incidence by 16.1% (IRR=0.839, P=0.432).
Region Variable β (95% CI) IRR (95% CI) P China Trend before the first intervention (1952–1964) 0.057 (0.011, 0.104) 1.059 (1.011, 1.110) 0.016 Level change with the first intervention (1965) −0.176 (−0.613, 0.262) 0.839 (0.542, 1.300) 0.432 Trend change with the first intervention (1966–1977) −0.150 (−0.216, −0.084) 0.861 (0.806, 0.920) <0.001 Level change with the second intervention (1978) −0.042 (−0.699, 0.615) 0.959 (0.497, 1.851) 0.901 Trend change with the second intervention (1978–2008) −0.175 (−0.286, −0.063) 0.840 (0.751, 0.938) 0.002 Level change with the third intervention (2009) −2.110 (−6.580, 2.361) 0.121 (0.001, 10.603) 0.355 Trend change with the third intervention (2009–2021) −0.790 (−1.818, 0.238) 0.454 (0.162, 1.269) 0.132 GDP 2.300x10⁻⁴ (6.422x10⁻⁵, 3.960x10⁻⁴) 1.000 (1.000, 1.000) 0.007 Eastern China Trend before the first intervention (1952–1964) 0.065 (0.019, 0.110) 1.067 (1.019, 1.117) 0.005 Level change with the first intervention (1965) −0.350 (−0.795, 0.096) 0.705 (0.452, 1.100) 0.124 Trend change with the first intervention (1966–1977) −0.180 (−0.251, −0.110) 0.835 (0.778, 0.896) <0.001 Level change with the second intervention (1978) 0.112 (−0.669, 0.892) 1.118 (0.512, 2.440) 0.779 Trend change with the second intervention (1978–2008) −0.182 (−0.320, −0.044) 0.833 (0.726, 0.957) 0.010 Level change with the third intervention (2009) −1.945 (−6.195, 2.304) 0.143 (0.002, 10.013) 0.370 Trend change with the third intervention (2009–2021) −0.752 (−1.698, 0.194) 0.471 (0.183, 1.214) 0.119 GDP 1.870x10⁻⁴ (5.768x10⁻⁵, 3.157x10⁻⁴) 1.000 (1.000, 1.000) 0.005 Northeastern China Trend before the first intervention (1952–1964) 0.065 (0.013, 0.117) 1.067 (1.013, 1.124) 0.015 Level change with the first intervention (1965) −0.967 (−1.564, −0.371) 0.380 (0.209, 0.690) 0.002 Trend change with the first intervention (1966–1977) −0.264 (−0.372, −0.155) 0.768 (0.689, 0.856) <0.001 Level change with the second intervention (1978) 1.206 (−0.054, 2.466) 3.340 (0.947, 11.777) 0.061 Trend change with the second intervention (1978–2008) −0.175 (−0.418, 0.068) 0.840 (0.658, 1.071) 0.159 Level change with the third intervention (2009) −1.372 (−7.526, 4.783) 0.254 (0.001, 119.420) 0.662 Trend change with the third intervention (2009–2021) −0.964 (−2.599, 0.671) 0.381 (0.074, 1.956) 0.248 GDP 4.050x10⁻⁴ (3.951x10⁻⁵, 7.715x10⁻⁴) 1.000 (1.000, 1.001) 0.030 Central China Trend before the first intervention (1952–1964) 0.054 (0.000, 0.107) 1.055 (1.000, 1.113) 0.050 Level change with the first intervention (1965) 0.064 (−0.420, 0.548) 1.066 (0.657, 1.730) 0.795 Trend change with the first intervention (1966–1977) −0.124 (−0.194, −0.054) 0.883 (0.823, 0.948) 0.001 Level change with the second intervention (1978) −0.282 (−0.938, 0.374) 0.754 (0.391, 1.453) 0.399 Trend change with the second intervention (1978–2008) −0.219 (−0.340, −0.098) 0.803 (0.712, 0.906) <0.001 Level change with the third intervention (2009) −2.180 (−7.601, 3.242) 0.113 (0.000, 25.578) 0.431 Trend change with the third intervention (2009–2021) −1.124 (−2.563, 0.315) 0.325 (0.077, 1.370) 0.126 GDP 3.320x10⁻⁴ (8.195x10⁻⁵, 5.811x10⁻⁴) 1.000 (1.000, 1.001) 0.009 Western China Trend before the first intervention (1952–1964) 0.055 (0.002, 0.108) 1.056 (1.002, 1.114) 0.044 Level change with the first intervention (1965) 0.034 (−0.446, 0.515) 1.035 (0.640, 1.673) 0.889 Trend change with the first intervention (1966–1977) −0.140 (−0.211, −0.068) 0.870 (0.810, 0.934) <0.001 Level change with the second intervention (1978) −0.035 (−0.662, 0.592) 0.966 (0.516, 1.807) 0.913 Trend change with the second intervention (1978–2008) −0.134 (−0.230, −0.038) 0.875 (0.795, 0.962) 0.006 Level change with the third intervention (2009) −2.819 (−8.163, 2.524) 0.060 (0.000, 12.479) 0.301 Trend change with the third intervention (2009–2021) −0.652 (−1.776, 0.473) 0.521 (0.169, 1.604) 0.256 GDP 2.580x10⁻⁴ (3.717x10⁻⁵, 4.796x10⁻⁴) 1.000 (1.000, 1.000) 0.022 Abbreviation: GDP=gross domestic product; IRR=incidence rate ratio. Table 2. Interrupted time series results for measles incidence in China.
The introduction of measles vaccine led to significant declines in incidence over time. In the EPI stage, compared to the pre-EPI stage, incidences further decreased by 16.1% (IRR=0.839, P=0.002) each year. Additionally, a short-term level decrease of 4.1% in 1978 (IRR=0.959, P=0.901) was observed.
After the implementation of national and subnational SIAs in China (beginning in 2009), the post-SIAs stage (2009–2021) saw an average annual decrease in the incidence of 54.6% (IRR=0.454, P=0.132), and the short-term level of incidence decreased by 87.9% (IRR=0.121, P=0.355) compared to the EPI stage (1978–2008). Our model indicated an IRR of 1.0002 (P=0.007) with GDP, suggesting a slight increase in incidence associated with GDP.
The results of the ITS Poisson model for the four economic regions were consistent with those observed in China. In the pre-vaccine era, the annual incidence trend increased by 6.7% (IRR=1.067, P=0.005) in eastern China, 6.7% (IRR=1.067, P=0.015) in northeastern China, 5.5% (IRR=1.055, P=0.050) in central China, and 5.6% (IRR=1.056, P=0.044) in western China.
Following the introduction of the measles vaccine in 1965, incidence rates decreased in the short term by 29.5% (IRR=0.705, P=0.124) and 62.00% (IRR=0.380, P=0.002) in eastern and northeastern China. In contrast, incidence rates increased by 6.6% (IRR=1.066, P=0.795) and 3.5% (IRR=1.035, P=0.889) in central and western China. When compared to the pre-vaccine era (1952–1964), incidence rates during the pre-EPI stage (1965–1977) decreased by 16.5% (IRR=0.835, P<0.001), 23.2% (IRR=0.768, P<0.001), 11.7% (IRR=0.883, P=0.001), and 13.0% (IRR=0.870, P<0.001) in eastern, northeastern, central, and western China, respectively.
Following the implementation of EPI in 1978, incidence rates during the EPI stage (1978–2008) showed annual decreases of 16.7% (IRR=0.833, P=0.010), 16.0% (IRR=0.840, P=0.159), 19.7% (IRR=0.803, P<0.001), and 12.5% (IRR=0.875, P=0.006) in eastern, northeastern, central, and western China, respectively. Short-term level reductions were observed in central (IRR=0.754, P=0.399) and western China (IRR=0.966, P=0.913), whereas increases were found in eastern (IRR=1.118, P=0.779) and northeastern China (IRR=3.340, P=0.061).
Following the SIAs, the incidence of the disease decreased by 85.7% (IRR=0.143, P=0.370), 74.6% (IRR=0.254, P=0.662), 88.7% (IRR=0.113, P=0.431), and 94.0% (IRR=0.060, P=0.301) in the eastern, northeastern, central, and western regions of China, respectively. In the post-SIAs phase, the annual incidence reduction was 52.9% (IRR=0.471, P=0.119), 61.9% (IRR=0.381, P=0.248), 67.5% (IRR=0.325, P=0.126), and 47.9% (IRR=0.521, P=0.256) in the eastern, northeastern, central, and western regions of China.
-
Our analysis revealed a significant increase in measles incidence prior to the introduction of the MV. Following MV implementation, we observed substantial reductions in both short-term and longer-term incidence rates resulting from EPI implementation and the conduct of measles SIAs. The average annual incidence decreased from 615 cases per 100,000 individuals in the pre-vaccine stage to 1.62 cases per 100,000 individuals in the post-SIAs stage. Consequently, the past 70 years have seen remarkable progress in measles control and prevention efforts across China.
Consistent with previous research (3,8), our study demonstrated epidemic peaks occurring every 3 to 5 years during the pre-vaccine and early pre-EPI stages when measles was a prevalent childhood disease. Following the introduction of the vaccine and increased coverage, these peaks were no longer evident, suggesting that vaccination altered the temporal dynamics of measles.
The spatial distribution of measles incidence exhibited variation across different stages. In the pre-vaccine stage, the highest incidence PLADs were predominantly located in the northeastern and southern regions of China. This shifted to southern China in the pre-EPI stage, to southwestern China during the EPI stage, and finally to southeastern China in the post-SIAs stage. These fluctuations may be attributed to unequal increases in vaccine coverage rates across various PLADs at distinct stages (9). Additionally, differences in the sensitivity of measles surveillance could have contributed to the observed variation in the spatial distribution of incidence (10).
Through separate ITS analyses in China and its four economic regions, we demonstrated the significant impact of three primary interventions on measles control and prevention at both national and subnational levels. In China, the most substantial change in trend (54.6% per year, P=0.132) occurred following the implementation of SIAs, followed by annual declines of 16.0% (P=0.002) after EPI introduction in 1978, and 13.9% (P<0.001) after vaccine introduction in 1965. The SIAs contributed more to the changes in measles incidence trends compared to vaccine introduction and EPI implementation. This finding may be attributed to the higher baseline MV coverage before the SIAs relative to MV coverage before the other two interventions, as the SIAs were the final set of measures among the three interventions studied (11).
Measles incidence declines following vaccine introduction varied by region in China. The largest decrease was observed in northeastern China (23.2%, P<0.0001), followed by eastern (16.5%, P<0.0001), western (13.0%, P<0.001), and central China (11.7%, P=0.001). It is worth noting that northeastern China served as the heavy industrial base of China in the last century (12) and received substantial support for health services during this period (13). Consequently, the availability and affordability of the measles vaccine were higher in this region when vaccinations required out-of-pocket payments.
Following the implementation of the EPI in 1978, declines in annual measles incidence became more comparable across regions, as program vaccines were offered nationwide at no charge to families (14). However, the impact of SIAs on long-term trends was not significant in our study. This finding may be attributed to the already low measles incidence during the post-SIAs stage; the slope could not decrease further when the incidence was near zero (15).
We did not observe any significant changes in the level for all three interventions in both China and the four economic regions (with the exception of northeastern China in 1965), indicating a suboptimal short-term decline. Measles control is dependent on high coverage; therefore, the introduction of vaccines and the implementation of EPI would not achieve high coverage within a single year. The SIAs were conducted over several years to reach the entire country. Consequently, a short-term decline was not anticipated in 2009.
We also investigated the associations between per capita GDP and measles incidence. Our findings revealed a weak, positive correlation between China and its four economic regions, which contrasts with another study (12). A high GDP might be linked to increased interactions and population mixing, potentially facilitating measles transmission. Nevertheless, these findings should be interpreted cautiously. A more comprehensive evaluation, incorporating various potential influencing factors such as ecological environment, socioeconomic status, advancements in medical technology, population mobility, and meteorological factors, is warranted.
Our quasi-experimental study has several limitations. Although ITS analysis for public health intervention evaluation is a robust technique, we were only able to analyze the annual incidence of reported measles. The results of our ITS analysis rely on the quality and completeness of reporting. Given that all data originated from a passive surveillance system and the data collection transitioned from paper to digital reports during the study period, the sensitivity of the data, as well as the case definition, diagnostic, and reporting standards, varied across the four stages. Due to the inherent properties of ITS analysis, it was challenging to evaluate trend changes when the incidence reached very low levels, such as during the post-SIAs stage. Lastly, the incidence of respiratory disease may be influenced by numerous factors. We only included GDP per capita as a covariate, owing to data availability limitations.
-
The authors declare no competing interests.
HTML

| Citation: |

|