

 Download:


-
The coronavirus disease 2019 (COVID-19) pandemic, caused by severe acute respiratory syndrome coronavirus 2 (SARS-CoV-2), has been declared as a Public Health Emergency of International Concern for over three years (1), leading to a combined health and socioeconomic crisis of unprecedented severity (2). Entering 2022, the highly contagious mutant strain of Omicron variants spread rapidly in China (3). In late 2022, the costs of prevention and control of the epidemic became higher due to the rapid spread of the highly contagious Omicron variants (3). To contain the epidemic in a shorter period, minimize the epidemic impact on socioeconomic development and people’s livelihood (3-4), and take into account the highly infectious but less virulent Omicron variants, the high coverage of COVID-19 vaccines, and the significantly improved health literacy of the public (5), Chinese government successively issued the “20 Measures” and “Ten New Measures” to continuously optimize the epidemic prevention and control plan (6). Then, a rapid transmission of Omicron variants happened throughout China.
In the Omicron variants epidemic in China from late 2022, there has been widespread concern about SARS-CoV-2 infections in rural areas (7). Several studies have reported on SARS-CoV-2 infection in rural China (5,8); however, no study has focused on the trends and differences of SARS-CoV-2 infection by region among the general population in rural China during this period of widespread transmission. To address this knowledge gap, national and regional trends of SARS-CoV-2 infection in rural China among the general population were evaluated using data from the National Sentinel Community-Based Surveillance (NSCS) system during this critical period.
-
Data on SARS-CoV-2 infection were collected by the NSCS in China (5). Briefly, one county in each provincial-level administrative division (PLAD) was selected to represent the rural areas of the province, and at least 1,000 households (≥2,500 people) were sampled in the selected county. The minimum sampling unit was the household, and all selected households were included in the cohort (5). Each site conducted nucleic acid or antigen testing twice weekly in every household (a total of eight surveillance rounds) from December 16, 2022 to January 12, 2023 (5).
In this study, rural China was represented by counties sampled from 27 PLADs, excluding the 4 municipalities (Beijing, Tianjin, Shanghai, and Chongqing). Data from approximately 90,000 participants from the selected counties were used to describe the trends of SARS-CoV-2 infection in rural China from December 2022 to January 2023. We reported the SARS-CoV-2 infection in 27 PLADs in rural China, which were divided into North and South China by direction, and eastern, central, and western China by region.
-
SARS-CoV-2 infection was defined as testing positive for either SARS-CoV-2 nucleic acids or antigens (5). The percent of SARS-CoV-2 infection = the number of SARS-CoV-2 infections / the number of participants. The daily average newly positive rate of SARS-CoV-2 infection = the percent of SARS-CoV-2 infection in the surveillance round / the number of days in the surveillance round, which was used to reflect the average daily new infection levels in the surveillance populations during a specific surveillance round (5).
According to the daily average of newly positive rates, estimated daily percentage change (EDPC) was calculated to measure trends in SARS-CoV-2 infection over specified time intervals. A regression line was fitted to the natural logarithm of the daily average newly positive rate, with y = α+βx, where y is ln (the daily average newly positive rate) and x is the surveillance round. EDPC and its 95% confidence interval (CI) were calculated as 100 × (eβ− 1) to measure the incidence trends between different rounds. Trends of incidence were considered downward (or upward) when EDPC value and its 95% CIs were below (or above) zero. Data analysis was conducted using SPSS (version 27, IBM Corp., USA).
-
Approximately 90,000 participants in rural China were recruited into the community sentinel surveillance cohort of NSCS. The average daily rate of newly positive SARS-CoV-2 infections was 2.83%, 4.79%, 4.75%, 4.44%, 2.46%, 2.48%, 1.06%, and 0.57%, respectively, in rural China. The daily average newly positive rate in rural China increased from 2.83% in Round 1 (December 16–19, 2022) to the peak of 4.79% in Round 2 (December 20–22, 2022), then decreased by an average of 29.95% (95% CI: 18.28%–39.96%, P=0.002) per round from 4.79% in Round 2 (December 20–22, 2022) to 0.57% in Round 8 (January 10–12, 2023) (Table 1 and Figure 1A).
Rounds Number of people investigated (n) Number of newly positive (n) Daily average newly positive rate (%, 95% CI) Total Round 1 (December 16–19, 2022) 40,112 4,548 2.83 (2.67–3.00) Round 2 (December 20–22, 2022) 80,024 11,495 4.79 (4.64–4.94) Round 3 (December 23–26, 2022) 113,548 21,567 4.75 (4.62–4.87) Round 4 (December 27–29, 2022) 90,468 12,037 4.44 (4.30–4.57) Round 5 (December 30, 2022 to January 2, 2023) 89,392 8,782 2.46 (2.35–2.56) Round 6 (January 3–5, 2023) 83,454 6,214 2.48 (2.38–2.59) Round 7 (January 6–9, 2023) 93,252 3,969 1.06 (1.00–1.13) Round 8 (January 10–12, 2023) 91,792 1,560 0.57 (0.52–0.62) North Round 1 (December 16–19, 2022) 26,008 3,357 3.23 (3.01–3.44) Round 2 (December 20–22, 2022) 33,130 5,246 5.28 (5.04–5.52) Round 3 (December 23–26, 2022) 35,635 4,017 2.82 (2.65–2.99) Round 4 (December 27–29, 2022) 39,755 4,576 3.84 (3.65–4.03) Round 5 (December 30, 2022 to January 2, 2023) 42,168 4,390 2.60 (2.45–2.75) Round 6 (January 3–5, 2023) 37,486 2,621 2.33 (2.18–2.48) Round 7 (January 6–9, 2023) 42,586 1,618 0.95 (0.86–1.04) Round 8 (January 10–12, 2023) 42,586 627 0.49 (0.42–0.56) South Round 1 (December 16–19, 2022) 14,104 1,191 2.11 (1.87–2.35) Round 2 (December 20–22, 2022) 46,894 6,249 4.44 (4.26–4.63) Round 3 (December 23–26, 2022) 77,913 17,550 5.63 (5.47–5.79) Round 4 (December 27–29, 2022) 50,713 7,461 4.90 (4.72–5.09) Round 5 (December 30, 2022 to January 2, 2023) 47,224 4,392 2.33 (2.19–2.46) Round 6 (January 3–5, 2023) 45,968 3,593 2.61 (2.46–2.75) Round 7 (January 6–9, 2023) 50,666 2,351 1.16 (1.07–1.25) Round 8 (January 10–12, 2023) 49,206 933 0.63 (0.56–0.70) Note: North China included Hebei, Shanxi, Inner Mongolia, Liaoning, Jilin, Heilongjiang, Shandong, Henan, Shaanxi, Gansu, Qinghai, Ningxia, and Xinjiang. South China included Jiangsu, Zhejiang, Anhui, Fujian, Jiangxi, Hubei, Hunan, Guangdong, Guangxi, Hainan, Sichuan, Guizhou, Yunnan, and Xizang (Tibet).
Abbreviation: SARS-CoV-2=severe acute respiratory syndrome coronavirus 2; CI=confidence interval.Table 1. SARS-CoV-2 infection among the general population in rural China, December 2022 to January 2023.
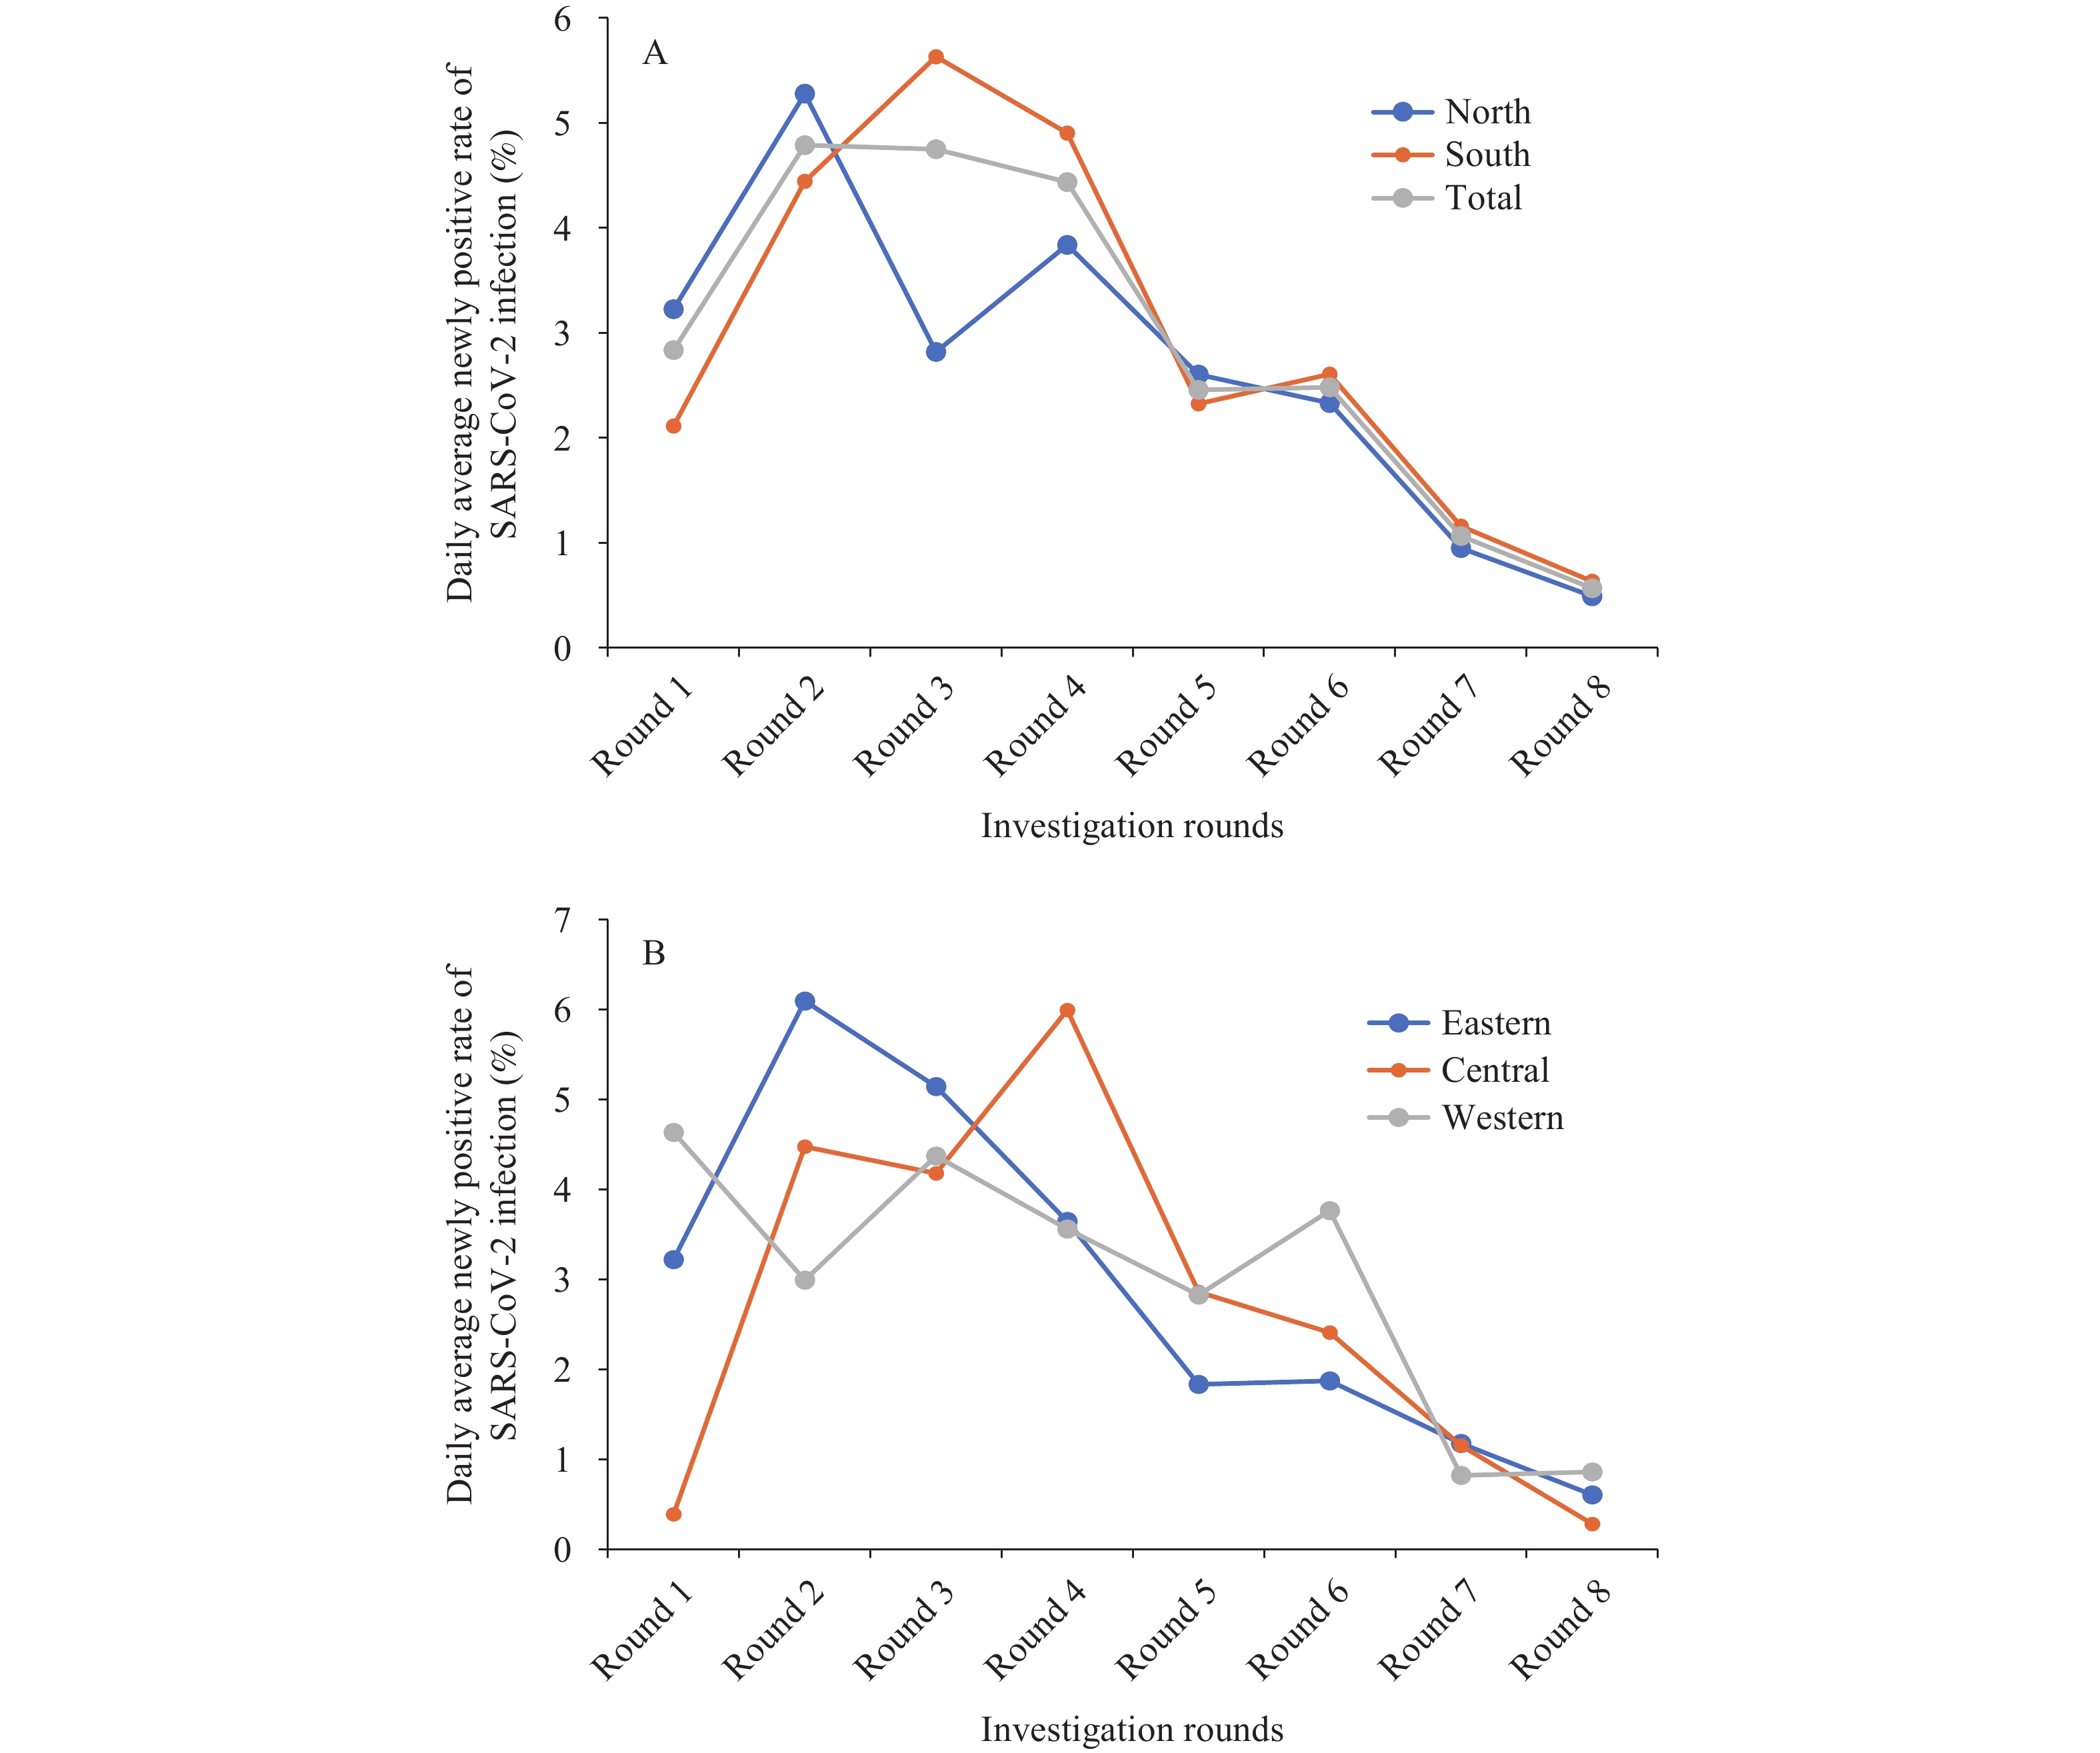 Figure 1.
Trends of SARS-CoV-2 infection among the general population in rural China, December 2022 to January 2023. (A) Trends of SARS-CoV-2 infection in total, North, and South China; (B) Trends of SARS-CoV-2 infection in eastern, central, and western China.
Note: Investigations in the study were conducted in eight rounds, from December 16, 2022 to January 12, 2023. Round 1 was conducted from December 16–19, 2022; Round 2 from December 20–22, 2022; Round 3 from December 23–26, 2022; Round 4 from December 27–29, 2022; Round 5 from December 30, 2022 to January 2, 2023; Round 6 from January 3–5, 2023; Round 7 from January 6–9, 2023; and Round 8 from January 10–12, 2023.
Abbreviation: SARS-CoV-2=severe acute respiratory syndrome coronavirus 2.
The peak of daily average newly positive rate occurred during Round 2 (December 20–22, 2022) in North China, with the highest observed in Gansu, Shandong, and Ningxia; while the peak occurred during Round 3 (December 23–26, 2022) in South China, with the highest in Hunan, Guangxi, and Zhejiang (Figure 1A). Subsequently, the daily average newly positive rate decreased by an average of 29.55% (95% CI: 15.86%–41.01%, P=0.004) per round from 5.28% in Round 2 (December 20–22, 2022) to 0.49% in Round 8 (January 10–12, 2023) in North China, which decreased more slowly than that in South China with an average decrease of 35.15% (95% CI: 23.55%–44.99%, P=0.002) per round from 5.63% in Round 3 (December 23–26, 2022) to 0.63% in Round 8 (January 10–12, 2023) (Table 1 and Figure 1A). The daily average newly positive rate converged between North and South China after Round 5 (December 30, 2022 to January 2, 2023).
Figure 1B and Table 2 illustrate the trends of SARS-CoV-2 infection in eastern, central, and western regions. The peak of daily average newly positive rate occurred during Round 2 (December 20–22, 2022) in eastern China, with the highest rates in Shandong, Zhejiang, and Hebei; while it occurred during Round 4 (December 27–29, 2022) in central China, with the highest rates in Hunan, Jiangxi, and Hubei. In eastern China, the daily average newly positive rate decreased by an average of 31.30% (95% CI: 25.15%–6.95%, P<0.001) per round from 6.09% in Round 2 (December 20–22, 2022) to 0.61% in Round 8 (January 10–12, 2023). In central China, it decreased by an average of 50.53% (95% CI: 27.54%–66.22%, P=0.010) per round from 5.99% in Round 4 (December 27–29, 2022) to 0.28% in Round 8 (January 10–12, 2023). In western China, the EDPC was -20.18% (95% CI: −32.94% to −4.99%, P=0.019) from Round 1 (December 16–19, 2022) to Round 8 (January 10–12, 2023).
Rounds Number of people investigated (n) Number of newly positive (n) Daily average newly positive rate (%, 95% CI) Eastern Round 1 (December 16–19, 2022) 11,926 1,536 3.22 (2.90–3.54) Round 2 (December 20–22, 2022) 34,638 6,333 6.09 (5.84–6.35) Round 3 (December 23–26, 2022) 62,204 12,796 5.14 (4.97–5.32) Round 4 (December 27–29, 2022) 34,451 3,766 3.64 (3.45–3.84) Round 5 (December 30, 2022 to January 2, 2023) 34,451 2,525 1.83 (1.69–1.97) Round 6 (January 3–5, 2023) 34,451 1,934 1.87 (1.73–2.01) Round 7 (January 6–9, 2023) 34,451 1,621 1.18 (1.06–1.29) Round 8 (January 10–12, 2023) 34,451 626 0.61 (0.52–0.69) Central Round 1 (December 16–19, 2022) 13,025 202 0.39 (0.28–0.49) Round 2 (December 20–22, 2022) 24,467 3,284 4.47 (4.22–4.73) Round 3 (December 23–26, 2022) 26,535 4,435 4.18 (3.94–4.42) Round 4 (December 27–29, 2022) 31,336 5,635 5.99 (5.73–6.26) Round 5 (December 30, 2022 to January 2, 2023) 31,147 3,566 2.86 (2.68–3.05) Round 6 (January 3–5, 2023) 30,791 2,224 2.41 (2.24–2.58) Round 7 (January 6–9, 2023) 31,492 1,451 1.15 (1.03–1.27) Round 8 (January 10–12, 2023) 31,499 267 0.28 (0.22–0.34) Western Round 1 (December 16–19, 2022) 15,161 2,810 4.63 (4.30–4.97) Round 2 (December 20–22, 2022) 20,919 1,878 2.99 (2.76–3.22) Round 3 (December 23–26, 2022) 24,809 4,336 4.37 (4.12–4.62) Round 4 (December 27–29, 2022) 24,681 2,636 3.56 (3.33–3.79) Round 5 (December 30, 2022 to January 2, 2023) 23,794 2,691 2.83 (2.62–3.04) Round 6 (January 3–5, 2023) 18,212 2,056 3.76 (3.49–4.04) Round 7 (January 6–9, 2023) 27,309 897 0.82 (0.71–0.93) Round 8 (January 10–12, 2023) 25,842 667 0.86 (0.75–0.97) Note: The eastern region included Hebei, Liaoning, Jiangsu, Zhejiang, Fujian, Shandong, Guangdong, and Hainan. The central region included Shanxi, Jilin, Heilongjiang, Anhui, Jiangxi, Henan, Hubei, and Hunan. The western region included Inner Mongolia, Guangxi, Sichuan, Guizhou, Yunnan, Xizang (Tibet), Shaanxi, Gansu, Qinghai, Ningxia, and Xinjiang.
Abbreviation: SARS-CoV-2=severe acute respiratory syndrome coronavirus 2; CI=confidence interval.Table 2. SARS-CoV-2 infection among the general population in rural China by region, December 2022 to January 2023.
At the provincial level, Figure 2 illustrates the daily average newly positive rate of SARS-CoV-2 infection in rural China during Round 8 (January 10–12, 2023). The highest rates were observed in Shanxi (3.21%) and Anhui (2.86%), while 15 of 27 PLADs in rural China had rates of less than 0.5%.
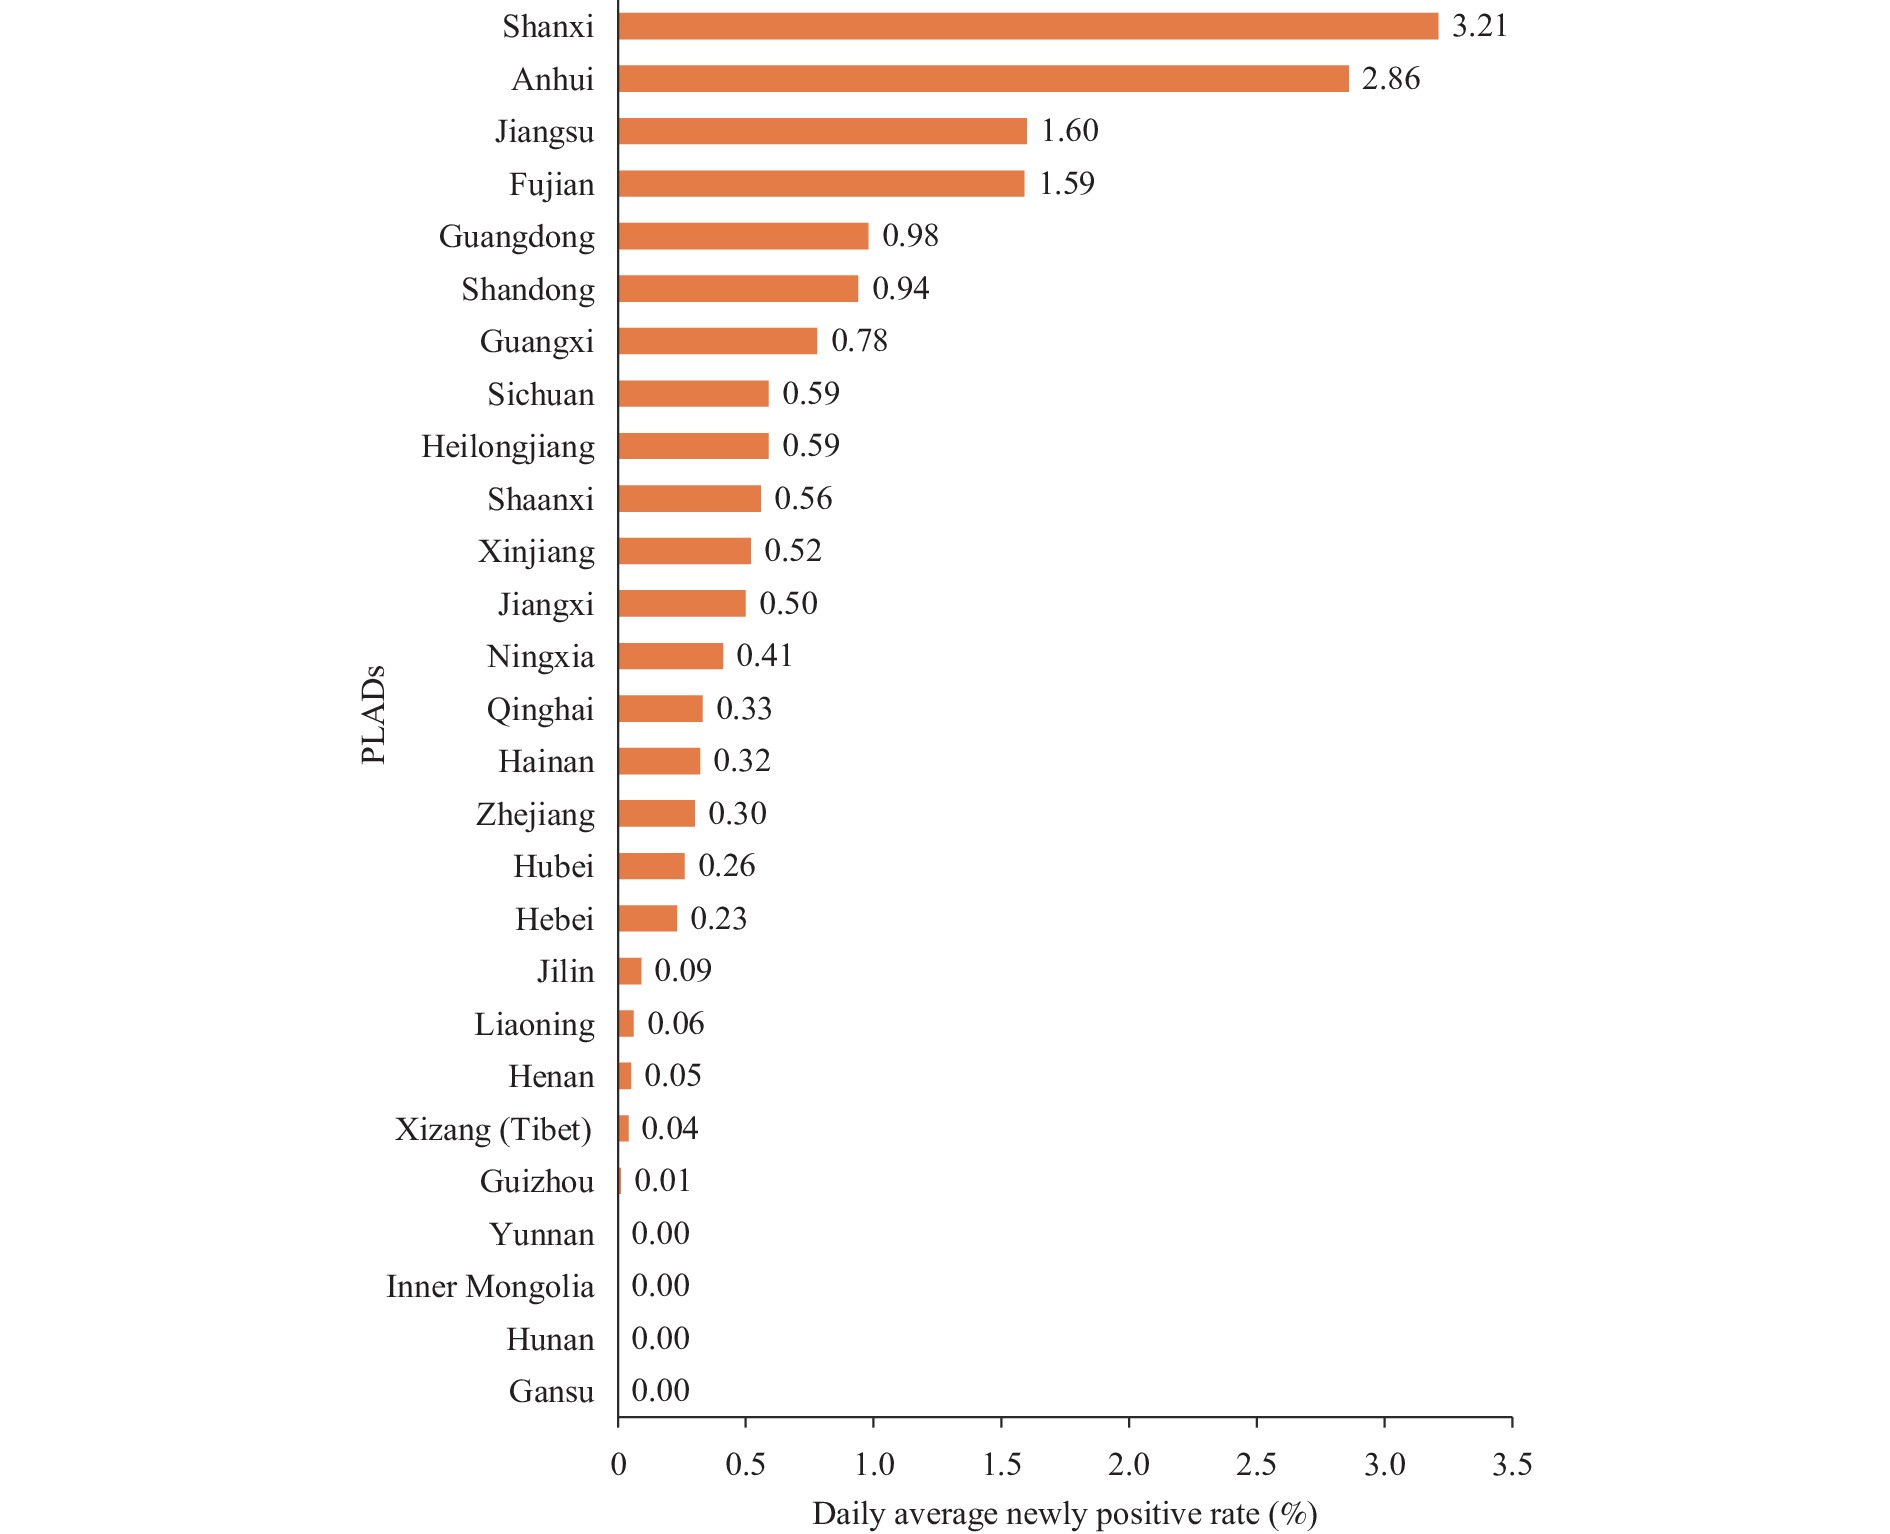 Figure 2.
The daily average of newly positive rates of severe acute respiratory syndrome coronavirus 2 (SARS-CoV-2) infection in rural China in Round 8 (January 10–12, 2023) by provincial-level administrative divisions (PLADs).
-
Our study was the first to focus on the trends and differences of SARS-CoV-2 infection by region among the general community-based population in rural China during the rapid transmission of Omicron variants. Our results indicated that, although there was a slight gap in the peak time of new infection rates among regions, the peak of the epidemic wave in rural China had passed over a short period following the optimization of prevention and control measures. From February 17–23, 2023, the daily average newly positive rate was approximately 2 per 100,000 population in rural China (unreported data). On February 23, 2023, the Chinese government declared that this epidemic wave was largely over and SARS-CoV-2 infection was sporadic (9).
Liu et al. (5) reported that the peak of new SARS-CoV-2 infections in China occurred between December 20–22, 2022, with a peak of 6.36%. Compared to the epidemic in urban China, the newly positive rates in rural China peaked at the same time, though the peak was lower than in urban areas (5). In the United States, the increase rate of cumulative COVID-19 cases peaked in early January 2021 and has since declined in both metro and nonmetro areas (10). Beginning in April 2021, the prevalence has been very similar in metro and nonmetro areas (10). In India, a nationwide survey found that 68% of 28,000 people had SARS-CoV-2 antibodies in June and July 2021, with little difference between the numbers in urban and rural regions (11).
In rural China, the population is aging and has higher medical needs, but health resources are relatively insufficient compared to those in urban China (7,12). On December 7, 2022, the Chinese government issued “Ten New Measures” and, on December 16, 2022, a work plan was published to emphasize the management of key populations, orderly channel the demand for medical treatment, and carry out classified and graded medical and health services to safeguard the health and lives of rural residents (7). To address the shortage of medicines and medical supplies in rural areas in January 2023, about 57.17 million health kits were distributed free of charge to key populations (13), 1.17 million finger-clamp oximeters were provided free of charge to 0.6 million village health offices, one oxygen machine was provided to each township hospital, and the rate of setting up fever clinics in township hospitals reached 99.1% (13-14). The implementation of these policies and distribution of medical supplies contributed to the rapid response against the COVID-19 epidemic in rural China, enabling the country to withstand the peak of the epidemic steadily (5).
The rapid transmission of Omicron variants throughout China prompted the Chinese government to rapidly implement the NSCS to monitor the changing situation of the epidemic among the general population since December 16, 2022. This study had several strengths. NSCS, which included a large community-based cohort of approximately 90,000 rural participants who were tested regularly, frequently, and periodically, effectively filled the current research and knowledge gap in rural areas, providing data and technical support to assess the dynamic infection level (5). Other systems lacked systematic surveillance and analysis of SARS-CoV-2 infection in rural areas during the same time (8). Additionally, NSCS has important reference significance for the subsequent prevention and control of infectious diseases in rural populations in China.
This study had several limitations. First, the aggregated data collected through the NSCS could not be analyzed in detail by individual sociodemographic characteristics or disease histories. Second, although the four municipalities had rural populations, this study divided its respondents into urban areas. Third, both population-proportional-to-size random sampling and convenience sampling were used in this emergency surveillance project, which may have led to sampling bias, lack of representation of the rural population, and conclusions that may not be generalizable to other populations (5).
In conclusion, sentinel surveillance data from community populations suggested that although there was a slight variation in the peak time of SARS-CoV-2 infection among regions, the epidemic wave in rural China peaked on December 20–22, 2022, and passed over a short period following the optimization of prevention and control measures. Currently, SARS-CoV-2 infection in community populations in rural China is sporadic.
-
No conflicts of interest.
-
the Surveillance and Alert Department of the National Bureau of Disease Control and Prevention, the Provincial Health Commission, the Provincial Center for Disease Control and Prevention, and the staff and participants from the 31 PLADs involved in the National Sentinel Community-Based Surveillance.
HTML
Study Design and Participant Characteristics
Statistical Analysis
| Citation: |

|