

 Download:


-
Since its emergence in late 2019, coronavirus disease 2019 (COVID-19) has been a global threat for over three years (1). After experiencing a large-scale epidemic in February 2020, China entered a normalization stage of prevention and control that began in May 2020 (1–2). During this normalization stage, comprehensive measures were taken to reduce the impact of COVID-19 on health, the economy, and society (2). With the high coverage of COVID-19 vaccines in China, accumulated experience in prevention and treatment, and the presence of the highly infectious but less virulent Omicron variants BA.5.2 and BF.7, “Ten New Measures” were implemented on December 7, 2022 to further optimize prevention and control measures of COVID-19. A recent modeling study estimated the transmission dynamics of severe acute respiratory syndrome coronavirus 2 (SARS-CoV-2) Omicron BF.7 in Beijing (3). However, no study has evaluated national and regional trends of SARS-CoV-2 infection among the general community-based population in late 2022 and early 2023 during the widespread transmission of Omicron variants BA.5.2 and BF.7 throughout China. To fill this knowledge gap, we evaluated national and regional trends of SARS-CoV-2 infection among the general population using a community sentinel surveillance system during December 2022 and January 2023 to provide SARS-CoV-2 infection data during this critical period.
-
Using aggregated data from the National Sentinel Community-Based Surveillance (NSCS) system in China, we assessed trends of SARS-CoV-2 infection. NSCS is a national community-based sentinel surveillance cohort with 0.42 million participants from all 31 provincial-level administrative divisions (PLADs) and Xinjiang Production and Construction Corps (XPCC). Multistage stratified cluster sampling was used to recruit participants. Each PLAD was required to select one provincial capital city, one other large city, and one county. At least 2,000 households (≥5,000 individuals) were sampled in each provincial capital city; at least 1,500 households (≥3,000 individuals) were sampled in each selected large city; and at least 1,000 households (≥2,500 individuals) were sampled in each selected county. The minimum sampling unit was the household, and all selected households were included in the cohort. Each site conducted nucleic acid or antigen testing twice a week in every household. Neighborhood committees (village committees) in each surveillance sentinel site were responsible for the implementation of the investigation and data reporting. The district CDC of each sentinel site was responsible for collecting information and reporting to other levels. All participants in the monitored communities were tested voluntarily for infection twice a week (a total of eight surveillance rounds) from December 16, 2022 to January 12, 2023.
SARS-CoV-2 infection was defined as testing positive for either SARS-CoV-2 nucleic acid or antigen (4). The daily average newly positive rate of SARS-CoV-2 infection and its 95% confidence interval (CI) (5) were used to reflect the average daily new infection levels in the community sentinel surveillance populations during a specific surveillance round. This rate was calculated as the percent of investigated people with positive SARS-CoV-2 nucleic acid or antigen tests in a specific surveillance round divided by the number of days in the surveillance round. From the daily average newly positive rates we calculated estimated daily percentage change (EDPC) between rounds, which is a widely used measure of trends in rates over specified time intervals (6). We fit regression lines to the natural logarithm of the positive rate as y=α+βx, where y is ln(incidence rate) and x is the surveillance round. EDPC reflected incidence trends between different rounds and was calculated as 100 × (eβ− 1); its 95% CI was calculated as [100 × (eβ lower bound − 1), 100 × (eβ upper bound − 1)]. P-values were calculated for hypothesis testing as t=β/SEβ, with degrees of freedom as the number of rounds minus 2. Trends of incidence were considered downward (or upward) when EDPC values were below (or above) zero. SAS (version 9.4, SAS Institute Inc., Cary, USA) and Office Excel (version 2010, Microsoft Corp., Redmond, WA., USA) were used to analyze and draw statistical figures.
-
A total of 419,984 people were recruited into the community sentinel surveillance cohort of NSCS. The average daily rate of newly positive SARS-CoV-2 infections decreased from 4.13% in Round 1 (December 16–19, 2022) to 0.69% in Round 8 (January 10–12, 2023), with an estimated daily percentage change of −26.1%.
The daily average newly positive rate of SARS-CoV-2 infection in the eight surveillance rounds was found to be statistically significant (P<0.05, Table 1). The rates were 4.13%, 6.36%, 5.18%, 3.96%, 2.43%, 1.87%, 0.97%, and 0.69%, respectively. The epidemic peak occurred during Round 2 (December 20–22, 2022).
Rounds (testing date range) Number of people investigated (n) Number of newly positive (n) Daily average newly positive rate (%, 95% CI) EDPC
(%, 95% CI)P-value Round 1 (December 16, 2022 to
December 19, 2022)139,351 23,019 4.13 (4.03–4.23) −26.1
(−34.8, −16.5)0.001 Round 2 (December 20, 2022 to
December 22, 2022)319,488 60,996 6.36 (6.28–6.44) Round 3 (December 23, 2022 to
December 26, 2022)405,364 83,912 5.18 (5.11–5.25) Round 4 (December 27, 2022 to
December 29, 2022)385,563 45,786 3.96 (3.90–4.02) Round 5 (December 30, 2022 to
January 2, 2023)403,471 39,272 2.43 (2.38–2.48) Round 6 (January 3, 2023 to
January 5, 2023)387,787 21,722 1.87 (1.83–1.91) Round 7 (January 6, 2023 to
January 9, 2023)419,984 16,259 0.97 (0.94–1.00) Round 8 (January 10, 2023 to
January 12, 2023)418,836 8,686 0.69 (0.66–0.72) Note: EDPC represents estimated daily percentage change from Round 1 to Round 8.
Abbreviation: SARS-CoV-2=severe acute respiratory syndrome coronavirus 2; CI=confidence interval; EDPC=estimated daily percentage change.Table 1. Trends of SARS-CoV-2 infection among the general population in sentinel community-based surveillance, China, December 2022–January 2023.
In urban areas, the daily average of newly positive SARS-CoV-2 infections decreased from 4.65% in Round 1 to 0.73% in Round 8, with an EDPC of −27.4% (P<0.05, Table 2). In rural areas, the daily average of newly positive cases decreased from 2.83% in Round 1 to 0.57% in Round 8, with an EDPC of −22.4% (P<0.05). Both the urban and rural positive rates peaked at Round 2, and the disparity between the two rates decreased as they both declined to less than 1% by Round 8 (Table 2 and Figure 1).
Rounds Number of people investigated (n) Number of newly positive (n) Daily average newly positive rate (%, 95% CI) EDPC
(%, 95% CI)P-value Urban areas Round 1 99,239 18,471 4.65 (4.52–4.78) −27.4
(−34.9, −18.9)<0.001 Round 2 239,464 49,501 6.89 (6.79–6.99) Round 3 291,816 62,345 5.34 (5.26–5.42) Round 4 295,095 33,749 3.81 (3.74–3.88) Round 5 314,079 30,490 2.43 (2.37–2.48) Round 6 304,333 15,508 1.70 (1.65–1.74) Round 7 326,732 12,290 0.94 (0.91–0.97) Round 8 327,044 7,126 0.73 (0.70–0.76) Rural areas Round 1 40,112 4,548 2.83 (2.67–3.00) −22.4
(−35.3, −6.9)0.014 Round 2 80,024 11,495 4.79 (4.64–4.94) Round 3 113,548 21,567 4.75 (4.62–4.87) Round 4 90,468 12,037 4.44 (4.30–4.57) Round 5 89,392 8,782 2.46 (2.35–2.56) Round 6 83,454 6,214 2.48 (2.38–2.59) Round 7 93,252 3,969 1.06 (1.00–1.13) Round 8 91,792 1,560 0.57 (0.52–0.62) Note: EDPC represents estimated daily percentage change from Round 1 to Round 8.
Abbreviation: SARS-CoV-2=severe acute respiratory syndrome coronavirus 2; CI=confidence interval; EDPC=estimated daily percentage change.Table 2. Trends of SARS-CoV-2 infection among the general population in sentinel community-based surveillance by location, China, December 2022–January 2023.
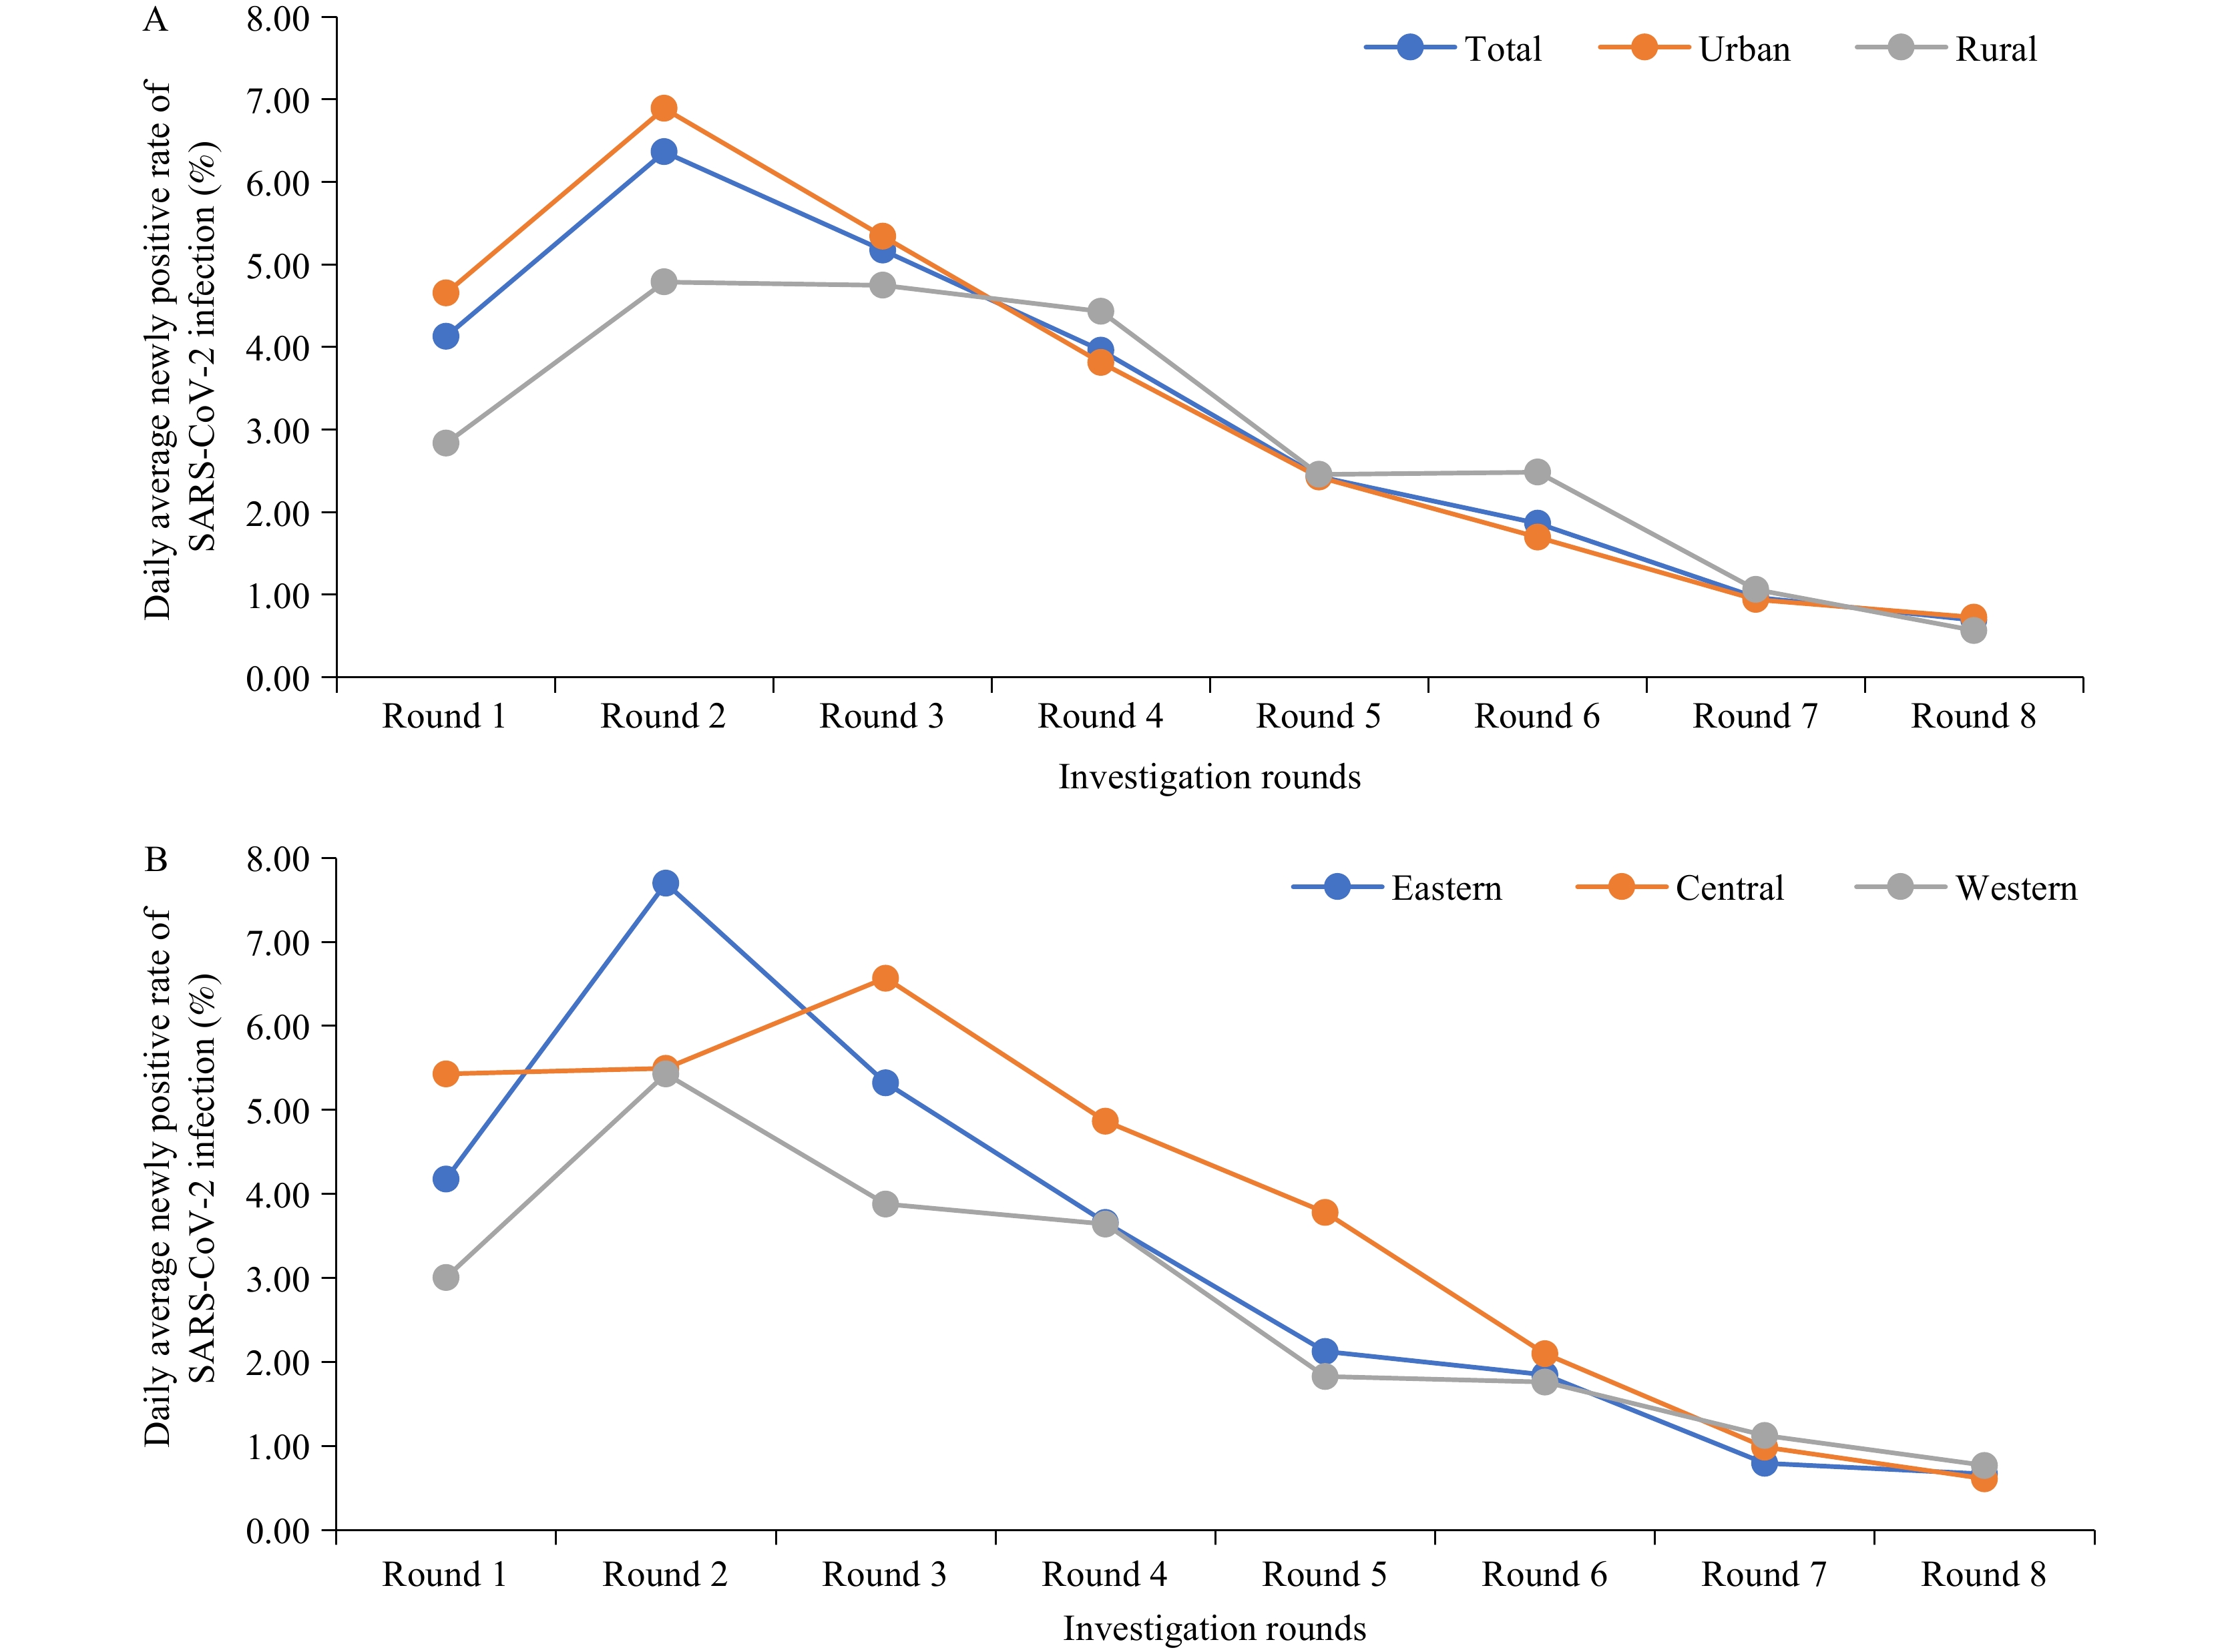 Figure 1.
Trends of SARS-CoV-2 infection in sentinel community-based surveillance, China, December 2022–January 2023. (A) Stratified by location; (B) Stratified by region.
Note: Investigations in the study were conducted in eight rounds, from December 16, 2022 to January 12, 2023. Round 1 was conducted from December 16–19, 2022; Round 2 from December 20–22, 2022; Round 3 from December 23–26, 2022; Round 4 from December 27–29, 2022; Round 5 from December 30, 2022 to January 2, 2023; Round 6 from January 3–5, 2023; Round 7 from January 6–9, 2023; and Round 8 from January 10–12, 2023.
Eastern region included Beijing, Tianjin, Hebei, Liaoning, Shanghai, Jiangsu, Zhejiang, Fujian, Shandong, Guangdong, and Hainan. Western region included Inner Mongolia, Guangxi, Chongqing, Sichuan, Guizhou, Yunnan, Tibet, Shaanxi, Gansu, Qinghai, Ningxia, Xinjiang, Xinjiang Production and Construction Corps. Central region included Shanxi, Jilin, Heilongjiang, Anhui, Jiangxi, Henan, Hubei, and Hunan.
Abbreviation: SARS-CoV-2=severe acute respiratory syndrome coronavirus 2.
Table 3 shows the epidemic trends of SARS-CoV-2 infection in the three regions. In eastern China, the daily average of newly positive cases of SARS-CoV-2 infection decreased from 4.18% in Round 1 to 0.67% in Round 8, with an EDPC of −28.3% (P<0.05). For central and western China, EDPCs were −28.0% (decreasing from 5.43% to 0.61%, P<0.05) and −21.6% (decreasing from 3.01% to 0.77%, P<0.05), respectively. The daily average of newly positive cases in eastern and western China both peaked during Round 2. As shown in Figure 1, the daily average of newly positive cases converged across regions after Round 6 (January 3–5, 2023), and disparities among regions decreased as all rates declined to 0.6%–0.7% by Round 8.
Rounds Number of people investigated (n) Number newly positive (n) Daily average newly positive rate (%, 95% CI) EDPC (%, 95% CI) P-value Eastern Round 1 39,817 6,654 4.18 (3.98–4.37) −28.3
(−37.4, −17.8)0.001 Round 2 128,620 29,724 7.70 (7.56–7.85) Round 3 192,046 40,904 5.32 (5.22–5.43) Round 4 145,503 16,003 3.67 (3.57–3.76) Round 5 150,416 12,806 2.13 (2.06–2.20) Round 6 153,315 8,496 1.85 (1.78–1.91) Round 7 158,143 5,051 0.80 (0.75–0.84) Round 8 157,516 3,154 0.67 (0.63–0.71) Central Round 1 45,272 9,841 5.43 (5.23–5.64) −28.0
(−38.2, −16.1)0.002 Round 2 81,351 13,425 5.50 (5.34–5.66) Round 3 91,777 24,138 6.58 (6.41–6.74) Round 4 96,699 14,120 4.87 (4.73–5.00) Round 5 101,841 15,402 3.78 (3.66–3.90) Round 6 81,908 5,162 2.10 (2.00–2.20) Round 7 107,850 4,266 0.99 (0.93–1.05) Round 8 106,788 1,958 0.61 (0.56–0.66) Western Round 1 54,262 6,524 3.01 (2.86–3.15) −21.6
(−30.6, −11.4)0.003 Round 2 109,517 17,847 5.43 (5.30–5.57) Round 3 121,541 18,870 3.88 (3.77–3.99) Round 4 143,361 15,663 3.64 (3.54–3.74) Round 5 151,214 11,064 1.83 (1.76–1.90) Round 6 152,564 8,064 1.76 (1.70–1.83) Round 7 153,991 6,942 1.13 (1.07–1.18) Round 8 154,532 3,574 0.77 (0.73–0.81) Note: EDPC represents estimated daily percentage change from Round 1 to Round 8; Eastern region included Beijing, Tianjin, Hebei, Liaoning, Shanghai, Jiangsu, Zhejiang, Fujian, Shandong, Guangdong, and Hainan. Western region included Inner Mongolia, Guangxi, Chongqing, Sichuan, Guizhou, Yunnan, Tibet, Shaanxi, Gansu, Qinghai, Ningxia, Xinjiang, Xinjiang Production and Construction Corps. Central region included Shanxi, Jilin, Heilongjiang, Anhui, Jiangxi, Henan, Hubei, and Hunan.
Abbreviation: SARS-CoV-2=severe acute respiratory syndrome coronavirus 2; CI=confidence interval; EDPC=estimated daily percentage change.Table 3. Trends of SARS-CoV-2 infection among the general population in sentinel community-based surveillance by region, China, December 2022–January 2023.
-
Our findings from a sentinel community-based infection surveillance system showed that new SARS-CoV-2 infections peaked at 6.36% between December 20–22, 2022 and then steadily decreased to 0.69% by January 10–12, 2023. Both urban and rural areas experienced a peak in infection rates during December 20–22, 2022, with the rural area peak being lower than the urban area peak. By January 10–12, 2023, both urban and rural infection rates had declined to nearly identical low levels. Our sentinel community-based surveillance results are consistent with national fever outpatient surveillance at the time of the epidemic peak (December 23, 2022), indicating that the epidemic wave in China had passed following the optimization of prevention and control measures.
The Omicron variant is less pathogenic and more transmissible than the ancestral strain and previous variants of concern, and we now have a deeper understanding of the virus, a broader selection of antiviral drugs, and more experience in the treatment of COVID-19 infection. In late 2022, The State Council Joint Prevention and Control Mechanism issued the “20 Measures (November 11, 2022)” and the “Ten New Measures (December 7, 2022)” to optimize the epidemic prevention and control plan, protect people’s safety and health to the greatest extent possible, and minimize the impact of the epidemic on economic and social development. These measures included deployments for strengthening medical resources, promoting vaccination, accelerating drug stockpiling, and strengthening the protection of key institutions and populations (7–8). These initiatives contributed to our rapid response against the COVID-19 epidemic and enabled us to withstand the peak of the epidemic and its quick decline. In rural areas, comprehensive mapping of key populations, implementing a system of responsibility to ensure prevention and control compliance, and issuing health kits and other measures (9) helped to mitigate the impact of the COVID-19 epidemic.
Given the presence of highly infectious Omicron variants BA.5.2 and BF.7, it was of utmost urgency to quickly and accurately assess infection rates and trends in community populations. Compared to other surveillance methods, the positive rate we observed in the NSCS was lower than seen in hospital-based sentinel surveillance during the same period. This difference may be attributed to the different surveillance methods and population characteristics. Hospital-based survey populations are clinic populations, in which people are seeking medical attention, possibly for SARS-CoV-2 infection, resulting in a higher positive rate than the general population in a community. As a national community-based sentinel surveillance cohort with nearly 420,000 participants from 31 PLADs and XPCC, NSCS has effectively filled the current research and knowledge gap, providing near-real-time data and technical support for assessing the epidemic situation and estimating medical treatment resource needs at the national, regional, and provincial levels. China has passed the peak of COVID-19 infection and is now at a low epidemic level. In the future, it will still be necessary to adjust prevention and control measures flexibly and actively respond to the dynamic situation to consolidate the current COVID-19 achievements.
This study has several strengths. First, a large sample size of households was selected from cities and counties of all 31 PLADs and XPCC. Second, NSCS conducted regular, frequent, and periodic testing of participants during a time that captured the peak of the epidemic in both rural and urban populations.
The study also has some limitations. First, due to this being an emergency surveillance project supported by the National Bureau of Disease Control and Prevention, the sampling methods varied by PLAD and included both population-proportional-to-size random sampling and convenience sampling. This, combined with the large sample size, allowed us to reflect the dynamic infection level of SARS-CoV-2 in the community population, but the conclusions may not be generalizable to other populations. Second, we analyzed aggregated NSCS data without individual-level data and therefore could not analyze the differences in the average daily incidence rate of SARS-CoV-2 infection among people with different characteristics (such as age, gender, and presence of underlying chronic diseases).
In conclusion, after optimizing prevention and control measures, sentinel surveillance data from community populations suggest that the peak of SARS-CoV-2 infection in China occurred in December 2022. Currently, SARS-CoV-2 infection in community populations across China is at a low level.
-
No conflicts of interest.
-
The Surveillance and Alert Department, National Bureau of Disease Control and Prevention, Provincial Health Commission, Provincial Center for Disease Prevention and Control, the staff and participants from the 31 PLADs and Xinjiang Construction Corps involved in the National Sentinel Community-Based Surveillance.
HTML
| Citation: |

|