

 Download:


-
High exposure to lead is associated with numerous adverse health outcomes, particularly impairment of neural development in children (1). Large-scale biomonitoring is necessary to quantify risk assessments in public health. The United States carries out the National Health and Nutrition Examination Surveys (NHANES) to monitor changes in environmental chemicals. Monitoring of blood lead levels (BLLs) in children led to action on the reduction of exposure from for example leaded gasoline and leaded paint (2). Following the recent BLL decline, the US CDC updated the blood lead reference value (BLRV) to 35 µg/L based on the latest two rounds of the NHANES and reported in Morbidity and Mortality Weekly Report (3). In China, the latest national recommendations for BLLs in children, issued in 2006, established a BLRV of 100 μg/L for hyperleademia (4). Recent studies indicated that BLLs in Chinese children have been declining over the past two decades (5). However, China does not have a suitable definition of elevated BLLs. To this end, the China CDC initiated the China National Human Biomonitoring (CNHBM) in 2017.
The distribution and temporal trends of BLLs during the past two decades in the Chinese population were from the data of a nationally representative study and two previous regional-scale surveys. The 2017/18 survey based on CNHBM, a nationally representative study for tracing the dynamic change of environmental chemicals, included 21,746 samples recruited from 152 counties in 31 provincial-level administrative divisions (PLADs) of China (
Supplementary Figure S1 ). Due to 45 participants without available BLLs information, 21,701 participants aged 3–79 years were included in this study. The CNHBM used an advanced computer-assisted personal interviewing (CAPI) online system to conduct a household interview and Epidata (version 3.2, EpiData Association, Odense, Denmark) for data entry and management, collecting the data of age, gender, residence, districts, and so on. Details of covariate definition are shown inSupplementary Methods . Details about the study design have been previously reported (6). Approval was obtained from National Institute of Environmental Health ethics committee, Chinese Center for Disease Control and Prevention (No.201701). All participants signed written informed consent. The 2000 survey included 6,085 children aged 3–5 years randomly selected from 19 cities (7). The 2009/10 survey a included 11,090 participants of the general population aged 6–59 years (8). In 2000, 2009/10, and 2017/18 surveys, venous blood specimens were collected in the morning after an overnight fast for all persons in the local community health centers, frozen, and shipped to China CDC (Beijing) for analysis. Inductively coupled plasma mass spectrometry (ICP-MS) was used to measure lead concentrations in blood samples in the three surveys (Supplementary Methods ). The lead measurement in the 2017/18 survey was finished in 2019. The BLLs in each of the three surveys were calibrated using standards prepared from lead nitrate Standard Reference Material obtained from the National Institute of Standards and Technology.Characteristics of participants in the 2017/18 survey were stratified by quartiles of BLLs. Geometric means and distributions of BLLs and the number of participants with elevated BLLs were calculated by incorporating the weights for the entire Chinese population. The spatial distribution of BLLs in the Chinese population was mapped. The 97.5th percentile of the BLLs in participants of all age groups from CNHBM was chosen as the BLRV (3). Description of the method adopted to estimate the disease burden for children aged 3–5 years and participants aged 6–59 years are presented in
Supplementary Methods , respectively. Analyses were done with SAS (version 9.4, SAS Institute Inc., Cary, USA), R (version 3.4.1, R Development Core Team, Vienna, Austria), and ArcGIS (version 3.6.1, Environmental Systems Research Institute Inc., California, USA). All P values were two-sided, and a P value of less than 0.05 was considered significant.The geometric mean of BLLs of all 21,701 participants aged 3–79 years in the 2017/18 survey was 20.66 μg/L, and the proportions of BLLs over 50 µg/L was 6.0% (Table 1). The spatial distribution of BLLs in the Chinese population in 2017/18 is shown in Figure 1. During the past two decades (2000–2018), the BLLs of children aged 3–5 years were down from 78.1 μg/L to 16.9 μg/L, dropping by 78.4%. For participants aged 6–59 years, the BLLs were 20.41 μg/L in 2017/18, down from 36.9 μg/L in 2009/10, dropping by 44.7%. The lead exposure-related burden of disease measured in DALYs showed clear downward trends over time (Table 2). Based on the BLLs in 2017/18, the BLRV for participants aged 3–5 years was updated to 50 μg/L considering the 97.5th percentile of the BLLs in this population (Table 1). Characteristics of participants in surveys are shown in
Supplementary Tables S1 –S2 .Supplementary Figure S2 compares the proportion of BLLs over 50 μg/L in participants from 2000 to 2018. More details of disease burden are shown inSupplementary Tables S3 –S4 .Sub group <LOD* (%) Geometric mean
(95% CI),
μg/LMedian
(95% CI), μg/LP90
(95% CI),
μg/LP95
(95% CI),
μg/LP97.5
(95% CI),
μg/LParticipants with BLLs ≥35 μg/L, n (%), million† Participants with BLLs ≥50 μg/L, n (%), million§ Participants with BLLs ≥100 μg/L, n (%), million¶ Total 0.27 20.66
(19.90–21.46)20.72
(20.03–21.42)42.82
(40.73–44.91)52.72
(50.03–55.41)65.80
(60.93–70.67)222.4 (16.7) 79.9 (6.0) 9.0 (0.7) Age (years) 3–5 0.36 16.87
(16.06–17.72)17.01
(16.33–17.68)33.87
(31.87–35.87)41.67
(38.32–45.02)50.95
(44.86–57.03)11.8 (8.7) 3.7 (2.7) 0.7 (0.5) 6–11 0.24 16.84
(16.12–17.59)17.01
(16.34–17.67)31.27
(29.49–33.04)38.65
(35.91–41.40)45.87
(42.46–49.29)11.6 (7.1) 3.0 (1.8) 0.1 (0.1) 12–18 0.36 15.21
(14.53–15.93)15.27
(14.71–15.83)29.30
(27.18–31.42)37.66
(33.73–41.59)46.28
(38.59–53.97)9.7 (6.1) 3.2 (2.0) 0.6 (0.3) 19–39 0.36 21.32
(20.33–22.36)21.65
(20.50–22.79)41.79
(39.12–44.45)51.15
(47.70–54.61)62.64
(55.65–69.63)47.9 (16.2) 15.2 (5.2) 1.2 (0.4) 40–59 0.30 24.78
(23.70–25.91)25.02
(23.90–26.14)49.47
(47.09–51.85)58.68
(54.54–62.81)71.33
(64.98–77.68)84.6 (25.2) 32.2 (9.6) 3.3 (1.0) 60–79 0.06 24.40
(23.32–25.52)23.70
(22.75–24.64)49.37
(45.49–53.26)63.92
(57.30–70.54)85.72
(78.31–93.14)56.8 (23.8) 22.6 (9.5) 3.1 (1.3) Sex Men 0.24 24.41
(23.37–25.50)24.43
(23.39–25.48)47.34
(44.72–49.96)57.34
(53.26–61.41)71.38
(65.29–77.47)154.1 (23.3) 54.5 (3.8) 5.2 (0.8) Women 0.28 17.51
(16.86–18.18)17.39
(16.90–17.89)35.37
(33.31–37.44)45.54
(42.46–48.62)57.44
(52.24–62.64)68.3 (10.2) 25.4 (8.2) 3.8 (0.6) Residence Urban 0.26 20.50
(19.46–21.59)20.70
(19.83–21.57)42.61
(39.87–45.35)52.25
(48.98–55.52)63.10
(55.88–70.33)132.8 (16.5) 46.6 (5.8) 5.0 (0.6) Rural 0.29 20.92
(19.78–22.11)20.81
(19.60–22.02)43.09
(39.84–46.34)53.35
(48.27–58.42)67.48
(61.25–73.71)89.6 (17.1) 33.3 (6.4) 4.0 (0.8) Districts North China 0.28 19.34
(18.21–20.54)19.45
(18.28–20.62)38.57
(34.24–42.90)49.10
(42.41–55.80)55.93
(46.99–64.88)25.8 (13.5) 8.3 (4.3) 1.0 (0.5) Northeast China 0.11 19.39
(17.40–21.61)18.93
(16.70–21.16)44.14
(36.97–51.30)56.15
(47.37–64.94)72.30
(48.78–95.83)18.2 (16.4) 7.3(7.1) 0.7 (0.6) East China 0.18 19.39
(17.90–21.00)20.03
(18.94–21.12)38.11
(35.36–40.86)45.53
(42.22–48.84)54.52
(49.59–59.45)55.2 (13.4) 13.8 (3.3) 1.4 (0.4) South-Central China 0.09 22.22
(20.34–24.28)21.63
(19.36–23.89)46.97
(41.79–52.14)56.06
(48.65–63.47)67.70
(56.18–79.22)65.0 (20.2) 26.3 (8.1) 2.5 (0.8) Southwest China 0.66 23.95
(21.95–26.14)23.69
(21.91–25.48)51.88
(45.02–58.74)70.76
(62.21–79.32)89.66
(78.16–101.15)40.7 (24.6) 18.8 (11.2) 3.1 (1.8) Northwest China 0.36 20.36
(18.70–22.15)20.30
(18.85–21.75)38.13
(32.54–43.72)47.78
(36.45–59.11)60.89
(41.25–80.53)17.5 (13.9) 5.4 (4.3) 0.3 (0.3) Abbreviation: LOD=limit of detection.
* The LOD of blood lead was 0.035 μg/L; <LOD (%) was the proportion below LOD.
† Participants with BLLs ≥35 μg/L, n (%) were calculated incorporating the sample weights.
§ Participants with BLLs ≥50 μg/L, n (%) were calculated incorporating the sample weights.
¶ Participants with BLLs ≥100 μg/L, n (%) were calculated incorporating the sample weights.Table 1. Blood lead levels (BLLs) in different age, gender, residence and districts among Chinese population in 2017/18.
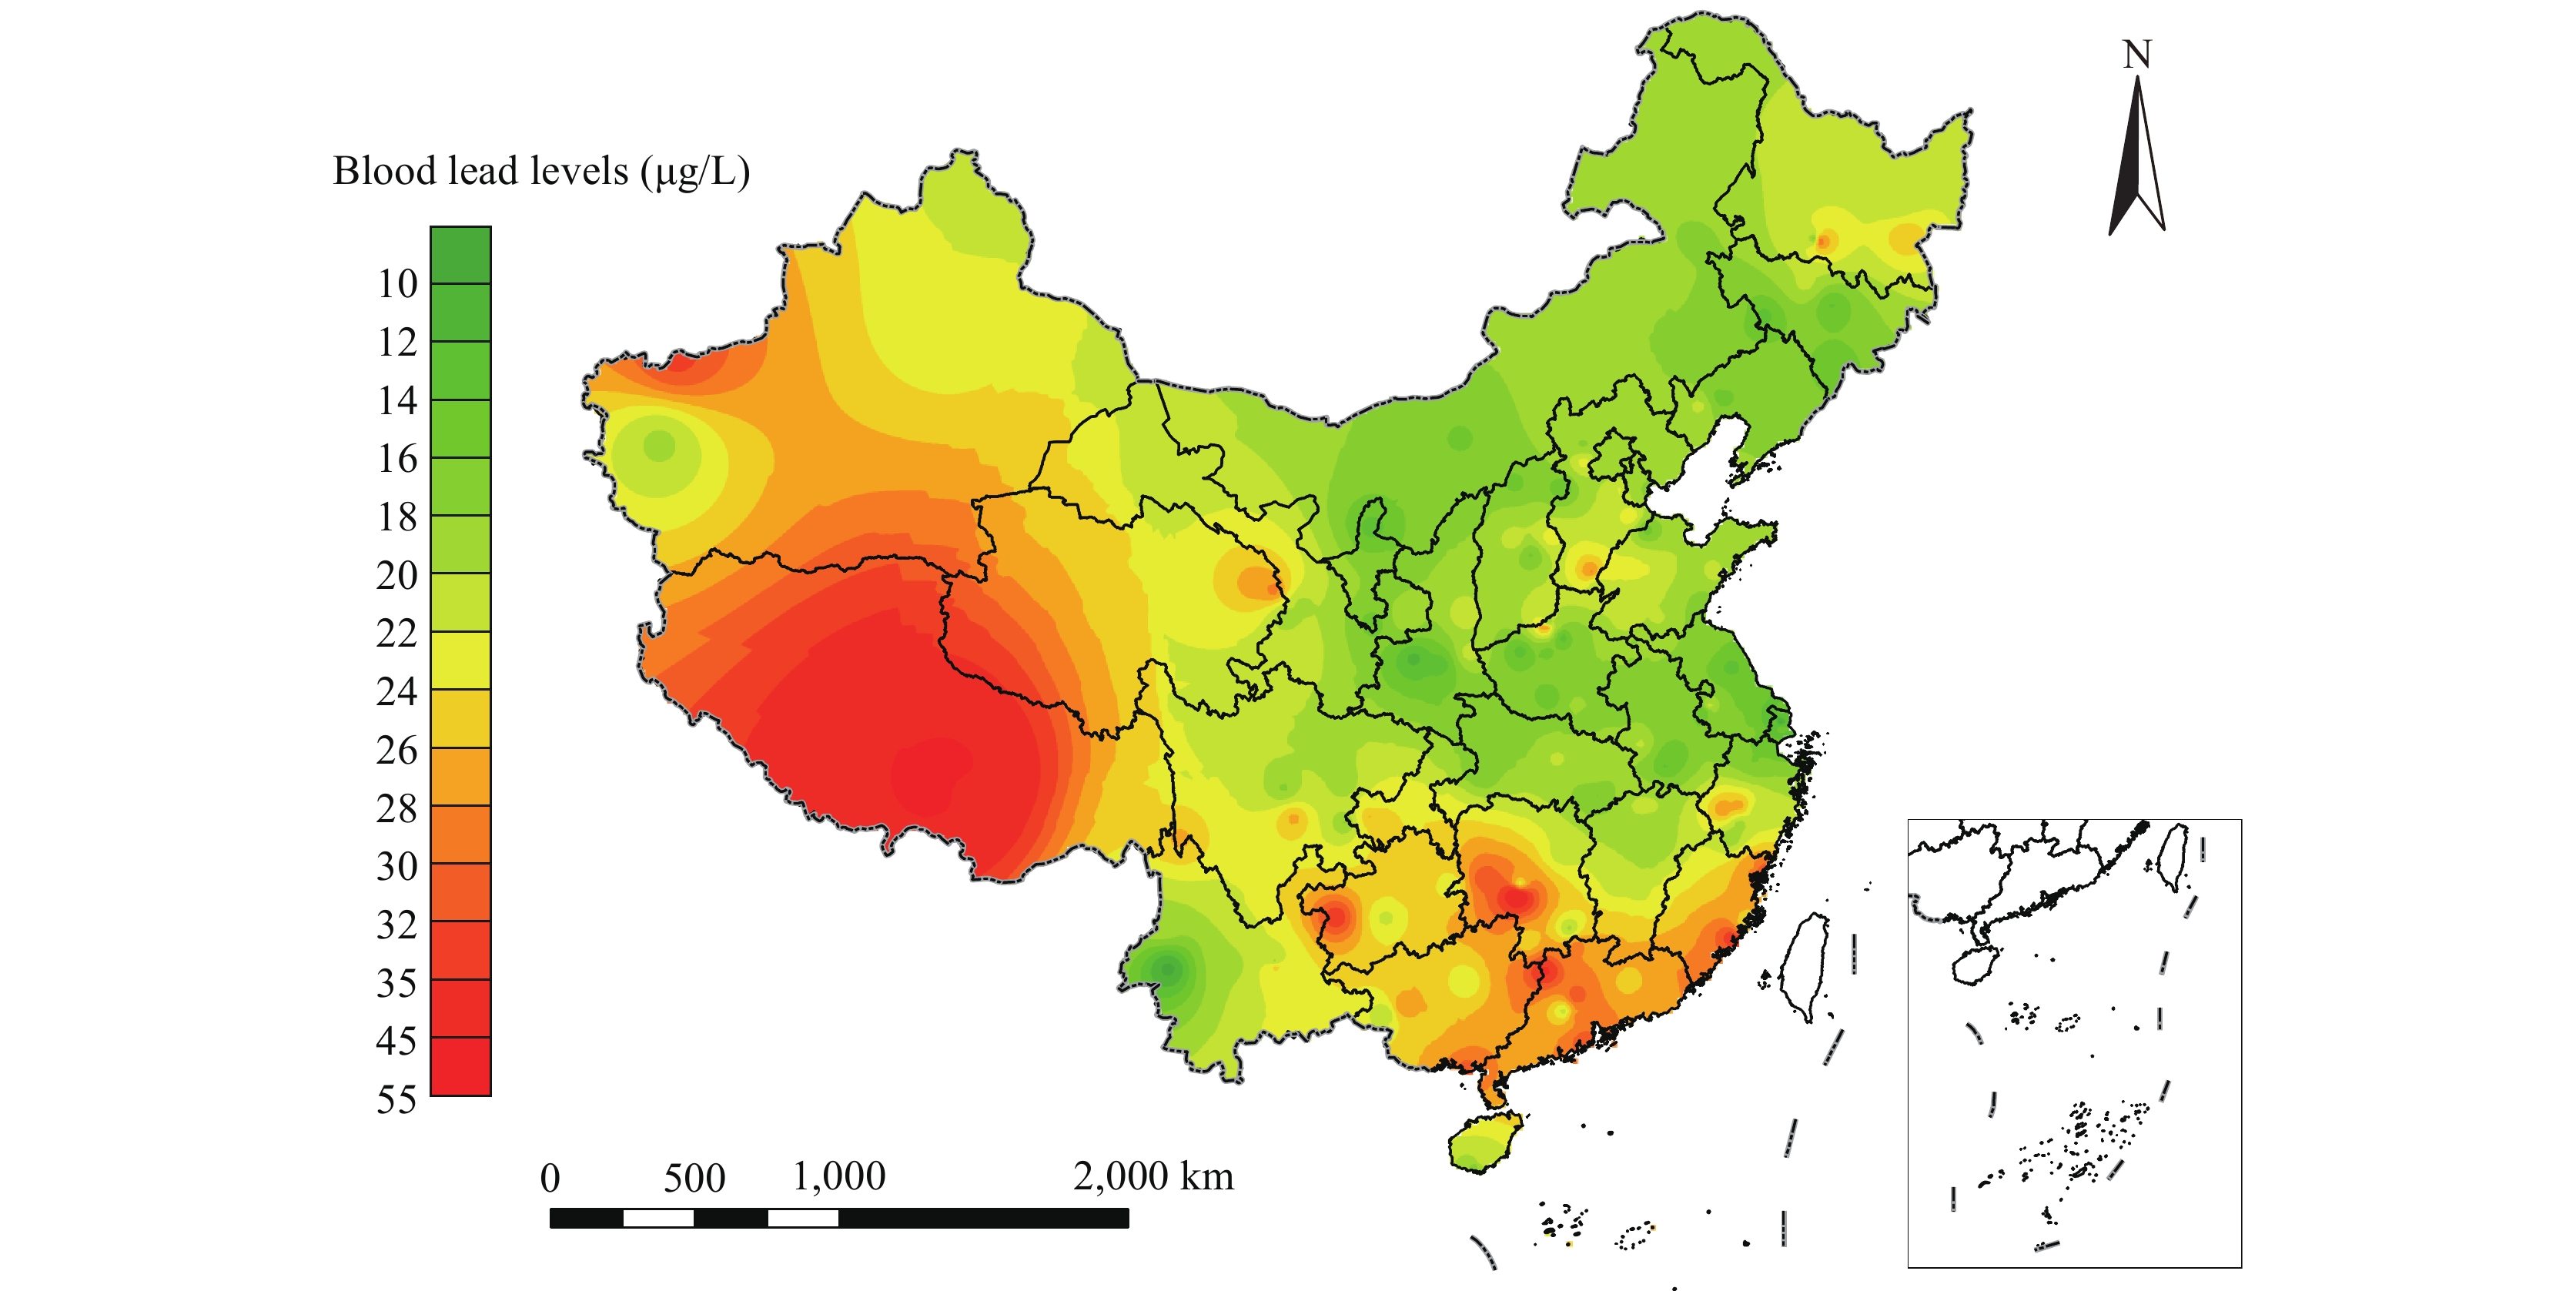 Figure 1.
The spatial distribution of blood lead levels in Chinese population aged 3 to 79 years in 2017–2018 (N=21,701).
Sub-population Year Geometric mean
(95% CI), μg/LBLLs ≥50 μg/L, % Rate of decline, % Disease burden, DALYs
(million person-years)Aged 3–5 years Total 78.4 2000 78.1 (77.0–79.0) 84.8 16.66 2017–2018 16.9 (16.1–17.7) 2.7 0.41 Sex Men 77.7 2000 80.0 (78.5–81.5) 88.3 8.83 2017–2018 17.8 (16.4–19.4) 2.6 0.21 Women 78.1 2000 75.9 (74.3–77.5) 81.2 7.83 2017–2018 16.6 (15.8–17.5) 2.7 0.20 Aged 6–59 years Total 44.7 2009–2010 36.9 (32.1–14.6) 29.8 9.33 2017–2018 20.4 (20.0–20.8) 4.9 6.46 Sex Men 43.1 2009–2010 44.3 (37.8–50.8) 34.6 6.65 2017–2018 24.2 (23.2–25.3) 7.7 4.95 Women 44.6 2009–2010 30.3 (24.6–36.0) 19.5 2.70 2017–2018 16.8 (16.1–17.4) 3.2 1.50 Age (years) 6–11 52.4 2009– 2010 35.3 (30.0–41.6) 23.7 0.21 2017–2018 16.8 (16.1–17.6) 1.8 0.12 12–18 54.4 2009–2010 33.3 (26.1–42.6) 22.5 0.47 2017–2018 15.2 (14.5–15.9) 2.0 0.25 19–39 40.5 2009–2010 35.8 (28.4–45.2) 28.9 1.90 2017–2018 21.3 (20.3–22.4) 5.2 1.23 40–59 37.5 2009–2010 39.6 (33.1–47.6) 32.5 6.74 2017–2018 24.8 (23.7–25.9) 9.6 4.71 Abbreviation: DALYs=disability-adjusted life years. Table 2. Declines in blood lead levels (BLLs) for Chinese population aged 3–59 years during the past two decades.
-
Our study found that both the BLLs among the Chinese population aged 3–5 years and 6–59 years exhibited decreases of varying degrees in the past two decades. Our study demonstrated that the decline in BLLs in the Chinese population was akin to the decline in the USA. After the implementation to eliminate leaded gasoline, which preceded the observed decline in BLLs. Leaded paint, while a major source of indoor exposure in the United States, was not widely used in the Chinese housing stock, and most residents reside in dwellings built after the banning of leaded paint. Therefore, the BLLs in Chinese residents were closely related to the levels of environmental lead exposure and the formulation of policies related to lead. However, compared with the latest monitoring results of developed countries such as the United States and Canada, the internal exposure to lead in Chinese population was still at a relatively higher level, indicating a higher disease burden and limiting intellectual quotient attainment of children on a population scale (9–10). It has been observed that BLLs in Tibet are higher than in other regions, which may be due to this population’s unique dietary and living habits.
The BLRV is 100 μg/L in China at present, higher than the American standard (35 μg/L) (3) and the World Health Organization (WHO) standard (50 μg/L) (11), and therefore needs updates based on our measurements in the decline of BLLs over the past two decades. However, setting standards is complicated by various literature using inconsistent criteria for BLRV definition. In this study, we established reference values based on blood lead concentrations stratified according to age. Although a lower BLRV increases the burden on the medical system, especially in pediatrics, we cannot deny that a more stringent BLRV would identify at-risk populations as much as possible and give caregivers, communities, and officials more opportunities to act earlier. Measures to improve lead exposure monitoring and prevention interventions for high-risk populations are priorities for future work. Government agencies, employers, and worker-affiliated organizations are responsible for carrying out education in the workplace and community in accordance with the latest guidelines and recommendations.
The strengths of this study include the CNHBM data obtained by the official organization, which firstly permits the characterization of BLLs in a nationally representative sample of the general Chinese population aged 3–79 years. We updated the BLRV based on the current blood lead levels from the results of the nationally representative study with the largest sample size and scope so far. Our study conducted a longitudinal comparison of BLLs among Chinese population through three surveys, focusing on the general population rather than specific groups such as those with high occupational exposure.
This study was subject to some limitations. First, surveys in 2000 and 2009/10 were only regional-scale, though being the largest study of BLLs monitoring in China at the time, and the study samples only covered part of the age group, limiting the comparison of the changing trend of BLLs. Second, our study involved three different cross-sectional studies, with the result that different people were sampled with iterations of the study, so that determination of within-individual temporal trends in BLLs cannot be obtained.
The study demonstrated a substantial decline in BLLs and the disease burden of the entire Chinese population in the past two decades, which provided evidence that China has made significant achievements in controlling lead pollution. Furthermore, there is an urgent need to update a lower BLRV based on the significant reductions in current blood lead levels that are more sensitive to monitor and screen people with high BLLs with significant public health value for prevention of hazards of lead exposure. The study added needed evidence on behalf of populous developing countries. There is no known safe blood lead concentration, and even as BLL declines, governments and public health institutions need to protect future generations if continued efforts to preemptively control or even eliminate lead sources and provide timely interventions for persons at the highest risk for exposure.
HTML
| Citation: |

|