Advanced Search

Preplanned Studies: Current State and Challenges of Rehabilitation Needs Among Elderly — China, 1990–2019

View author affiliations
  • Summary

    What is already known about this topic?

    Rehabilitation is an essential part of achieving health for all, whereas the estimates of rehabilitation needs, especially for elderly individuals in China, are not clear.

    What is added by this report?

    Compared with 1990, the prevalence and years of life lived with disability for health conditions in need of rehabilitation in China increased by 71.3% and 77.0% in 2019, respectively, at a rate much higher than the global average.

    What are the implications for public health practices?

    This study mainly presents scientific data and a systematic analysis of the current state and challenges of rehabilitation needs for elderly individuals (aged 60 and above) in China based on the World Health Organization Rehabilitation Need Estimator.

  • loading...
  • No conflicts of interest.
  • Funding: Supported by Chinese Academy of Engineering (No. 2021-XY-15), National Natural Science Fundation of China (No. L2124021), CAMS Innovation Fund for Medical Sciences (No. 2021-I2M-5-003) and Haihe Laboratory of Cell Ecosystem Innovation Fund (No. HH22KYZX0047)
  • [1] Cieza A. Rehabilitation the health strategy of the 21st century, really? Arch Phys Med Rehabil 2019;100(11):2212-4. http://dx.doi.org/10.1016/j.apmr.2019.05.019.http://dx.doi.org/10.1016/j.apmr.2019.05.019
    [2] Chen H, Cheng ML, Zhuang Y, Broad JB. Multimorbidity among middle-aged and older persons in urban China: prevalence, characteristics and health service utilization. Geriatr Gerontol Int 2018;18(10):1447 − 52. http://dx.doi.org/10.1111/ggi.13510CrossRef
    [3] Zhang R, Lu Y, Shi LY, Zhang SL, Chang F. Prevalence and patterns of multimorbidity among the elderly in China: a cross-sectional study using national survey data. BMJ Open 2019;9(8):e024268. https://bmjopen.bmj.com/content/9/8/e024268.https://bmjopen.bmj.com/content/9/8/e024268
    [4] GBD 2019 Diseases and Injuries Collaborators. Global burden of 369 diseases and injuries in 204 countries and territories, 1990-2019: a systematic analysis for the global burden of disease study 2019. Lancet 2020;396(10258):1204 − 22. http://dx.doi.org/10.1016/S0140-6736(20)30925-9CrossRef
    [5] Cieza A, Causey K, Kamenov K, Hanson SW, Chatterji S, Vos T. Global estimates of the need for rehabilitation based on the global burden of disease study 2019: a systematic analysis for the global burden of disease study 2019. Lancet 2020;-2021;396(10267):2006 − 17. http://dx.doi.org/10.1016/S0140-6736(20)32340-0CrossRef
    [6] Institute for Health Metrics and Evaluation. WHO rehabilitation need estimator. 2021. https://www.healthdata.org/data-visualization/who-rehabilitation-need-estimator. [2022-8-31].https://www.healthdata.org/data-visualization/who-rehabilitation-need-estimator
    [7] GBD 2017 Disease and Injury Incidence and Prevalence Collaborators. Global, regional, and national incidence, prevalence, and years lived with disability for 354 diseases and injuries for 195 countries and territories, 1990-2017: a systematic analysis for the global burden of disease study 2017. Lancet 2018;392(10159):1789 − 858. http://dx.doi.org/10.1016/S0140-6736(18)32279-7CrossRef
  • FIGURE 1.  Disease categories of conditions that would benefit from rehabilitation in China by age group, 2019.

    Abbreviation: YLDs=years of life lived with disability.

    FIGURE 2.  The rate of YLDs of health conditions by age group in China and worldwide, 2019.

    Abbreviation: YLDs=years of life lived with disability.

    TABLE S1.  The prevalence and YLDs of health conditions in need of rehabilitation, China, 1990–2019.

    Health conditionPrevalenceYLDs
    All ages (millions)Age-standardized rate
    (per 1,000)
    All ages (millions)Age-standardized rate
    (per 1,000)
    19902019Change (%)19902019Change (%)19902019Change (%)19902019Change (%)
    Overall total268.4
    (257.3–281.8)
    460.0
    (442.6–478.6)
    71.3260.0
    (249.9–271.4)
    253.5
    (244.3–264.0)
    −2.535.7
    (26.6–45.6)
    63.1
    (47.3–80.2)
    77.036.3
    (27.3–46.0)
    35.2
    (26.6–44.6)
    −3.0
    Musculoskeletal disorders
    Total186.0
    (173.7–199.2)
    322.1
    (301.7–343.0)
    73.2179.7
    (168.0–191.4)
    172.3
    (162.1–183.2)
    −4.117.6
    (12.5–23.3)
    28.1
    (19.9–38.5)
    59.517.1
    (12.3–22.7)
    15.0
    (10.7–20.3)
    −12.3
    Low back pain75.3
    (66.0–85.1)
    91.3
    (80.5–104.1)
    21.372.5
    (63.9–81.7)
    51.3
    (45.5–57.9)
    −29.18.6
    (6.0–11.4)
    10.3
    (7.3–14.0)
    20.88.2
    (5.8–10.9)
    5.8
    (4.1–7.8)
    −29.0
    Neck pain37.9
    (29.9–48.6)
    68.0
    (53.7–87.2)
    79.635.3
    (28.0–44.9)
    35.7
    (28.7–45.2)
    1.23.8
    (2.5–5.6)
    6.8
    (4.4–9.8)
    78.13.5
    (2.3–5.2)
    3.6
    (2.3–5.2)
    1.5
    Fractures27.8
    (25.6–30.0)
    65.5
    (61.0–69.9)
    135.928.2
    (26.2–30.3)
    35.1
    (32.8–37.4)
    24.81.7
    (1.2–2.4)
    3.8
    (2.5–5.4)
    121.41.7
    (1.2–2.4)
    2.0
    (1.4–2.9)
    18.5
    Other injuries22.6
    (20.5–25.5)
    40.1
    (36.4–45.0)
    77.320.9
    (19.0–23.5)
    22.2
    (20.1–25.1)
    6.30.78
    (0.55–1.1)
    1.1
    (0.70–1.6)
    38.90.71
    (0.50–0.97)
    0.60
    (0.39–0.90)
    −14.9
    Osteoarthritis33.2
    (26.2–40.8)
    85.9
    (67.6–105.3)
    158.537.9
    (29.8–46.3)
    41.0
    (32.4–50.1)
    8.21.8
    (0.90–3.6)
    4.7
    (2.3–9.5)
    159.72.1
    (1.0–4.1)
    2.2
    (1.1–4.5)
    8.9
    Amputation14.2
    (13.0–15.5)
    27.2
    (25.2–29.5)
    91.413.3
    (12.3–14.5)
    15.0
    (14.0–16.3)
    12.80.65
    (0.47–0.87)
    0.78
    (0.52–1.12)
    19.10.64
    (0.47–0.84)
    0.43
    (0.28–0.61)
    −33.1
    Rheumatoid arthritis1.5
    (1.3–1.6)
    3.1
    (2.8–3.5)
    114.21.5
    (1.3–1.7)
    1.6
    (1.4–1.7)
    5.20.27
    (0.19–0.36)
    0.57
    (0.39–0.77)
    112.50.27
    (0.19–0.37)
    0.29
    (0.20–0.39)
    5.8
    Neurological disorders
    Total20.6
    (19.4–21.8)
    57.3
    (53.5–61.4)
    178.823.6
    (22.1–25.2)
    32.6
    (30.4–35.0)
    38.04.7
    (3.4–5.9)
    12.4
    (8.9–15.9)
    166.75.2
    (3.8–6.6)
    7.1
    (5.1–9.0)
    35.0
    Cerebral palsy2.9
    (2.4–3.5)
    8.4
    (7.0–10.5)
    193.42.3
    (2.0–2.8)
    6.3
    (5.2–7.8)
    170.50.63
    (0.42–0.87)
    1.8
    (1.2–2.5)
    184.30.50
    (0.34–0.70)
    1.3
    (0.89–1.9)
    163.6
    Stroke10.0
    (9.0–11.0)
    25.0
    (22.1–28.1)
    149.911.2
    (10.1–12.5)
    12.9
    (11.5–14.4)
    15.02.4
    (1.7–3.1)
    6.1
    (4.3–7.8)
    152.22.7
    (1.9–3.5)
    3.1
    (2.2–4.1)
    15.9
    Traumatic brain injury2.2
    (2.1–2.3)
    6.5
    (6.2–7.0)
    199.32.1
    (2.0–2.3)
    3.4
    (3.2–3.7)
    60.60.31
    (0.22–0.42)
    0.93
    (0.65–1.3)
    199.10.30
    (0.21–0.41)
    0.49
    (0.34–0.66)
    62.2
    Alzheimer’s disease and dementia3.3
    (2.8–3.9)
    13.2
    (11.0–15.3)
    292.66.1
    (5.2–7.1)
    7.9
    (6.6–9.1)
    29.20.46
    (0.33–0.63)
    1.9
    (1.3–2.5)
    302.40.88
    (0.62–1.2)
    1.1
    (0.80–1.5)
    29.0
    Spinal cord injury2.1
    (2.0–2.3)
    5.1
    (4.8–5.5)
    138.22.0
    (1.8–2.1)
    2.7
    (2.6–2.9)
    38.70.73
    (0.52–0.93)
    1.4
    (1.0–1.8)
    87.80.66
    (0.47–0.84)
    0.74
    (0.52–1.0)
    11.4
    Parkinson’s disease0.37
    (0.29–0.44)
    1.3
    (1.1–1.6)
    260.00.50
    (0.40–0.60)
    0.67
    (0.55–0.82)
    35.80.11
    (0.07–0.16)
    0.40
    (0.26–0.55)
    258.30.15
    (0.10–0.21)
    0.20
    (0.13–0.28)
    36.5
    Multiple sclerosis0.017
    (0.013–0.021)
    0.033
    (0.025–0.041)
    97.00.014
    (0.011–0.018)
    0.018
    (0.014–0.023)
    23.30.006
    (0.004–0.009)
    0.012
    (0.008–0.017)
    97.00.005
    (0.003–0.008)
    0.007
    (0.004–0.009)
    23.3
    Motor-neuron disease0.025
    (0.020–0.031)
    0.036
    (0.029–0.044)
    42.70.021
    (0.017–0.026)
    0.024
    (0.020–0.029)
    14.30.006
    (0.004–0.009)
    0.009
    (0.006–0.012)
    42.70.005
    (0.004–0.007)
    0.006
    (0.004–0.008)
    14.3
    Guillain‒Barré syndrome0.005
    (0.004–0.007)
    0.008
    (0.006–0.010)
    45.00.005
    (0.003–0.006)
    0.005
    (0.004–0.007)
    11.30.002
    (0.001–0.002)
    0.002
    (0.001–0.003)
    45.00.001
    (0.001–0.002)
    0.002
    (0.001–0.002)
    11.3
    Sensory impairments
    Total72.7
    (67.0–79.0)
    142.0
    (130.5–153.3)
    95.380.9
    (75.3–86.8)
    78.1
    (72.3–83.8)
    −3.55.3
    (3.6–7.3)
    9.5
    (6.6–13.0)
    78.46.0
    (4.1–8.1)
    5.4
    (3.7–7.4)
    −9.4
    Hearing loss50.5
    (44.2–56.7)
    95.2
    (83.7–107.5)
    88.356.7
    (50.6–62.8)
    52.2
    (46.4–57.9)
    −8.13.4
    (2.3–4.8)
    5.7
    (3.8–7.9)
    65.93.7
    (2.5–5.1)
    3.3
    (2.2–4.6)
    −10.5
    Vision loss26.8
    (24.6–29.4)
    59.3
    (53.5–65.6)
    121.031.8
    (29.1–34.6)
    33.1
    (30.2–36.2)
    4.11.9
    (1.3–2.6)
    3.8
    (2.7–5.3)
    100.82.3
    (1.6–3.1)
    2.1
    (1.5–2.9)
    −7.5
    Mental disorders
    Total20.4
    (16.5–24.5)
    25.4
    (22.2–29.0)
    24.516.9
    (13.6–20.3)
    18.0
    (15.6–20.6)
    6.53.8
    (2.9–4.8)
    5.5
    (4.2–6.9)
    44.63.2
    (2.4–4.0)
    3.5
    (2.6–4.4)
    9.8
    Developmental
    Intellectual disability
    12.7
    (8.8–16.7)
    15.1
    (12.1–18.4)
    19.110.4
    (7.2–13.7)
    11.3
    (9.0–13.8)
    8.40.85
    (0.52–1.3)
    1.2
    (0.80–1.7)
    42.70.70
    (0.43–1.0)
    0.91
    (0.59–1.3)
    30.8
    Schizophrenia3.6
    (3.1–4.0)
    5.5
    (4.9–6.1)
    54.83.0
    (2.7–3.4)
    3.1
    (2.7–3.5)
    3.12.3
    (1.7–2.9)
    3.6
    (2.6–4.4)
    53.92.0
    (1.4–2.4)
    2.0
    (1.5–2.5)
    3.8
    Autism spectrum
    disorders
    4.3
    (3.5–5.2)
    5.0
    (4.1–6.0)
    15.63.6
    (2.9–4.3)
    3.7
    (3.1–4.5)
    4.10.66
    (0.43–1.0)
    0.76
    (0.50–1.1)
    14.50.55
    (0.36–0.81)
    0.57
    (0.37–0.84)
    4.4
    Chronic respiratory diseases
    Total14.7
    (12.8–16.6)
    23.6
    (20.0–27.4)
    60.717.3
    (14.9–19.6)
    12.6
    (10.6–14.5)
    −27.42.8
    (2.3–3.2)
    4.5
    (3.7–5.3)
    61.73.3
    (2.7–3.8)
    2.4
    (2.0–2.8)
    −27.2
    Chronic obstructive pulmonary disease14.7
    (12.8–16.6)
    23.6
    (20.0–27.4)
    60.717.3
    (14.9–19.6)
    12.6
    (10.6–14.5)
    −27.42.8
    (2.3–3.2)
    4.5
    (3.7–5.3)
    61.73.3
    (2.7–3.8)
    2.4
    (2.0–2.8)
    −27.2
    Cardiovascular diseases
    Total4.5
    (3.6–5.6)
    11.9
    (9.6–14.7)
    163.36.9
    (5.6–8.5)
    6.6
    (5.4–8.1)
    −4.10.51
    (0.34–0.76)
    1.4
    (0.88–2.0)
    163.80.78
    (0.51–1.1)
    0.75
    (0.49–1.1)
    −3.4
    Heart failure4.4
    (3.6–5.5)
    11.7
    (9.4–14.6)
    163.26.8
    (5.5–8.4)
    6.5
    (5.3–8.0)
    −4.30.51
    (0.33–0.75)
    1.3
    (0.87–2.0)
    163.80.77
    (0.50–1.1)
    0.74
    (0.48–1.1)
    −3.5
    Acute myocardial infarction0.068
    (0.060–0.077)
    0.19
    (0.16–0.21)
    172.40.092
    (0.081–0.103)
    0.10
    (0.09–0.12)
    11.60.006
    (0.004–0.009)
    0.017
    (0.012–0.024)
    167.20.008
    (0.006–0.012)
    0.009
    (0.007–0.013)
    10.5
    Neoplasms
    Total0.87
    (0.77–0.98)
    3.5
    (3.0–4.0)
    300.10.95
    (0.85–1.1)
    1.7
    (1.5–2.0)
    82.30.12
    (0.08–0.16)
    0.45
    (0.31–0.63)
    282.40.12
    (0.09–0.17)
    0.23
    (0.16–0.32)
    85.3
    Cancer0.87
    (0.77–0.98)
    3.5
    (3.0–4.0)
    300.10.95
    (0.85–1.1)
    1.7
    (1.5–2.0)
    82.30.12
    (0.08–0.16)
    0.45
    (0.31–0.63)
    282.40.12
    (0.09–0.17)
    0.23
    (0.16–0.32)
    85.3
    Note: change stands for percentage change from 1990–2019. Numbers in parentheses represent 95% uncertainty interval.
    Abbreviation: YLDs=years of life lived with disability.
    Download: CSV

Citation:

通讯作者: 陈斌, bchen63@163.com
  • 1. 

    沈阳化工大学材料科学与工程学院 沈阳 110142

  1. 本站搜索
  2. 百度学术搜索
  3. 万方数据库搜索
  4. CNKI搜索
Turn off MathJax
Article Contents

Article Metrics

Article views(5600) PDF downloads(26) Cited by()

Share

Related

Current State and Challenges of Rehabilitation Needs Among Elderly — China, 1990–2019

View author affiliations

Summary

What is already known about this topic?

Rehabilitation is an essential part of achieving health for all, whereas the estimates of rehabilitation needs, especially for elderly individuals in China, are not clear.

What is added by this report?

Compared with 1990, the prevalence and years of life lived with disability for health conditions in need of rehabilitation in China increased by 71.3% and 77.0% in 2019, respectively, at a rate much higher than the global average.

What are the implications for public health practices?

This study mainly presents scientific data and a systematic analysis of the current state and challenges of rehabilitation needs for elderly individuals (aged 60 and above) in China based on the World Health Organization Rehabilitation Need Estimator.

  • 1. Department of Cardiology and Institute of Vascular Medicine, Peking University Third Hospital, NHC Key Laboratory of Cardiovascular Molecular Biology and Regulatory Peptides, Key Laboratory of Molecular Cardiovascular Science, Ministry of Education, Beijing Key Laboratory of Cardiovascular Receptors Research, Research Unit of Medical Science Research Management/Basic and Clinical Research of Metabolic Cardiovascular Diseases, Chinese Academy of Medical Sciences, Haihe Laboratory of Cell Ecosystem, Beijing, China
  • 2. Personnel Department, Peking University Third Hospital, Beijing, China
  • 3. Office of Academic Research, Peking University Third Hospital, Beijing, China
  • 4. Research Center of Population Health and Social Development, University of Health and Rehabilitation Sciences/Soft Science Research Base of Public Policy on Population Health in Shandong Province, Qingdao City, Shandong Province, China
  • 5. National Institute of Health Data Science, Peking University, Beijing, China
  • 6. School of Population Medicine and Public Health, Chinese Academy of Medical Sciences/Peking Union Medical College, Beijing, China
  • 7. APEC Health Science Academy, Peking University, Beijing, China
  • 8. Institute of Cardiovascular Sciences, Peking University, Beijing, China
  • Corresponding authors:

    Jian Du, dujian@bjmu.edu.cn

    Xiaoying Zheng, zhengxiaoying@sph.pumc.edu.cn

    Erdan Dong, donged@bjmu.edu.cn

  • Funding: Supported by Chinese Academy of Engineering (No. 2021-XY-15), National Natural Science Fundation of China (No. L2124021), CAMS Innovation Fund for Medical Sciences (No. 2021-I2M-5-003) and Haihe Laboratory of Cell Ecosystem Innovation Fund (No. HH22KYZX0047)
  • Online Date: September 30 2022
    Issue Date: September 30 2022
    doi: 10.46234/ccdcw2022.180
  • Rehabilitation is an essential part of achieving health for all, but a disability-specific service needed by only a small proportion of the population. Recovery from functional impairment is the primary goal of rehabilitation, including experiencing limitations in everyday physical, mental, and social functioning due to aging or a health condition (1). China has an even worse situation than most countries due to its large, rapidly aging population. It is estimated that the number of older adults with multiple diseases and impairment in their functional ability is 46% and 38%, respectively (2-3). As the population ages and the proportion of people living with noncommunicable diseases and the consequences of injuries are increasing (4-5), however, comprehensive estimates of rehabilitation needs, especially for elderly individuals in China, are not clear. A study in Lancet provided a global estimate of the need for rehabilitation of 25 health conditions that would benefit from rehabilitation (5). Therefore, this study aimed to provide quantitative evidence for the current state of Chinese elderly rehabilitation needs. Based on the data from the World Health Organization (WHO) Rehabilitation Need Estimator (6), an overview of the current rehabilitation needs in China from 1990 to 2019 was presented.

    All data for the estimates of the need for rehabilitation in this study are accessible via online data visualization and download tools following the WHO Rehabilitation Need Estimator, which estimated rehabilitation needs by presenting the prevalence and years of life lived with disability (YLDs) of 25 health conditions in need of rehabilitation from 1990 to 2019 by age, sex, year, and location, based on the global burden of disease study 2019. The WHO Rehabilitation Need Estimator estimated the prevalence primarily using data from systematically reviewed studies and survey data on the prevalence of various conditions. YLDs were obtained by multiplying the prevalence by corresponding disability weights and correcting for comorbidity. Focusing on Chinese population data, we obtained the prevalence and YLDs of 25 health conditions related to rehabilitation in 1990 and 2019 by age for this study. First, we examined the rehabilitation needs for each health condition by presenting the prevalence and YLDs of all ages or their age-standardized rates. Standard population age structure is generated by Global Burden of Disease Study 2017 (7). Each percentage change was calculated for the relative difference in prevalence or YLDs mean value between 1990 and 2019. Second, we analyzed the rehabilitation needs presented by the rate of YLDs with aging. Third, we explored the characteristics for rehabilitation needs of different health conditions in China compared to those in the global population, which was classified into 3 age groups (under 15, 15–59, and 60 and above).

    In 2019, a total of 460 million (95% uncertainty interval 442.6 to 478.6) individuals had conditions that would benefit from rehabilitation, contributing to 63.0 million (47.3 to 80.2) YLDs in China (Supplementary Table S1). Compared with 1990, the prevalence and YLDs for health conditions in need of rehabilitation increased by 71.3% and 77.0% in 2019, respectively, at a rate much higher than the global average. Meanwhile, there has been a modest decrease in the age-standardized rate of prevalence and YLDs since 1990. This result suggested that the increased rehabilitation needs were mainly driven by the aging of the population. Furthermore, the prevalence was highest for hearing loss (affecting 95 million people) in 2019, and cancer has grown at the fastest rate (300.1%) since 1990. In terms of YLDs, the number of people suffering from low back pain was the highest (10.3 million YLDs), and Alzheimer’s disease and dementia grew the fastest (302.4%) during the past 30 years. This could possibly be associated with better diagnostic technology, a longer life expectancy, and their higher prevalence in elderly people.

    A visual representation of the YLDs rate disease categories of conditions by age groups is shown in Figure 1. There is a significant increase in the burden of diseases that could require rehabilitation as the population ages. Different age populations also have different characteristics of rehabilitation needs. In children under 15 years old, cerebral palsy and developmental intellectual disability are the principal contributors to disability. Musculoskeletal disorders, such as low back pain and neck pain, account for 54% of the YLD rate in those 15 to 59 years old, which is the main labor force. In seniors aged 60 and above, the proportions of cerebrovascular diseases, sensory impairments, chronic respiratory diseases, and cardiovascular diseases increased gradually. With a longer life expectancy, the incidence of chronic diseases, disabilities, and functional impairment is increasing dramatically, posing new challenges to our society’s health care system and healthcare resources.
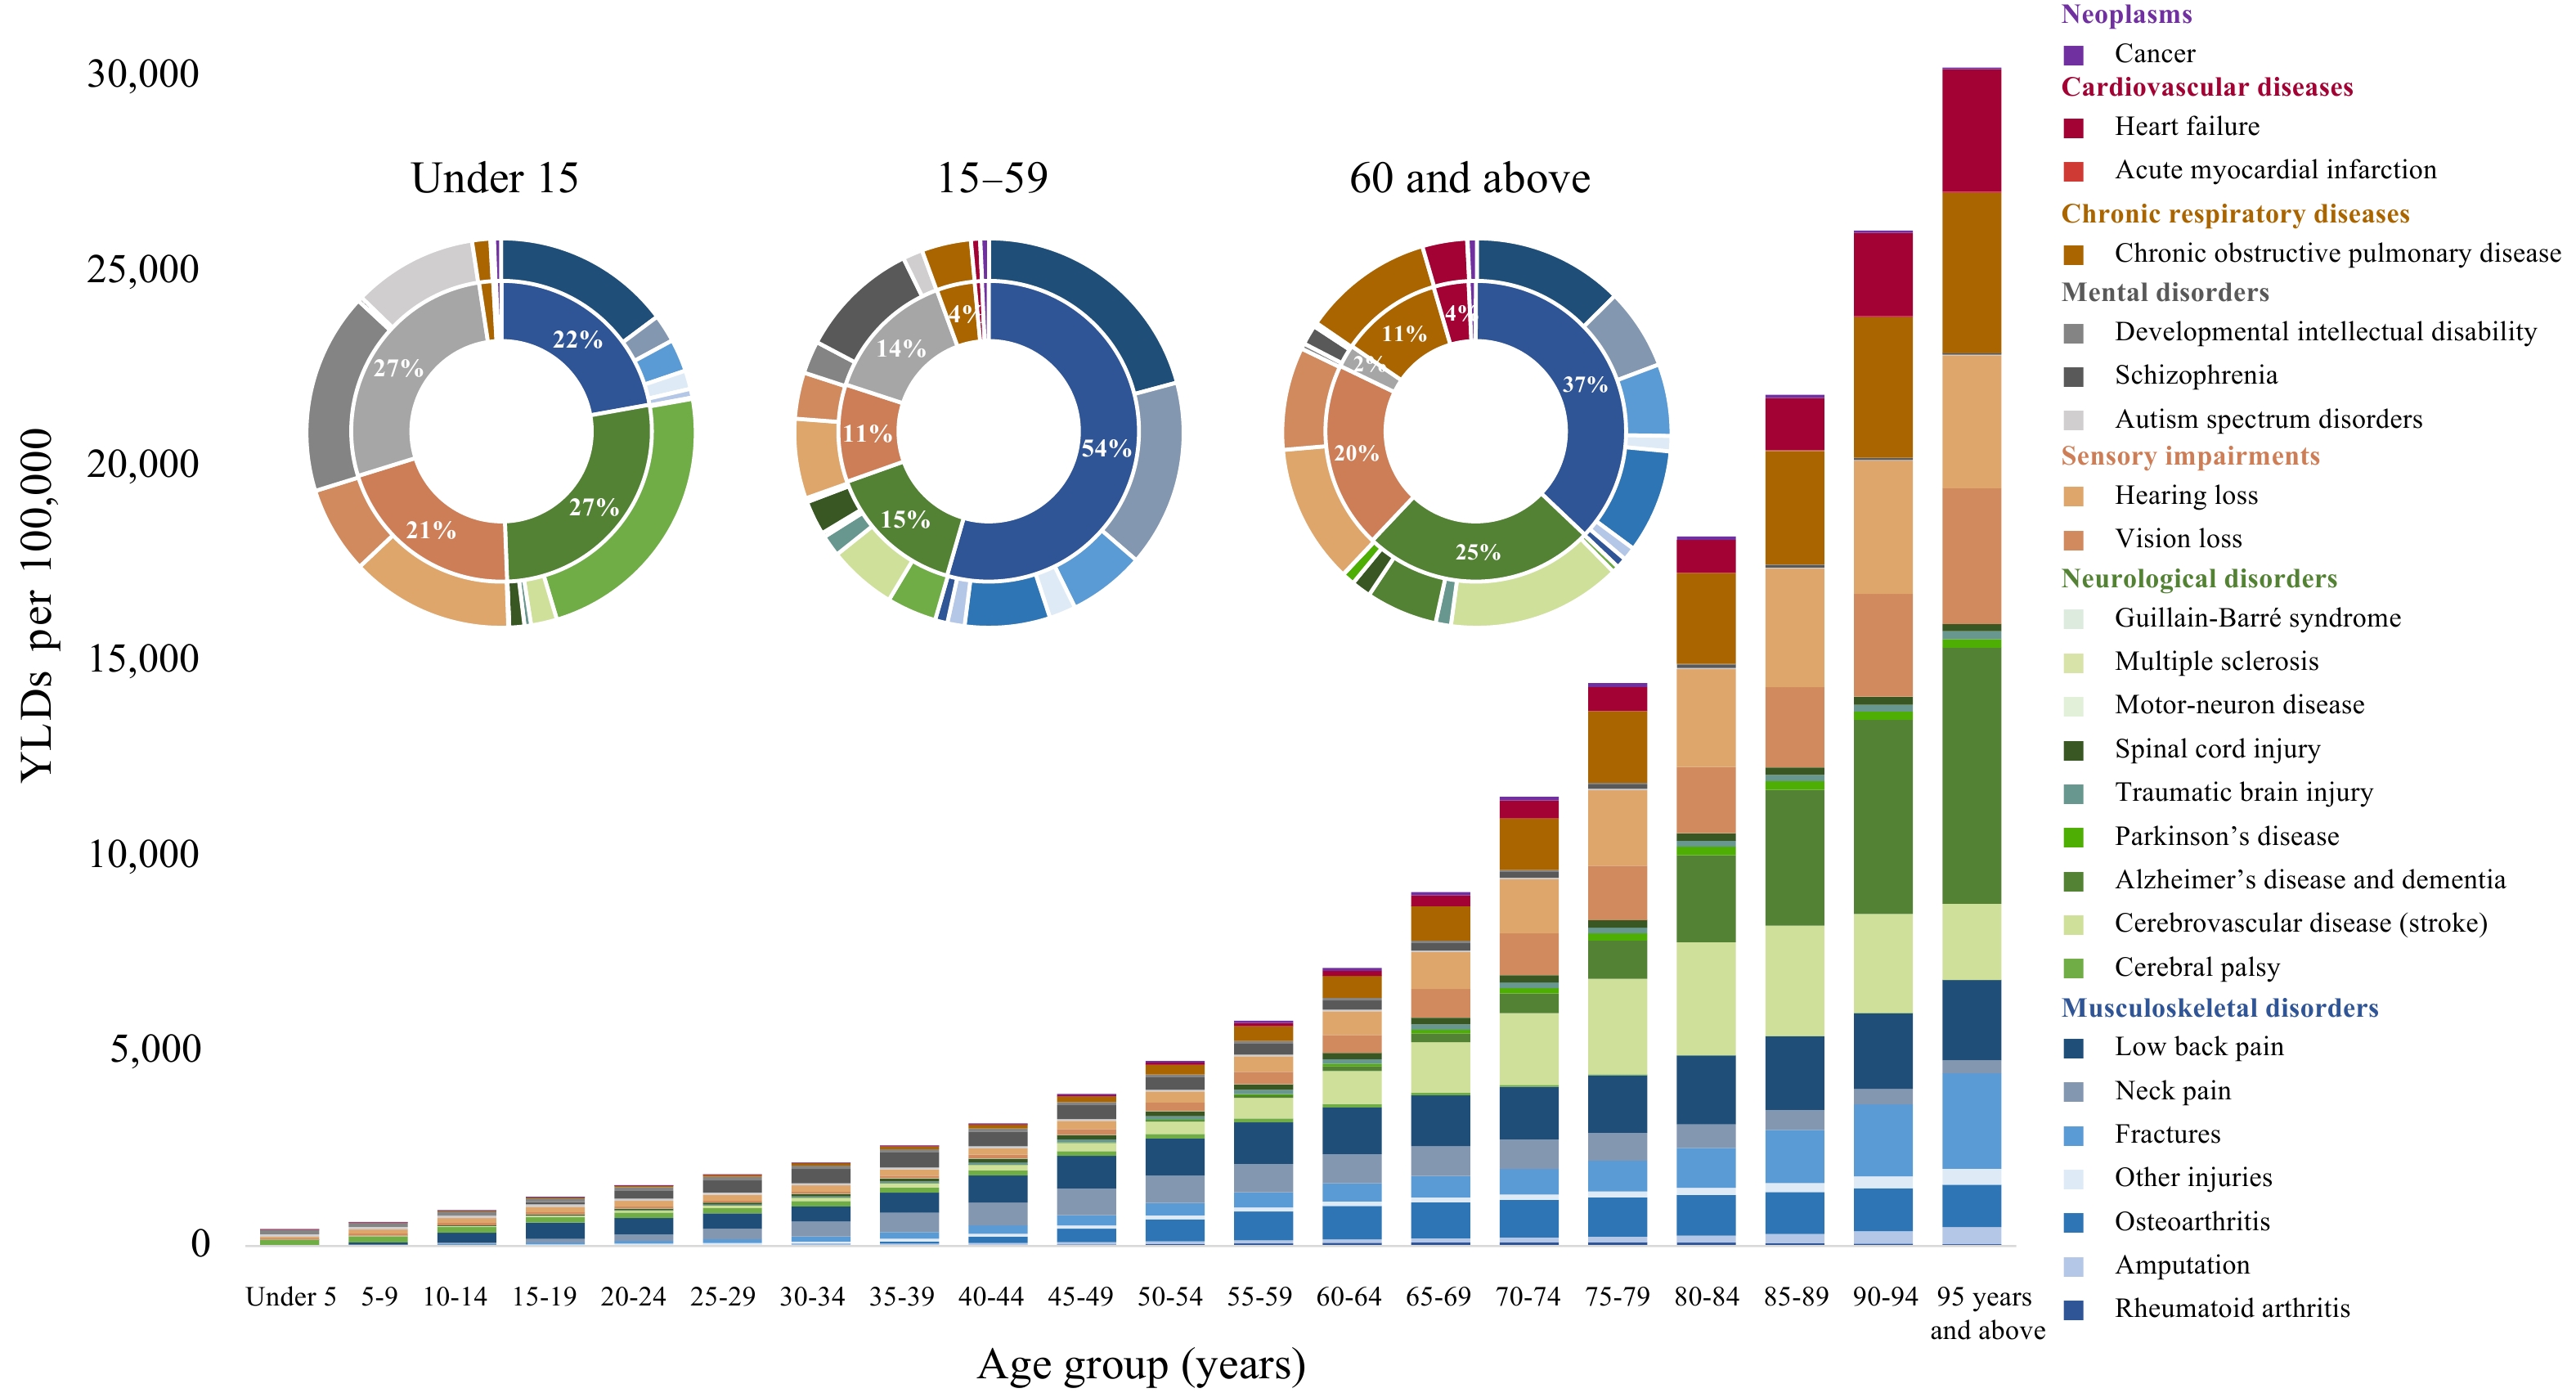
    Figure 1. 

    Disease categories of conditions that would benefit from rehabilitation in China by age group, 2019.

    Abbreviation: YLDs=years of life lived with disability.

    There are noticeable differences in the profiles in terms of the health conditions by age group in China compared to those in the global population (Figure 2). For most diseases in the under-15-year-old group, the YLD rates in China are comparable to or lower than the global average, with the exception of cancer, which has more than doubled. In 15 to 59-year-olds, the YLD rate of Parkinson's disease in China is twice the global average. Low back pain and neck pain have the highest YLD rates both worldwide and in China; however, neck pain seems to be more prevalent among Chinese individuals. In addition, young and middle-aged Chinese adults are more likely to suffer from heart failure, Alzheimer’s disease and dementia, and osteoarthritis, while multiple sclerosis is less prevalent. Furthermore, stroke has become the leading disease burden among Chinese people over the age of 60, followed by low back pain and hearing loss. It is worth mentioning that there have been significant increases in Alzheimer’s disease and dementia YLD rates in the elderly by approximately 90 times worldwide and 60 times in China, respectively, compared to young and middle-aged adults.
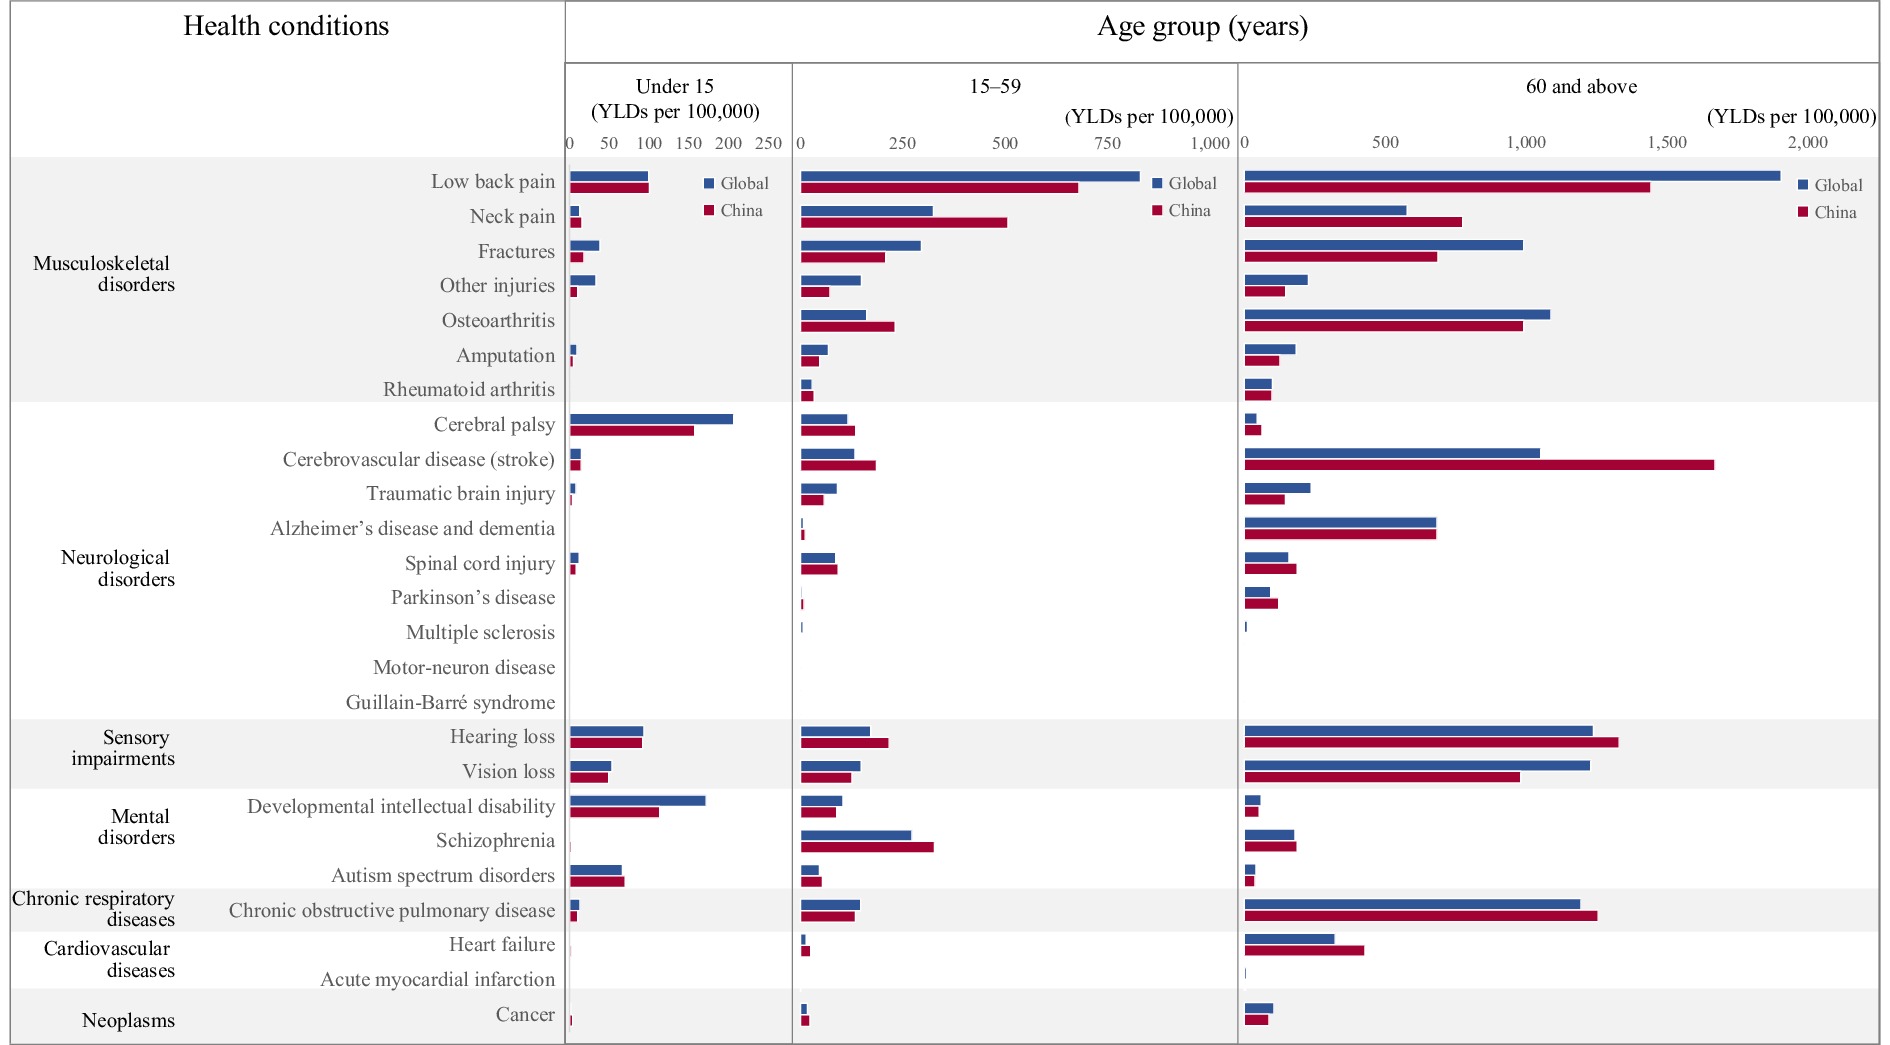
    Figure 2. 

    The rate of YLDs of health conditions by age group in China and worldwide, 2019.

    Abbreviation: YLDs=years of life lived with disability.
    • In this paper, the rehabilitation needs for elderly individuals in China were analyzed in detail. The primary findings of this study were that the increase in Chinese rehabilitation needs in China exceeded 70% in the last 30 years, much higher than the world average. This could be mainly driven by rapid aging of the population. We also found the characteristics of rehabilitation needs in China, such as rapid-growth conditions (i.e., cancer, Alzheimer’s disease, and dementia), and a higher burden of health conditions (i.e., stroke, neck pain, and heart failure). The increased number could possibly be associated with better diagnostic technology, a longer life expectancy, and a higher prevalence in elderly people, as well as potential risk factors, such as lifestyle and environment.

      There were at least three limitations to this study. The first was an unavoidable distortion of the estimation of rehabilitation needs because the data were mainly obtained through the calculation of statistical models, not real-world observations. Second, we did not analyze older age stratification in more detail or sex differences. Third, this study did not provide the data at the provincial level.

      In conclusion, this study presented a comprehensive evaluation of the current state and the challenge of meeting the rehabilitation needs of elderly individuals in China. China has become the country with the largest need for rehabilitation of the elderly (aged 60 and above). With the aging trend of the Chinese population intensifying, there is an increasing demand for rehabilitation, which is already quite high. As the population ages and the proportion of people living with noncommunicable diseases and the consequences of injuries are increasing (45), health and social systems face a huge challenge in meeting these rehabilitation needs.

    • Health conditionPrevalenceYLDs
      All ages (millions)Age-standardized rate
      (per 1,000)
      All ages (millions)Age-standardized rate
      (per 1,000)
      19902019Change (%)19902019Change (%)19902019Change (%)19902019Change (%)
      Overall total268.4
      (257.3–281.8)
      460.0
      (442.6–478.6)
      71.3260.0
      (249.9–271.4)
      253.5
      (244.3–264.0)
      −2.535.7
      (26.6–45.6)
      63.1
      (47.3–80.2)
      77.036.3
      (27.3–46.0)
      35.2
      (26.6–44.6)
      −3.0
      Musculoskeletal disorders
      Total186.0
      (173.7–199.2)
      322.1
      (301.7–343.0)
      73.2179.7
      (168.0–191.4)
      172.3
      (162.1–183.2)
      −4.117.6
      (12.5–23.3)
      28.1
      (19.9–38.5)
      59.517.1
      (12.3–22.7)
      15.0
      (10.7–20.3)
      −12.3
      Low back pain75.3
      (66.0–85.1)
      91.3
      (80.5–104.1)
      21.372.5
      (63.9–81.7)
      51.3
      (45.5–57.9)
      −29.18.6
      (6.0–11.4)
      10.3
      (7.3–14.0)
      20.88.2
      (5.8–10.9)
      5.8
      (4.1–7.8)
      −29.0
      Neck pain37.9
      (29.9–48.6)
      68.0
      (53.7–87.2)
      79.635.3
      (28.0–44.9)
      35.7
      (28.7–45.2)
      1.23.8
      (2.5–5.6)
      6.8
      (4.4–9.8)
      78.13.5
      (2.3–5.2)
      3.6
      (2.3–5.2)
      1.5
      Fractures27.8
      (25.6–30.0)
      65.5
      (61.0–69.9)
      135.928.2
      (26.2–30.3)
      35.1
      (32.8–37.4)
      24.81.7
      (1.2–2.4)
      3.8
      (2.5–5.4)
      121.41.7
      (1.2–2.4)
      2.0
      (1.4–2.9)
      18.5
      Other injuries22.6
      (20.5–25.5)
      40.1
      (36.4–45.0)
      77.320.9
      (19.0–23.5)
      22.2
      (20.1–25.1)
      6.30.78
      (0.55–1.1)
      1.1
      (0.70–1.6)
      38.90.71
      (0.50–0.97)
      0.60
      (0.39–0.90)
      −14.9
      Osteoarthritis33.2
      (26.2–40.8)
      85.9
      (67.6–105.3)
      158.537.9
      (29.8–46.3)
      41.0
      (32.4–50.1)
      8.21.8
      (0.90–3.6)
      4.7
      (2.3–9.5)
      159.72.1
      (1.0–4.1)
      2.2
      (1.1–4.5)
      8.9
      Amputation14.2
      (13.0–15.5)
      27.2
      (25.2–29.5)
      91.413.3
      (12.3–14.5)
      15.0
      (14.0–16.3)
      12.80.65
      (0.47–0.87)
      0.78
      (0.52–1.12)
      19.10.64
      (0.47–0.84)
      0.43
      (0.28–0.61)
      −33.1
      Rheumatoid arthritis1.5
      (1.3–1.6)
      3.1
      (2.8–3.5)
      114.21.5
      (1.3–1.7)
      1.6
      (1.4–1.7)
      5.20.27
      (0.19–0.36)
      0.57
      (0.39–0.77)
      112.50.27
      (0.19–0.37)
      0.29
      (0.20–0.39)
      5.8
      Neurological disorders
      Total20.6
      (19.4–21.8)
      57.3
      (53.5–61.4)
      178.823.6
      (22.1–25.2)
      32.6
      (30.4–35.0)
      38.04.7
      (3.4–5.9)
      12.4
      (8.9–15.9)
      166.75.2
      (3.8–6.6)
      7.1
      (5.1–9.0)
      35.0
      Cerebral palsy2.9
      (2.4–3.5)
      8.4
      (7.0–10.5)
      193.42.3
      (2.0–2.8)
      6.3
      (5.2–7.8)
      170.50.63
      (0.42–0.87)
      1.8
      (1.2–2.5)
      184.30.50
      (0.34–0.70)
      1.3
      (0.89–1.9)
      163.6
      Stroke10.0
      (9.0–11.0)
      25.0
      (22.1–28.1)
      149.911.2
      (10.1–12.5)
      12.9
      (11.5–14.4)
      15.02.4
      (1.7–3.1)
      6.1
      (4.3–7.8)
      152.22.7
      (1.9–3.5)
      3.1
      (2.2–4.1)
      15.9
      Traumatic brain injury2.2
      (2.1–2.3)
      6.5
      (6.2–7.0)
      199.32.1
      (2.0–2.3)
      3.4
      (3.2–3.7)
      60.60.31
      (0.22–0.42)
      0.93
      (0.65–1.3)
      199.10.30
      (0.21–0.41)
      0.49
      (0.34–0.66)
      62.2
      Alzheimer’s disease and dementia3.3
      (2.8–3.9)
      13.2
      (11.0–15.3)
      292.66.1
      (5.2–7.1)
      7.9
      (6.6–9.1)
      29.20.46
      (0.33–0.63)
      1.9
      (1.3–2.5)
      302.40.88
      (0.62–1.2)
      1.1
      (0.80–1.5)
      29.0
      Spinal cord injury2.1
      (2.0–2.3)
      5.1
      (4.8–5.5)
      138.22.0
      (1.8–2.1)
      2.7
      (2.6–2.9)
      38.70.73
      (0.52–0.93)
      1.4
      (1.0–1.8)
      87.80.66
      (0.47–0.84)
      0.74
      (0.52–1.0)
      11.4
      Parkinson’s disease0.37
      (0.29–0.44)
      1.3
      (1.1–1.6)
      260.00.50
      (0.40–0.60)
      0.67
      (0.55–0.82)
      35.80.11
      (0.07–0.16)
      0.40
      (0.26–0.55)
      258.30.15
      (0.10–0.21)
      0.20
      (0.13–0.28)
      36.5
      Multiple sclerosis0.017
      (0.013–0.021)
      0.033
      (0.025–0.041)
      97.00.014
      (0.011–0.018)
      0.018
      (0.014–0.023)
      23.30.006
      (0.004–0.009)
      0.012
      (0.008–0.017)
      97.00.005
      (0.003–0.008)
      0.007
      (0.004–0.009)
      23.3
      Motor-neuron disease0.025
      (0.020–0.031)
      0.036
      (0.029–0.044)
      42.70.021
      (0.017–0.026)
      0.024
      (0.020–0.029)
      14.30.006
      (0.004–0.009)
      0.009
      (0.006–0.012)
      42.70.005
      (0.004–0.007)
      0.006
      (0.004–0.008)
      14.3
      Guillain‒Barré syndrome0.005
      (0.004–0.007)
      0.008
      (0.006–0.010)
      45.00.005
      (0.003–0.006)
      0.005
      (0.004–0.007)
      11.30.002
      (0.001–0.002)
      0.002
      (0.001–0.003)
      45.00.001
      (0.001–0.002)
      0.002
      (0.001–0.002)
      11.3
      Sensory impairments
      Total72.7
      (67.0–79.0)
      142.0
      (130.5–153.3)
      95.380.9
      (75.3–86.8)
      78.1
      (72.3–83.8)
      −3.55.3
      (3.6–7.3)
      9.5
      (6.6–13.0)
      78.46.0
      (4.1–8.1)
      5.4
      (3.7–7.4)
      −9.4
      Hearing loss50.5
      (44.2–56.7)
      95.2
      (83.7–107.5)
      88.356.7
      (50.6–62.8)
      52.2
      (46.4–57.9)
      −8.13.4
      (2.3–4.8)
      5.7
      (3.8–7.9)
      65.93.7
      (2.5–5.1)
      3.3
      (2.2–4.6)
      −10.5
      Vision loss26.8
      (24.6–29.4)
      59.3
      (53.5–65.6)
      121.031.8
      (29.1–34.6)
      33.1
      (30.2–36.2)
      4.11.9
      (1.3–2.6)
      3.8
      (2.7–5.3)
      100.82.3
      (1.6–3.1)
      2.1
      (1.5–2.9)
      −7.5
      Mental disorders
      Total20.4
      (16.5–24.5)
      25.4
      (22.2–29.0)
      24.516.9
      (13.6–20.3)
      18.0
      (15.6–20.6)
      6.53.8
      (2.9–4.8)
      5.5
      (4.2–6.9)
      44.63.2
      (2.4–4.0)
      3.5
      (2.6–4.4)
      9.8
      Developmental
      Intellectual disability
      12.7
      (8.8–16.7)
      15.1
      (12.1–18.4)
      19.110.4
      (7.2–13.7)
      11.3
      (9.0–13.8)
      8.40.85
      (0.52–1.3)
      1.2
      (0.80–1.7)
      42.70.70
      (0.43–1.0)
      0.91
      (0.59–1.3)
      30.8
      Schizophrenia3.6
      (3.1–4.0)
      5.5
      (4.9–6.1)
      54.83.0
      (2.7–3.4)
      3.1
      (2.7–3.5)
      3.12.3
      (1.7–2.9)
      3.6
      (2.6–4.4)
      53.92.0
      (1.4–2.4)
      2.0
      (1.5–2.5)
      3.8
      Autism spectrum
      disorders
      4.3
      (3.5–5.2)
      5.0
      (4.1–6.0)
      15.63.6
      (2.9–4.3)
      3.7
      (3.1–4.5)
      4.10.66
      (0.43–1.0)
      0.76
      (0.50–1.1)
      14.50.55
      (0.36–0.81)
      0.57
      (0.37–0.84)
      4.4
      Chronic respiratory diseases
      Total14.7
      (12.8–16.6)
      23.6
      (20.0–27.4)
      60.717.3
      (14.9–19.6)
      12.6
      (10.6–14.5)
      −27.42.8
      (2.3–3.2)
      4.5
      (3.7–5.3)
      61.73.3
      (2.7–3.8)
      2.4
      (2.0–2.8)
      −27.2
      Chronic obstructive pulmonary disease14.7
      (12.8–16.6)
      23.6
      (20.0–27.4)
      60.717.3
      (14.9–19.6)
      12.6
      (10.6–14.5)
      −27.42.8
      (2.3–3.2)
      4.5
      (3.7–5.3)
      61.73.3
      (2.7–3.8)
      2.4
      (2.0–2.8)
      −27.2
      Cardiovascular diseases
      Total4.5
      (3.6–5.6)
      11.9
      (9.6–14.7)
      163.36.9
      (5.6–8.5)
      6.6
      (5.4–8.1)
      −4.10.51
      (0.34–0.76)
      1.4
      (0.88–2.0)
      163.80.78
      (0.51–1.1)
      0.75
      (0.49–1.1)
      −3.4
      Heart failure4.4
      (3.6–5.5)
      11.7
      (9.4–14.6)
      163.26.8
      (5.5–8.4)
      6.5
      (5.3–8.0)
      −4.30.51
      (0.33–0.75)
      1.3
      (0.87–2.0)
      163.80.77
      (0.50–1.1)
      0.74
      (0.48–1.1)
      −3.5
      Acute myocardial infarction0.068
      (0.060–0.077)
      0.19
      (0.16–0.21)
      172.40.092
      (0.081–0.103)
      0.10
      (0.09–0.12)
      11.60.006
      (0.004–0.009)
      0.017
      (0.012–0.024)
      167.20.008
      (0.006–0.012)
      0.009
      (0.007–0.013)
      10.5
      Neoplasms
      Total0.87
      (0.77–0.98)
      3.5
      (3.0–4.0)
      300.10.95
      (0.85–1.1)
      1.7
      (1.5–2.0)
      82.30.12
      (0.08–0.16)
      0.45
      (0.31–0.63)
      282.40.12
      (0.09–0.17)
      0.23
      (0.16–0.32)
      85.3
      Cancer0.87
      (0.77–0.98)
      3.5
      (3.0–4.0)
      300.10.95
      (0.85–1.1)
      1.7
      (1.5–2.0)
      82.30.12
      (0.08–0.16)
      0.45
      (0.31–0.63)
      282.40.12
      (0.09–0.17)
      0.23
      (0.16–0.32)
      85.3
      Note: change stands for percentage change from 1990–2019. Numbers in parentheses represent 95% uncertainty interval.
      Abbreviation: YLDs=years of life lived with disability.

      Table S1.  The prevalence and YLDs of health conditions in need of rehabilitation, China, 1990–2019.

  • No conflicts of interest.
  • Reference (7)

    Citation:

    Catalog

      /

      DownLoad:  Full-Size Img  PowerPoint
      Return
      Return