-
The development of vaccines has made a great contribution to the fight against coronavirus disease 2019 (COVID-19), but it should be clearly recognized that the elimination of severe acute respiratory syndrome coronavirus 2 (SARS-CoV-2) requires the combined efforts of humanity. In order to determine how the population mobility among different regions might affect the COVID-19 epidemic, we constructed a transregional mobility dynamics model to assess the relationship between population mobility and the COVID-19 pandemic. Based on a previous study on vaccine efficacy against infection in the United Kingdom (1) and a study in Chile on the vaccine protective effects of CoronaVac (2), the baseline efficacy, indicated by efficacy against infection (
$ {\mathrm{E}}_{inf} $ ), efficacy against symptomatic disease ($ {\mathrm{E}}_{sym} $ ), and efficacy against death$ ({\mathrm{E}}_{dea} $ ) was respectively 30%, 68.3%, and 86%. If the vaccination rate reaches 95%, allowing for transregional movement would result in 234.2 million infections (64.1 million symptomatic cases) and 2.0 million deaths (case fatality rate of 0.85%) within a year in unaffected regions. Increasing$ {\mathrm{E}}_{inf} $ and$ {\mathrm{E}}_{sym} $ to no less than 40% and 90%, respectively, could reduce the incidence of COVID-19 in COVID-zero regions to influenza-like levels. When the$ {\mathrm{E}}_{inf} $ of the vaccine was higher, the$ {\mathrm{E}}_{sym} $ could be reduced accordingly. No matter how effective the vaccine was, it could not eliminate COVID-19 in COVID-zero regions, i.e., regions with strong national commitments to suppressing COVID-19 transmission such as China. The human race should continue to develop vaccines and explore new ways to improve vaccine protection against infection in order to eliminate COVID-19 at the global level.In order to group the transmission risk of COVID-19 in various countries around the world, we used a proportion of existing cases in the overall population of countries to rank and group these countries and regions into three levels, including high-risk regions, medium-risk regions, and low-risk regions. COVID-zero regions were defined as countries or regions committed to reducing the number of domestic cases to zero, such as China. The countries covered by each region were shown in Figure 1A. Considering the disease characteristics of COVID-19, we added categories to include asymptomatic infected cases and divided each category into two according to vaccination status (Figure 1B). The model assumed that the mobility rate between COVID-zero regions and other areas was constant. All parameters used in this model and COVID-19 epidemic data sources were shown in Table 1, and more details of methods were shown in Supplementary Materials.
 Figure 1.
Diagrams of the COVID-19 epidemic model. (A) the diagram of transregional mobility of population, (B) epidemic dynamics model compartments.
Note: S, Iasym, Isym, R, and D desperately denoted the susceptible, asymptomatic infective, symptomatic infective, removal and dead. And the v subscript indicated COVID-19 vaccination. Abbreviation: COVID-19=coronavirus disease 2019.Label Value Reference ${R}_{trans}$ 0.0002, 0.0013* (3-4) ${R }_{0}$ 2.5 (5) ${{R} }_{sym}$ 70% (5) ${R}_{dea}$ 2.0% Calculated † ${R}_{rem}$ 1/5.4§ (6) $ \mathrm{\beta } $ 0.179 Calculated by ${R}_{0}$ ${R}_{a-s}$ 75% (6) $ {\mathrm{E}}_{inf} $ 30% Based on (1) ¶ $ {\mathrm{E}}_{sym} $ 65.3% (2) $ {\mathrm{E}}_{dea} $ 86% (2) * 0.0002 was the number of arrivals and departures of January to June 2021 and 0.0013 was from the whole year of 2019. They represented the current population mobility rate and normal mobility rate.
† ${R}_{dea}$ is the sum of deaths divided by the sum of confirmed cases in all countries.
§ ${R}_{rem}$ denoted that patients presented to the doctor within 2 days since the onset of symptoms (average 3.4 days) and were no longer transmissible.
¶ More details about the estimation of $ {\mathrm{R}}_{inf} $ could be found in Supplementary Materials.Table 1. Estimation of COVID-19 transregional model parameters and data sources.
Based on the study in Chile mentioned above,
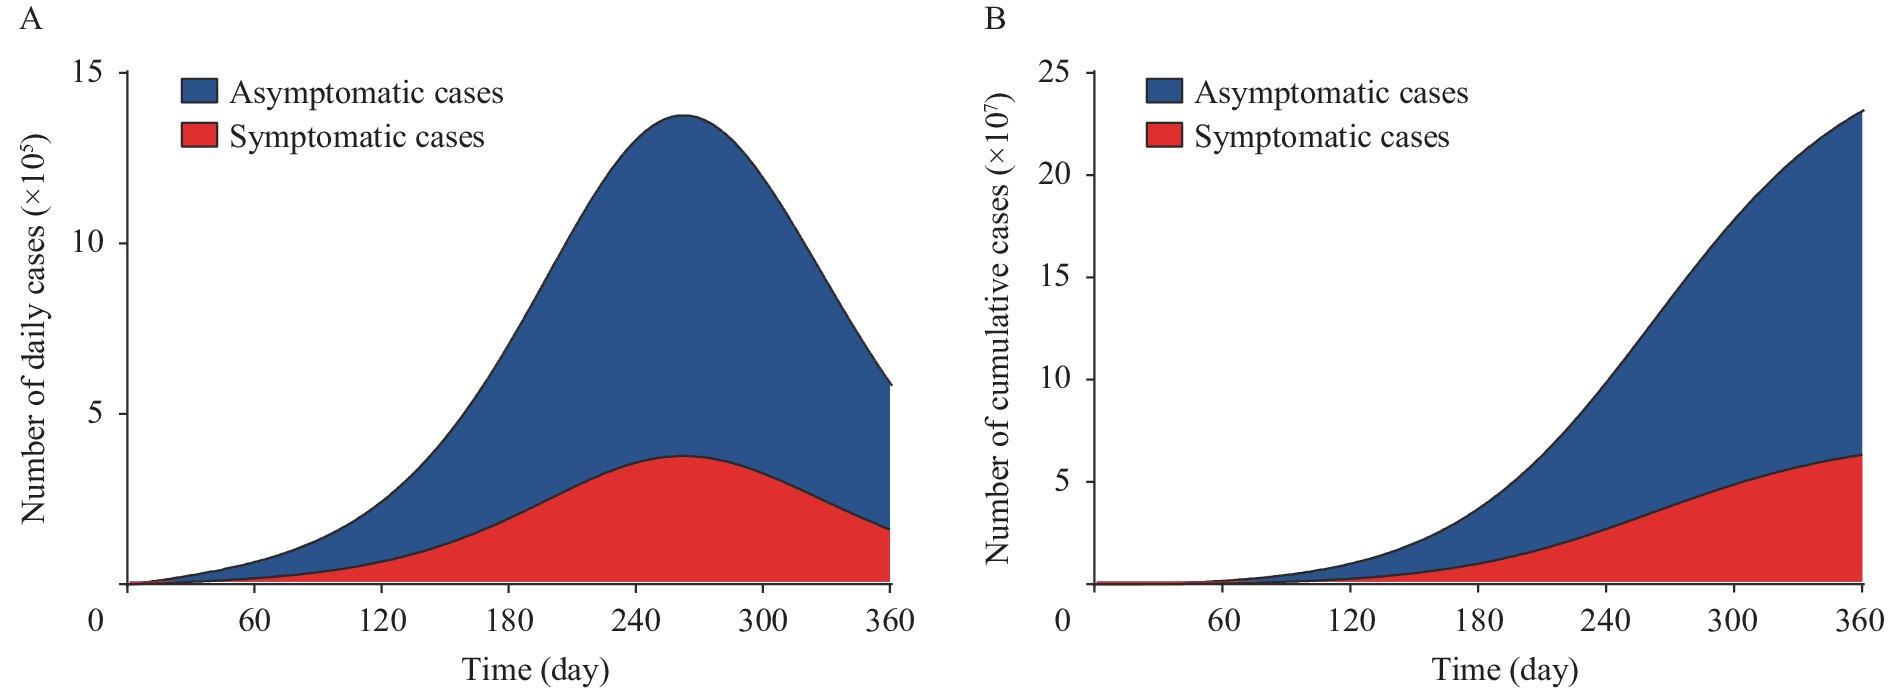
${\mathrm{E}}_{sym}$ and${\mathrm{E}}_{dea}$ of CoronaVac was 68.3% and 86%, respectively (2). And the$ {\mathrm{E}}_{inf} $ was estimated to 55% by the study produced in the United Kingdom (1). Considering the declining immunity in the vaccinated population,$ {\mathrm{E}}_{inf} $ was finally estimated to 30% (Supplementary Material). Based on the baseline efficacies of the vaccines, referred to$ {\mathrm{E}}_{inf} $ ,$ {\mathrm{E}}_{sym} $ , and${\mathrm{E}}_{dea}$ were 30%, 68.3%, and 86%, respectively, the global vaccination rate could reach 95% and then people in other areas could move within COVID-zero regions without non-pharmaceutical interventions (NPIs). Among COVID-zero regions, a total of 234.2 million SARS-CoV-2 infections were projected to occur in one year, of which 170.1 million (72.6%) were asymptomatic cases and 64.1 million (27.4%) are symptomatic cases (Figure 2A), with a total death count of 2.0 million (case fatality rate 0.85%). The highest number of new symptomatic cases per day was estimated 376,600, which would appear on the Day 262 after lifting the restrictions and the highest number of deaths per day was 11,400, which would appear on the Day 266 (Figure 2B) in COVID-zero regions. Figure 2.
Prediction of COVID-19 epidemic after restoring population mobility without NPIs. (A) The number of daily infections, (B) The number of cumulative infections with time..
Note: Blue denoted the asymptomatic cases and red denoted the symptomatic cases. This result was based on the efficacy against infections, symptomatic disease and death was separately 30%, 68.3%, and 86%, and the vaccination rate was 95%.On the basis of maintaining the current mobility rate, we explored what kind of combination of vaccine protective efficacy could lift the restrictions. Due to the COVID-19 vaccine having an
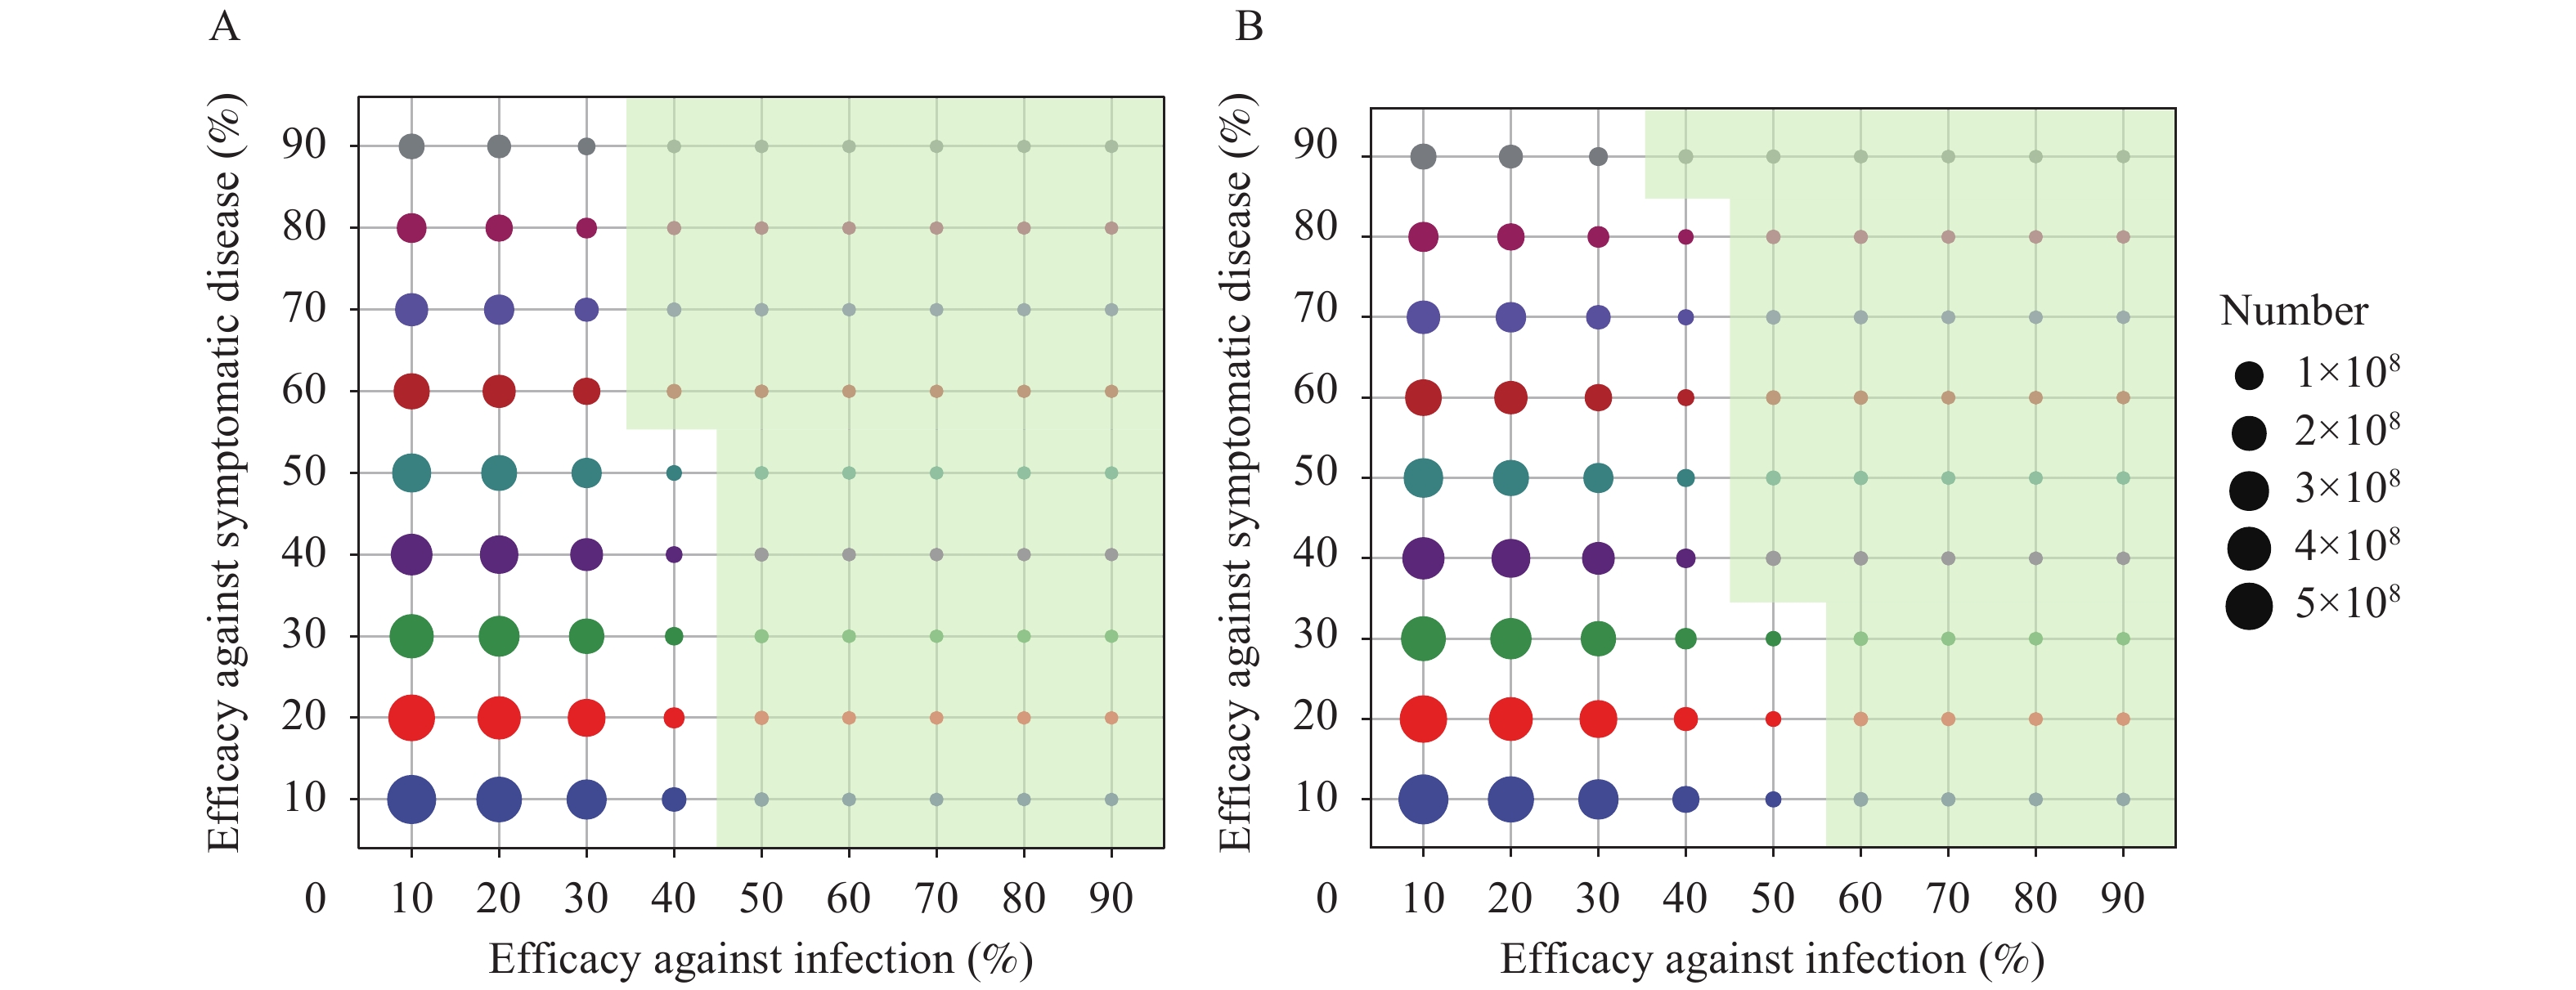
$ {\mathrm{E}}_{dea} $ of 86%, we presented results that assumed$ {\mathrm{E}}_{dea} $ to be 90% (Figure 3A). Predictions of other combinations of vaccine protective efficacy could be found in the Supplementary Materials. The results suggested that in order to reduce the annual incidence of COVID-19 to influenza, the vaccine’s$ {\mathrm{E}}_{inf} $ needed to be increased to more than 40% concurrently with an$ {\mathrm{E}}_{sym} $ of at least 60%. If the$ {\mathrm{E}}_{inf} $ was increased to 50%, the$ {\mathrm{E}}_{sym} $ could decrease to 0%. In addition, when the 3 efficacies reached at least 90%, the annual incidence of COVID-19 was decreased to 0.81/100,000 population. Figure 3.
The number of COVID-19 cases in response to different vaccine protection at (A) low rate of population mobility, (B) normal rate of population mobility.
Note: The size of the circle denoted the number of COVID-19 cases and the green shadow denoted the annual incidence was lower than influenza with the corresponding efficacy against infection and symptomatic disease and a vaccination rate of 95%, indicated that efficacy against death has a less impact on virus transmission so we only show the prediction of 90% efficacy against death.Finally, we assessed what protective efficacy would be required to restore the population mobility to ensure that the incidence of COVID-19 could be lower than that of influenza. After restoring the population mobility rate of 2019, a higher vaccine protective effect was required. In order to reduce the annual incidence of COVID-19 to that of influenza, the vaccine’s
$ {\mathrm{E}}_{inf} $ and$ {\mathrm{E}}_{sym} $ needed to be increased to no less than 40% and 90%, respectively. With a higher$ {\mathrm{E}}_{inf} $ , the$ {\mathrm{E}}_{sym} $ could be decreased (Figure 3B). When the$ {\mathrm{E}}_{inf} $ was increased to 70%, the$ {\mathrm{E}}_{sym} $ could be decreased to 0 (Table 2).Vaccination rate (%) Mobility rate (%) Vaccine effectiveness Symptomatic cases Deaths Infection (%) Symptom (%) Death (%)* 95 0.02 30.0 65.3 86.0 64,123,171 2,039,690 95 0.02 40.0 60.0 90.0 1,054,347 28,517 95 0.02 50.0 0.0 90.0 623,887 12,906 95 0.13 40.0 90.0 90.0 706,184 40,565 95 0.13 50.0 40.0 90.0 1,105,650 31,237 95 0.13 60.0 0.0 90.0 627,634 17,808 Abbreviation: COVID-19=coronavirus disease 2019.
* Indicated that efficacy against death has a less impact on virus transmission so we only showed the prediction of 90% efficacy against death.Table 2. Prediction of COVID-19 epidemic by currently vaccine effectiveness and combinations of threshold efficacies that can reduce the number of infections to influenza.
-
Our model aimed to create a hypothetical scenario in which enough people were vaccinated to assess whether people could move freely and safely without NPIs. There were three main findings of this study. First, based on the assumption of parameters that the
$ {\mathrm{E}}_{inf} $ ,$ {\mathrm{E}}_{sym} $ , and$ {\mathrm{E}}_{dea} $ were 30%, 65.3%, and 86%, respectively, COVID-19 vaccinations were not enough to provide a sufficient proportion of immunized population to resume normal population mobility without NPIs. Among the three parameters estimating the protective effects of the vaccine, only the$ {\mathrm{E}}_{inf} $ was supported by existing evidence. But considering immune escape ability of Delta variant, we thought estimation of 30% was reasonable. It indicated that policymakers should carefully deal with allowing transmission with freedom and all populations should continue to maintain the NPIs in order to avoid a resurgence of COVID-19.Second, if we assumed that COVID-19 incidence was lower than that of influenza for resuming population mobility, the vaccine
$ {\mathrm{E}}_{inf} $ should be at least 40%. Simply increasing the$ {\mathrm{E}}_{sym} $ and$ {\mathrm{E}}_{dea} $ would not do much to control the disease. The$ {\mathrm{E}}_{inf} $ had a more important impact on controlling COVID-19 at the population level. Therefore, further research on the efficacy against infection was of vital significance. The results of this study only assumed the minimum value of the protective effects to decrease the incidence of COVID-19 to that of influenza due to the decline in vaccine immunity and the possible emergence of new strains. In any case, resuming international population mobility should be treated with caution to avoid domestic outbreaks.Finally, we investigated if the vaccine alone could be used to achieve a COVID-zero strategy in COVID-zero regions. Because of population mobility, even if the 3 vaccine efficacies reached 90%, COVID-zero regions would not be able to eliminate COVID-19. This result suggested that as long as there were COVID-19 cases in other countries, vaccinations alone without non-pharmaceutical interventions could not reduce the number of domestic cases to zero. Rationally allotting the COVID-19 vaccines might play a more important role in controlling COVID-19 worldwide.
This study was subject to at least four limitations. First, the vaccine protective efficacy was assumed based on results of the Sinovac vaccine in Chile. However, due to the different types of vaccines used in various countries around the world, this may not accurately reflect results in other regions included in this study. In addition, the estimated mobility rate in this study referred to data of China in 2019 and 2021, and the mobility rate of other countries will differ significantly from that in China. Third, due to China’s policy of administering booster vaccinations, the study did not consider the effect of declining immunity on vaccine effectiveness, but this may lead to further issues in predicting disease transmission. Fourth, the emergence of new SARS-CoV-2 strains might significantly increase the risk of disease transmission in a country or region, and the parameters of this model were based on the characteristics of current strains. If new variants of concern emerge, researchers need to re-model the risk of disease transmission after acquiring the information about the characteristics of new strains.
The key to controlling COVID-19 lies in the development and widespread use of vaccines that are more effective at preventing infection. People still need to maintain adequate NPIs to avoid the risk of COVID-19 recurrence.
HTML
| Citation: |


 Download:


