

 Download:


-
In the first half of 2023, a global shift towards the predominance of XBB variants was observed, accounting for over 50% of sequenced cases globally by February (1). However, the timing of the XBB’s emergence as the dominant strain varied by location. Specifically, XBB became prevalent in January in the United States, February in the United Kingdom, and April in the Republic of Korea (2–4). In contrast, China experienced a significant epidemic driven by the Omicron subvariants BA.5.2 and BF.7 from December 2022 to the early part of 2023 (5), marking a distinct epidemiological pattern from that of other regions. Understanding the sequence of events leading to the replacement of these subvariants by XBB in China is essential to a more comprehensive understanding of how dominant severe acute respiratory syndrome coronavirus 2 (SARS-CoV-2) variants change on a global scale.
XBB, acknowledged as the first recombinant variant to reach global dominance, arises from recombination of the Omicron subvariants BJ.1 and BM.1.1.1, which are both part of BA.2.75 (6). This variant is notorious for its enhanced ability to evade immunity from both past infections and vaccinations, which played a significant role in its rapid spread and global prevalence (7). Nevertheless, the variation in the pace at which XBB has replaced other variants across different regions remains inadequately explained. Our study leverages surveillance data from both local and imported cases in China during the first half of 2023. We aimed to depict the shifting landscape of variant distribution among provincial-leveladministrative divisions (PLADs) and explore the determinants contributing to the swift rise of XBB as the dominant strain.
-
The provincial-level CDC laboratories submitted SARS-CoV-2 sequences from local and imported coronavirus disease 2019 (COVID-19) cases to China CDC for validation and analysis. Sequences analyzed were collected between January 1, 2023, and July 31, 2023, with sample collection occurring from January to June 2023. Local cases comprised infections in China but excluded Hong Kong Special Administrative Region (SAR), Macau SAR, and Taiwan, China. Imported cases referred to infections acquired abroad, Hong Kong SAR, Macau SAR, and Taiwan, China.
The genome sequencing threshold was set at a Ct value ≤32. Sentinel hospitals, located in each PLAD and covering all cities and counties including those with land and sea ports, were charged with the collection of sequencing samples for local cases. The submission of genome sequences was proportionate to the number of reported cases in each respective PLAD. Weekly sequence reporting was mandated to encompass samples from severe and fatal cases, individuals aged 65 years and above, as well as those with compromised immune systems. For imported cases, passengers who reported anomalies in their entry declarations or underwent quarantine measures were subjected to nucleic acid testing. Subsequently, genome sequencing was carried out for samples meeting the sequencing criteria (i.e., Ct value ≤ 32).
Consensus sequences underwent quality analysis using Nextclade (version 2.14.0). Sequences with satisfactory quality were classified using the Phylogenetic Assignment of Named Global Outbreak Lineages (PANGOLIN; version v4.3, pangolin-data version v1.21).
The data normality was assessed with the Shapiro-Wilk test. Parametric data underwent Pearson correlation analysis and unpaired t-test, while nonparametric data were analyzed using Spearman correlation analysis. Statistical analyses were conducted using GraphPad Prism 9 (GraphPad Software, Inc., La Jolla, CA, USA), with statistical significance set at P<0.05.
-
A total of 56,486 SARS-CoV-2 genome sequences were collected from local cases in the first half of 2023. The XBB variant became the predominant strain from April onwards (Figure 1A). Following the identification of XBB variants on February 3, we conducted weekly analyses to monitor the variant composition within XBB. Initially, XBB.1.9.1 and XBB.1.5 subvariants were prevalent, but their prevalence decreased over time, leading to the emergence of XBB.1.16, XBB.1.22, and XBB.1.9.2 subvariants (Figure 1B).
 Figure 1.
Overview of the dynamics of SARS-CoV-2 variants in local and imported cases. (A) Timecourse of SARS-CoV-2 variants distribution in local cases, categorized by monthly intervals. (B) Timecourse of SARS-CoV-2 XBB variants distribution in local cases, categorized by week intervals since the emergence of XBB. (C) Timecourse of SARS-CoV-2 variants distribution in imported cases, categorized by monthly intervals. (D) Temporal dynamics of SARS-CoV-2 XBB variants in imported cases, categorized by week intervals since January 2023.
Note: BA.5.2 was not included in BF.7.
Abbreviation: SARS-CoV-2=severe acute respiratory syndrome coronavirus 2.
* Includes all descendent lineages.
A total of 8,669 SARS-CoV-2 whole-genome sequences from imported cases were collected while monitoring the local case situation. The XBB variant became the prevailing strain starting from February, with its emergence predating January (Figure 1C). Initially, XBB.1.5 showed dominance but later shifted to XBB.1.16, XBB.1.9.1, and XBB.1.9.2 (Figure 1D).
-
We performed a detailed analysis of the variant distribution among PLADs in the first half of 2023. The onset of XBB predominance (>50% proportion) varied across PLADs (Figure 2A). In April, 14 PLADs, including Anhui and Jiangxi, began the transition, while 15 others like Hunan Province and Beijing Municipality started in May. Remarkably, Liaoning Province switched exclusively from BA.5.2/BF.7 to BA.2.75, causing a delay in achieving XBB dominance until June.
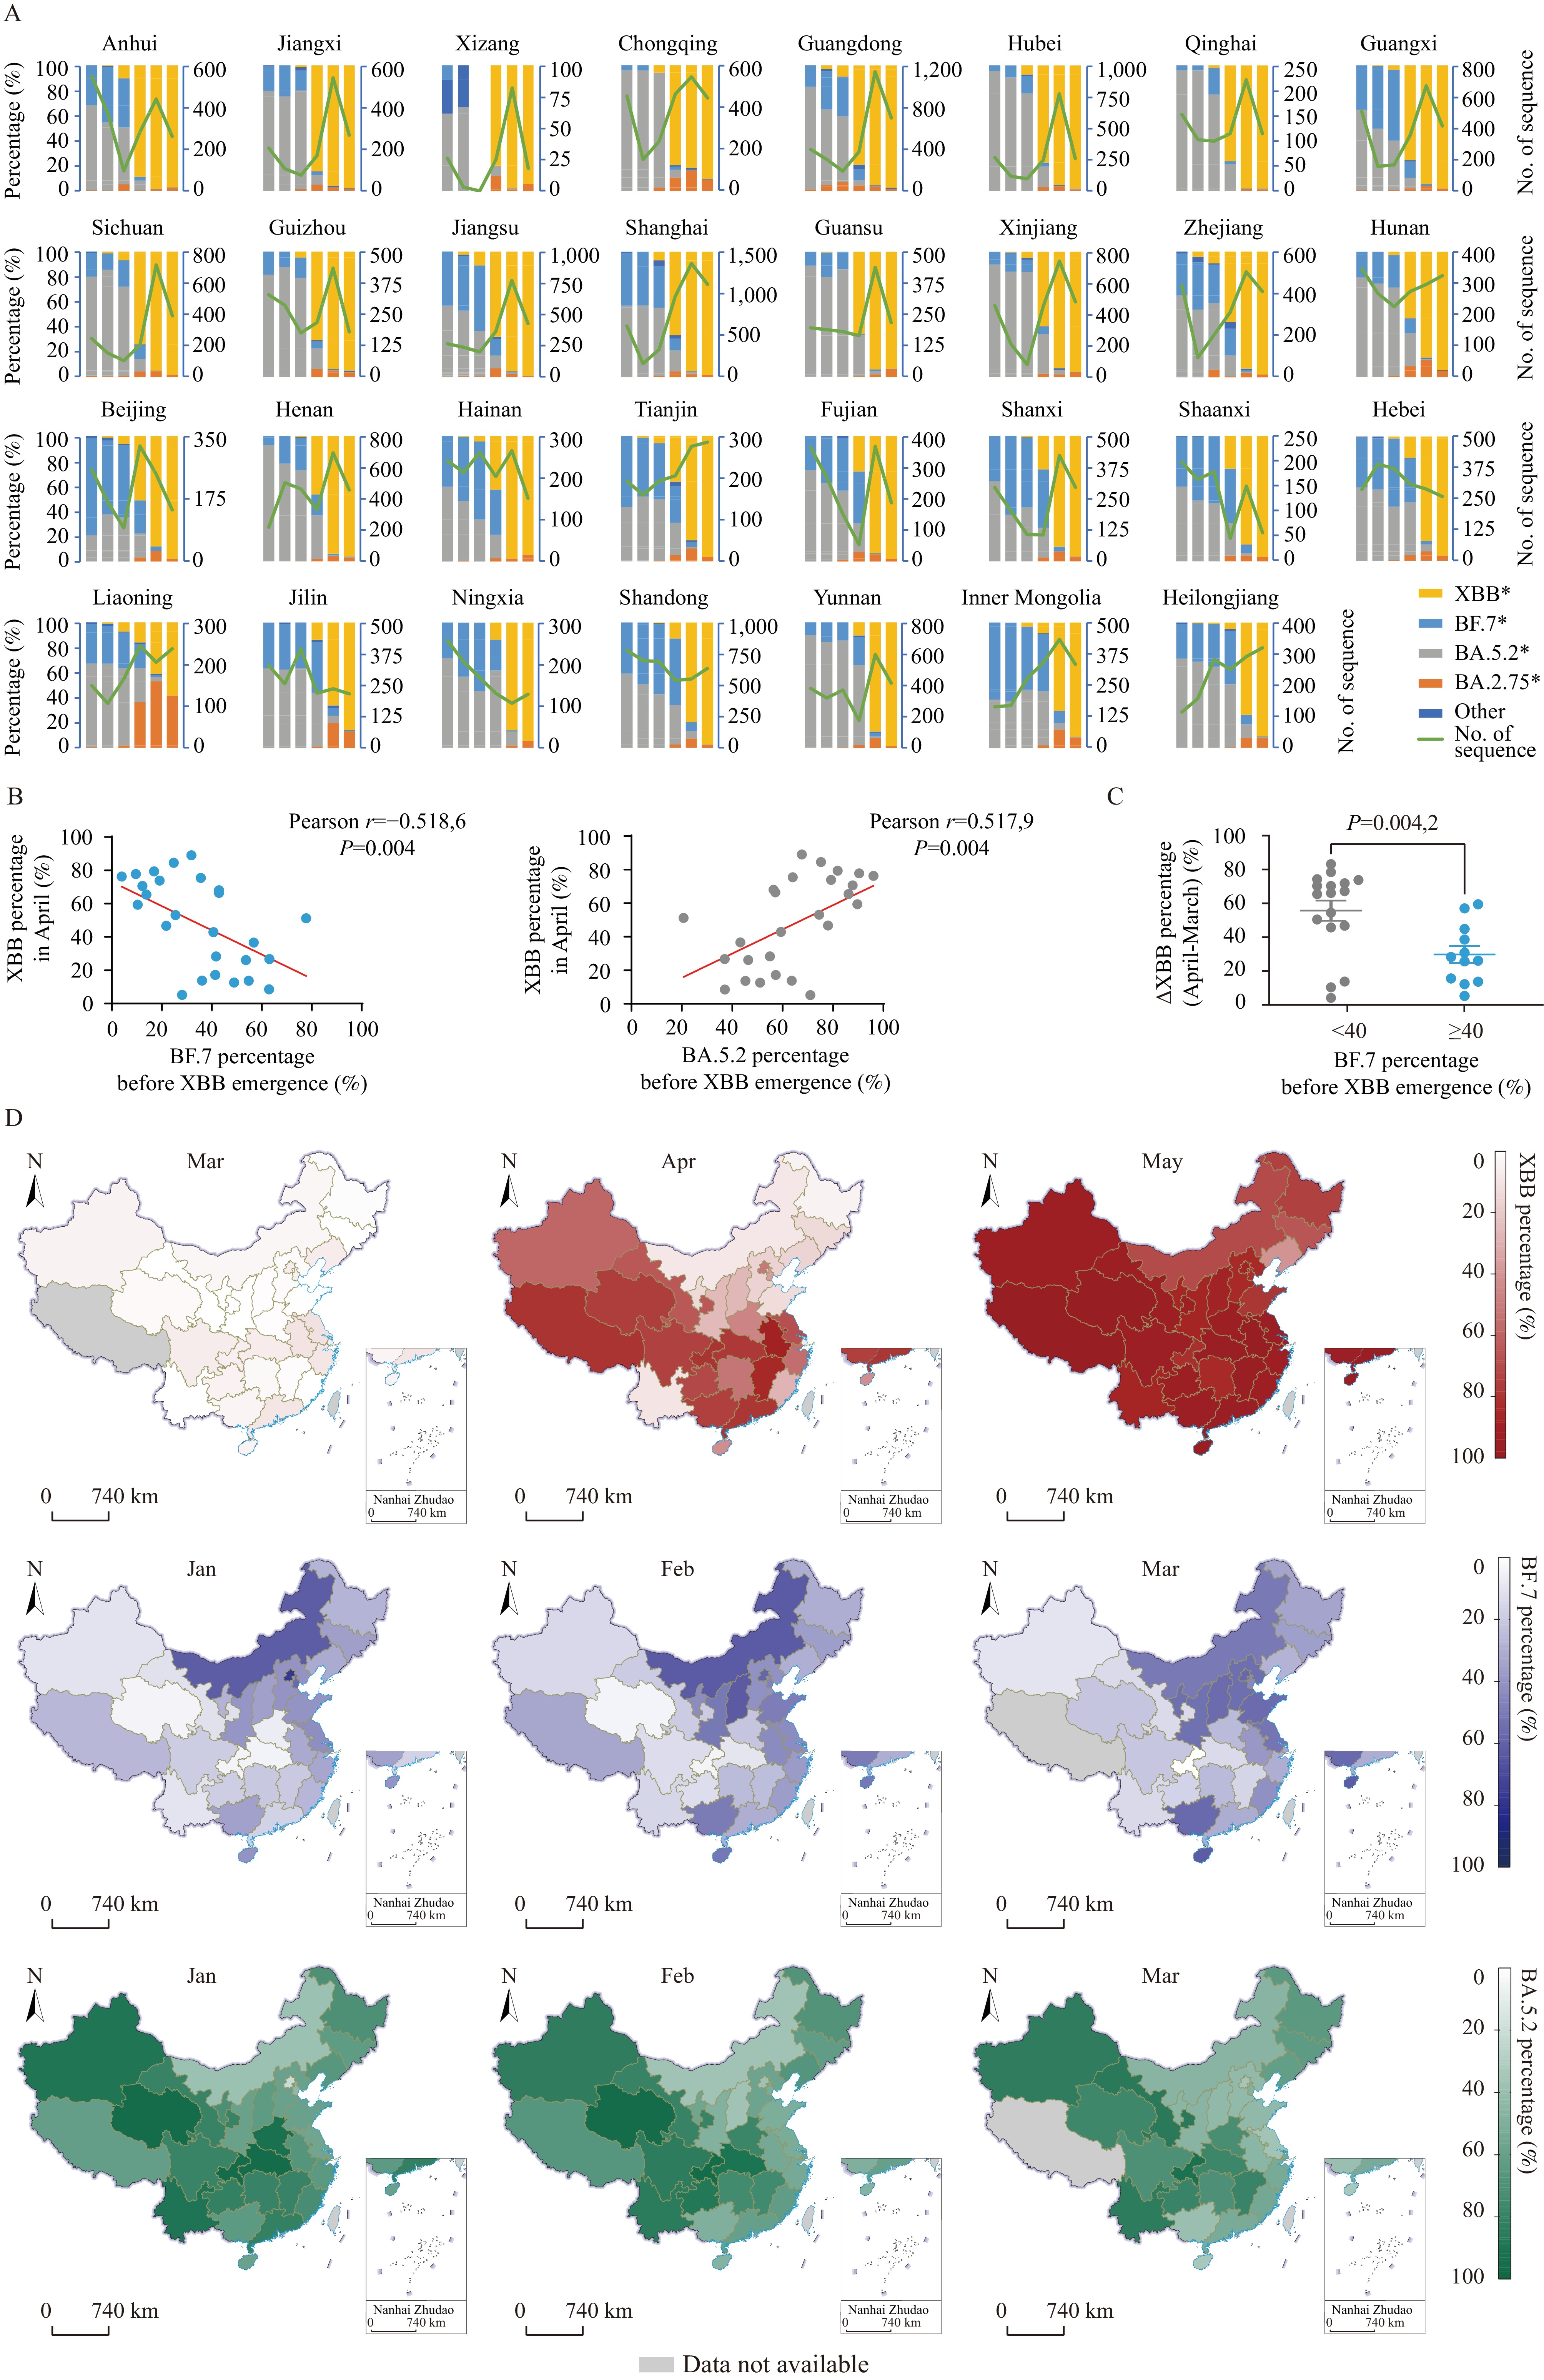 Figure 2.
The correlations between the speed of XBB alternations and preceding prevalence variants. (A) The temporal dynamics of SARS-CoV-2 variants in local cases, categorized by monthly intervals and disaggregated by PLAD. (B) The correlations between the percentage of XBB in April and the percentages of BF.7 or BA.5.2 before the emergence of XBB. (C) The percentage changes of XBB from March to April were analyzed in two groups of PLADs, with a grouping criterion based on the 40% threshold of BF.7 ratio prior to the prevalence of XBB. (D) The distribution of XBB, BF.7, and BA.5.2 percentages across different PLADs in China throughout various months.
Note: For (A), the coordinates indicating the number of sequences are shown on the right side. The PLADs were ranked in descending order based on the proportion of XBB in April 2023. For (B–C), Liaoning Province and Xizang Autonomous Region were not included. P values were determined using unpaired t-tests. For (D), Grey indicates no available data.
Map approval number: GS 京(2024) 0679 号.
Abbreviation: SARS-CoV-2=severe acute respiratory syndrome coronavirus 2; PLAD=provincial-level administrative division.
* Includes all descendant lineages. BA.5.2 was not included in BF.7.
To analyze the factors influencing the replacement of XBB, we used the XBB proportion in April as an indicator of the speed of XBB replacement and calculated the percentage of BF.7 or BA.5.2 (excluding BF.7) before the emergence of XBB in each PLAD. Xizang Autonomous Region and Liaoning Province were excluded from the analysis due to a lack of sequences collected in March (Xizang) and circulating BA.2.75 prior to XBB emergence (Liaoning). A significant negative correlation was found between the percentage of BF.7 before XBB emergence and the April XBB proportion, and a positive correlation was observed between the percentage of BA.5.2 before XBB emergence and the April XBB proportion (Figure 2B). Additionally, when using a 40% threshold for BF.7 percentages before the prevalence of XBB to divide the PLADs into two groups, we found that PLADs with BF.7 proportions under 40% showed a significantly larger increase in XBB proportions from March to April compared to those with proportions equal to or above 40% (Figure 2C).
The spatial distribution of variant prevalence was visually analyzed using maps (Figure 2D). In March, XBB had a low prevalence nationwide. In April, the emergence of XBB began in a contiguous cluster of PLADs from northwest to southeast, resembling the pattern of BA.5.2 prior to April but differing from BF.7. By May, XBB had become the dominant variant in nearly all PLADs. In PLADs where BF.7 was initially prevalent, the prevalence of XBB was delayed.
-
Different XBB subvariants harbor distinct mutations that impact their biological characteristics (8). Here, we explored whether the initial prevalence of specific XBB subvariants affected the dominance rate of XBB. Limited data from Xizang Autonomous Region prompted us to track the XBB lineage composition in PLADs outside Xizang weekly from January 28 to February 3 (Figure 3A). The predominant initial XBB subvariants in most PLADs were XBB.1.9.1, XBB.1.5, and XBB.1.16, with exceptions like XBB.1.22 in Anhui and Hubei Provinces, and XBB.1.19 in Beijing Municipality (Figure 3A and 3B). Nonetheless, no significant correlation was found between the percentage of XBB in April and the proportions of subvariants XBB.1.9.1, XBB.1.5, or XBB.1.16 within the same month (Figure 3C). Thus, there is insufficient evidence to support the notion that intra-subvariants of XBB influenced its replacement in China.
 Figure 3.
The correlations between the speed of XBB alternations and XBB subvariants. (A) The temporal dynamics of SARS-CoV-2 variants in local cases, categorized by weekly intervals since the first week of XBB emergence (January 28 to February 3) and disaggregated by PLAD. (B) The distribution of XBB subvariants in PLADs in April. (C) The correlations between the percentage of XBB in April and the percentages of XBB.1.9.1, XBB.1.5, or XBB.1.16 subvariants in XBB sequences in April.
Note: For (A), The coordinates indicating the number of sequences are shown on the right side. The PLADs were ranked in descending order based on the proportion of XBB in April 2023. Xizang Autonomous Region was not included. For (B–C), Xizang Autonomous Region and Liaoning Province were not included.
Abbreviation: SARS-CoV-2=severe acute respiratory syndrome coronavirus 2; PLADs=provincial-level administrative divisions.
* includes all descendent lineages.
-
Furthermore, we investigated the relationship between the proportions of imported XBB variants and the rate of local XBB replacement. PLADs with fewer than 10 total sequences from January to March were excluded from the monthly variant distribution analysis in the first half of 2023 (Figure 4A) to ensure accuracy. Importantly, we found a significant positive correlation between the proportion of XBB in imported cases from January to March and its subsequent prevalence among local populations in April (Figure 4B), suggesting a potential link between imported cases and local transmission dynamics. Geographical maps were used to visually represent the spatial distribution (Figure 4C).
 Figure 4.
The correlations between the local XBB alterations and XBB detection in imported cases. (A) The temporal dynamics of SARS-CoV-2 variants in imported cases, categorized by monthly intervals and disaggregated by PLAD; (B) The correlation between the percentage of local XBB in April and the percentages of imported XBB from January to March 2023; (C) The distribution of imported and local XBB percentages across different PLADs in China; (D) The distribution of local and imported XBB subvariants across different PLADs in China.
Note: For (A), the coordinates indicating the number of sequences are shown on the right side. PLADs with fewer than 10 sequences from imported cases in the 1–3-month period were excluded. The PLADs were ranked in descending order based on the proportion of XBB from January to March 2023. BA.5.2 was not included BF.7. For (B), PLADs with fewer than 10 sequences from imported cases in the 1–3-month period were excluded. For (C), grey indicates no available data. For (D), the period for local XBB subvariants was April and for imported XBB subvariants was 1–3-month. The top five XBB lineages (including ties) are displayed for each PLAD, with the denominator representing the total number of XBB sequences.
Map approval number: GS京(2024) 0679号.
Abbreviation: SARS-CoV-2=severe acute respiratory syndrome coronavirus 2; PLADs=provincial-level administrative divisions.
* Includes all descendent lineages.
# Total sequences less than 20.
To compare the diversity of XBB subvariants, we analyzed their distribution in both local and imported cases across various PLADs in the first half of 2023. Proportions of the subvariants were determined relative to the total number of XBB sequences, with the 5 most prevalent subvariants depicted in pie charts. Our analysis revealed that neighboring PLADs tended to have similar distributions of dominant local XBB subvariants. For example, Jiangsu, Anhui, and Hubei provinces had a high incidence of XBB.1.22 (Figure 4D). Additionally, some subvariants presented unique geographical patterns; Xinjiang Uygur Autonomous Region and Hainan Province were predominantly affected by XBB.1.42, Beijing Municipality had a significant occurrence of XBB.1.19, and Anhui Province showed a higher frequency of XBB.1.18. In the context of imported cases, notable examples include Shandong Province reporting XBB.1.24, Guangxi Zhuang Autonomous Region with an increase in XBB.1.11, and Heilongjiang Province having a significant presence of XBB.1.14. We observed notable differences in the distribution profiles for local versus imported cases within the same province, suggesting that variations in XBB subvariants have a limited influence on their capacity to supplant existing predominant strains. It appears that in provinces with a substantial proportion of imported XBB cases, the replacement of the dominant local epidemic strain by XBB occurred more swiftly at the outset.
-
The study examined genomic sequence data of SARS-CoV-2 in both local and imported cases in China during the first half of 2023. The local cases showed a 2-month delay in the onset of the XBB epidemic compared to imported cases, with varying rates of XBB dominance among PLADs. The prevalence of XBB in local cases was linked to the proportion in imported cases. Intra-subvariants of XBB did not significantly impact its spread in China.
The substitution of BF.7 with XBB shows a slower rate compared to the replacement of BA.5.2 in China. This delay is possibly due to the presence of the R346T mutation in the spike protein’s receptor binding domain in both XBB and BF.7, indicating a closer antigenic relationship between XBB and BF.7 than with BA.5.2 (9–10), which could complicate the dominance of XBB. Notably, research has shown that XBB has similar evasion capabilities against plasma from CoronaVac-vaccinated breakthrough infections caused by BA.5 and BF.7 (11), indicating that other factors may hinder XBB’s dominance in PLADs where BF.7 is common. The significant antigenic difference between XBB and BF.7 may override the shared R346T mutation. Further investigations analyzing case surveillance data are necessary for clarification.
In the first half of 2023, XBB.1.5, XBB.1.9.1, and XBB.1.16 were identified as the prevailing subvariants of XBB in China, showing no significant variance in replacement rates. Relative to XBB.1.16, a notable resemblance in spike protein sequences was observed between XBB.1.5 and XBB.1.9 (12–13). Nonetheless, the antigenic distinctions among XBB subvariants were notably lower compared to the previously predominant strains BA.5.2 and BF.7. Hence, alternative analytical approaches might be necessary to understand the reasons behind the dominance of intra-XBB subvariants during XBB succession.
This study found a positive correlation between the timing of XBB replacement in local cases and the proportion of XBB in imported cases. Previous research has shown that before the COVID-19 policy adjustment in China on January 8, 2023, most local outbreaks stemmed from transmission through imported cases (5,14–15). However, the proportion of circulating XBB subvariants in different PLADs seems more influenced by factors like geographic proximity, economic activity, and local transmission conditions rather than the rate of importation.
This study is subject to some limitations. First, due to unavailable data, the analysis of local epidemic prevalence strains did not consider factors like demography, economic activity, and geography. Second, there was a notable disparity in the number of sequences submitted by various PLADs, especially for imported cases, potentially resulting in analytical bias. In light of the rising importance of monitoring SARS-CoV-2 variants post-global COVID-19 pandemic, it is crucial to maintain strong surveillance systems across China.
In conclusion, this study clarifies the XBB replacement process post a severe epidemic in various PLADs of China. It highlights the role of imported variants in influencing local variant shifts and offers valuable insights for preparing against future dominant variants effectively.
-
No conflicts of interest.
HTML
The XBB Variants Emerged as the Predominant Strains in China Starting in April 2023.
The XBB Variants Required More Time to Replace BF.7 Compared to BA.5.2.
The Replacement Patterns of the Various Subvariants of XBB did not Show Noticeable Differences
The Prevalence of local XBB was Correlated with the Proportion of Imported XBB.
| Citation: |

|