

 Download:


-
According to national surveillance data, there has been a significant increase in new coronavirus disease 2019 (COVID-19) cases in various provincial-level administrative divisions (PLADs) of the Chinese mainland since March 2023, primarily due to the XBB Omicron variant (1). This wave of COVID-19 is believed to involve both initial infections and re-infections. Previous studies have mainly focused on individuals with hybrid immunity, but the immunization background of the Chinese population differs from that of other populations. Individuals with initial severe acute respiratory syndrome coronavirus 2 (SARS-CoV-2) infections generally lack significant mixed immunity, which allows for a more accurate assessment of acute symptoms and clinical severity in those infected with prevalent strains. Additionally, several factors, such as underlying diseases and vaccination status, can influence clinical severity (2-3). Therefore, it is crucial to monitor the severity of symptoms in both initial COVID-19 infections and re-infections across diverse populations. This study aimed to conduct an online survey to investigate the clinical symptoms and severity in individuals who tested positive for COVID-19 between April 1 and May 30, 2023, in all 31 PLADs in China. The findings of this study will help identify high-risk populations, provide guidance for clinical diagnosis and treatment, and suggest strategies for future epidemic prevention and control.
An observational online survey was conducted on the Sina Weibo platform using a self-designed questionnaire. The survey was conducted between May 23 and May 30, 2023, covering 31 PLADs in China. Each Weibo account holder was allowed to complete the questionnaire only once. The questionnaire consisted of two parts: demographic information and COVID-19-related information. Participants who tested positive for COVID-19 through nucleic acid or antigen testing between April 1 and May 30, 2023, were included in the study. Initial infections were defined as cases with no previous positive COVID-19 test before April 1, while reinfections were cases with one or more positive COVID-19 tests before April 1. Participants who did not have a negative COVID-19 test at the time of completing the questionnaire were excluded from the study.
Categorical variables were presented as counts and proportions (n, %). Continuous variables were presented as means ± standard error. Univariate analysis included the chi-square test, Student’s t-test, Wilcoxon rank sum test, and Kruskal-Wallis test. Multivariate logistic regression was performed to assess the association between potential influencing factors and disease severity, while adjusting for potential confounding factors. Adjusted odds ratios (ORs) with corresponding 95% confidence intervals (CIs) were calculated. Data cleaning and analyses were conducted using Stata software (version 17.0, Stata Corp; College Station, TX, USA). A significance level of P<0.05 was considered statistically significant.
We analyzed a total of 42,987 participants who initially tested positive for nucleic acid or antigen, but later tested negative and had confirmed results (
Supplementary Figure S1 ). Of these participants, 20,798 (48.4%) experienced initial infections, while 22,189 (51.6%) were classified as reinfections (Table 1). The three most prevalent symptoms reported were cough, sore throat, and nasal congestion (Supplementary Table S1 ). Participants reported a median of six symptoms, and the median duration of viral shedding was five days (Supplementary Table S1 ).Variables Total, n (%) Initial infection, n (%) Reinfection, n (%) Total 42,987 20,798 (48.4) 22,189 (51.6) Regions* North 6,456 (15.0) 3,099 (48.0) 3,357 (52.0) Northeast 1,844 (4.3) 1,020 (55.3) 824 (44.7) East 14,934 (34.7) 7,317 (49.0) 7,617 (51.0) South Central 12,640 (29.4) 6,069 (48.0) 6,571 (52.0) Southwest 5,232 (12.2) 2,410 (46.1) 2,822 (53.9) Northwest 1,881 (4.4) 883 (46.9) 998 (53.1) Age group (years) 0–17 1,488 (3.5) 786 (52.8) 702 (47.2) 18–29 26,221 (61.0) 12,499 (47.7) 13,722 (52.3) 30–39 11,266 (26.2) 5,350 (47.5) 5,916 (52.5) 40–49 2,621 (6.1) 1,278 (48.8) 1,343 (51.2) 50–59 949 (2.2) 582 (61.3) 367 (38.7) 60–69 310 (0.7) 205 (66.1) 105 (33.9) ≥70 132 (0.3) 98 (74.2) 34 (25.8) Sex Female 33,053 (76.9) 15,698 (47.5) 17,355 (52.5) Male 9,934 (23.1) 5,100 (51.3) 4,834 (48.7) Underlying diseases 3,084 (7.2) 1,467 (47.6) 1,617 (52.4) Hypertension 967 (2.3) 496 (51.3) 471 (48.7) Diabetes 354 (0.8) 192 (54.2) 162 (45.8) Cardiovascular diseases 381 (0.9) 202 (53.0) 179 (47.0) Cerebrovascular diseases 82 (0.2) 58 (70.7) 24 (29.3) Respiratory diseases 734 (1.7) 332 (45.2) 402 (54.8) Chronic kidney disease 157 (0.4) 80 (51.0) 77 (49.0) Chronic liver disease 290 (0.7) 150 (51.7) 140 (48.3) Diseases of immune deficiency 624 (1.5) 262 (42.0) 362 (58.0) Tumour 53 (0.1) 28 (52.8) 25 (47.2) Vaccination status None 2,194 (5.1) 876 (39.9) 1,318 (60.1) One dose (>6 months) 580 (1.4) 216 (37.2) 364 (62.8) One dose (3–6 months) 125 (0.3) 45 (36.0) 80 (64.0) One dose from (<3 months) 27 (0.1) 13 (48.1) 14 (51.9) Two doses (>6 months) 7,721 (18) 3,498 (45.3) 4,223 (54.7) Two doses (3–6 months) 387 (0.9) 209 (54) 178 (46) Two doses (<3 months) 229 (0.5) 143 (62.4) 86 (37.6) Three doses (>6 months) 24,560 (57.1) 10,780 (43.9) 13,780 (56.1) Three doses (3–6 months) 2,252 (5.2) 1,241 (55.1) 1,011 (44.9) Three doses (<3 months) 1,156 (2.7) 638 (55.2) 518 (44.8) Four doses and above (>6 months) 333 (0.8) 155 (46.5) 178 (53.5) Four doses and above (3–6 months) 1,882 (4.4) 1,512 (80.3) 370 (19.7) Four doses and above (<3 months) 1,541 (3.6) 1,472 (95.5) 69 (4.5) Note: Initial infections were defined as cases with no history of a positive COVID-19 test before April 1, 2023. Meanwhile, reinfections were defined as cases with one or more positive COVID-19 tests before April 1, 2023.
* North China: Beijing Municipality, Tianjin Municipality, Hebei Province, Shanxi Province; Northeast China: Inner Mongolia Autonomous Region, Liaoning Province, Jilin Province, Heilongjiang Province; East China: Shanghai Municipality, Jiangsu Province, Zhejiang Province, Anhui Province, Fujian Province, Jiangxi Province, Shandong Province; South Central China: Henan Province, Hubei Province, Hunan Province, Guangdong Province, Guangxi Zhuang Autonomous Region, Hainan Province; Southwest China: Chongqing Municipality, Sichuan Province, Guizhou Province, Yunnan Province, Xizang Autonomous Region; Northwest China: Shaanxi Province, Gansu Province, Qinghai Province, Ningxia Hui Autonomous Region, Xinjiang Uygur Autonomous Region; any group with less than three participants was excluded to ensure result robustness. For vaccination status, we included the number of vaccine doses and the duration from the last vaccination, categorized into three stages: <3 months (from January 1 to April 1, 2023), 3–6 months (from October 1, 2022 to January 1, 2023), and >6 months (before October 1, 2022).
Abbreviation: COVID-19=coronavirus disease 2019.Table 1. Sociodemographic information of initial and re-infected COVID-19 cases in China from April 1 to May 30, 2023.
The prevalence of fever (<39.1 °C), cough, fatigue, and runny nose showed no significant difference between initial infections and reinfections (P>0.05). However, expectoration, headache, muscle and joint pain, changes in taste and smell, fever (≥39.1 °C), diarrhea, shortness of breath, nausea, and symptoms categorized under the general, neurological, and gastrointestinal systems had a significantly higher prevalence in initial infections compared to reinfections (all P<0.001). On the other hand, in reinfections, runny nose, nasal congestion, sore throat, and symptoms classified under the respiratory system had a significantly higher prevalence compared to initial infections (all P<0.001) (
Supplementary Table S1 ).The highest prevalence of fever (≥39.1 °C), nasal congestion, and nausea were observed in individuals aged <18 years. Sore throat and changes in taste and smell were the most common symptoms among adults aged 18–60 years, with shortness of breath being the least common. Among individuals who were re-infected, runny nose was most prevalent among those aged ≥70 years, while diarrhea was most prevalent in those aged <18 years (Figure 1A). Among initial infections, the number of symptoms was highest in individuals aged 18–59 years (P<0.001), while among reinfections, the number of symptoms increased as age decreased (P<0.001) (Figure 1B). The duration of viral shedding was significantly longer in initial infections compared to reinfections across all age groups (P<0.001) (Figure 1C). We examined symptom severity in 22,189 reinfected participants, and most reported experiencing milder symptoms during the current infection compared to the previous infection (
Supplementary Table S2 ). Figure 1.
Comparison of clinical manifestations, number of symptoms, and viral shedding durations between an initial and a re-infected COVID-19 cases in China from April 1 to May 30, 2023. (A) The clinical manifestations of COVID-19 among initial and re-infected cases, categorized by age group. (B) The number of symptoms among initial and re-infected cases, categorized by age group. (C) The duration of viral shedding among initial and re-infected cases, categorized by age group.
Note: The percentages in the boxes in panel A indicate the proportion of each symptom within different age groups. The duration of viral shedding was defined as the period between the initial positive test and the first negative test post-infection. The light blue box plot represents initial infections, while the dark blue box plot represents reinfections. The upper line of the box plot represents the third quartile plus 1.5 times the interquartile range, and the lower line represents the first quartile minus 1.5 times the interquartile range.
*** P<0.001.
Abbreviation: COVID-19=coronavirus disease 2019.
The rates of healthcare-seeking behaviors, hospitalization, pneumonia, and intensive care unit (ICU) admission were significantly higher in initial infections compared to reinfections (all P<0.001) (Figure 2). Among individuals with initial infections and reinfections, the age group of 0-17 had the highest rate of healthcare-seeking behaviors, while those aged ≥70 years had the highest rates of pneumonia and ICU admission (
Supplementary Table S3 ). Figure 2.
Comparison of (A) healthcare-seeking behaviors, (B) hospitalization status, and (C) occurrence of pneumonia between initial and re-infected COVID-19 cases in China from April 1 to May 30, 2023.
Note: The total number of participants (42,987) served as the denominator for calculating the prevalence of healthcare-seeking status. The prevalence of hospitalization and pneumonia was calculated using the denominator of the healthcare-seeking group (11,759). Further, the prevalence of ICU admission was determined using the denominator of participants who were hospitalized (425). The data from different age groups were combined to accurately characterize the different populations, and overall proportions were calculated using 1,000 simulations.
*** for P<0.001.
Abbreviation: COVID-19=coronavirus disease 2019.
In multivariate analysis, age and underlying diseases were identified as the primary risk factors for prolonged viral shedding durations, as well as an increased risk of hospitalizations, pneumonia, and ICU admissions. Conversely, vaccination was found to be a protective factor against these variables (Figure 3 and
Supplementary Table S4 ).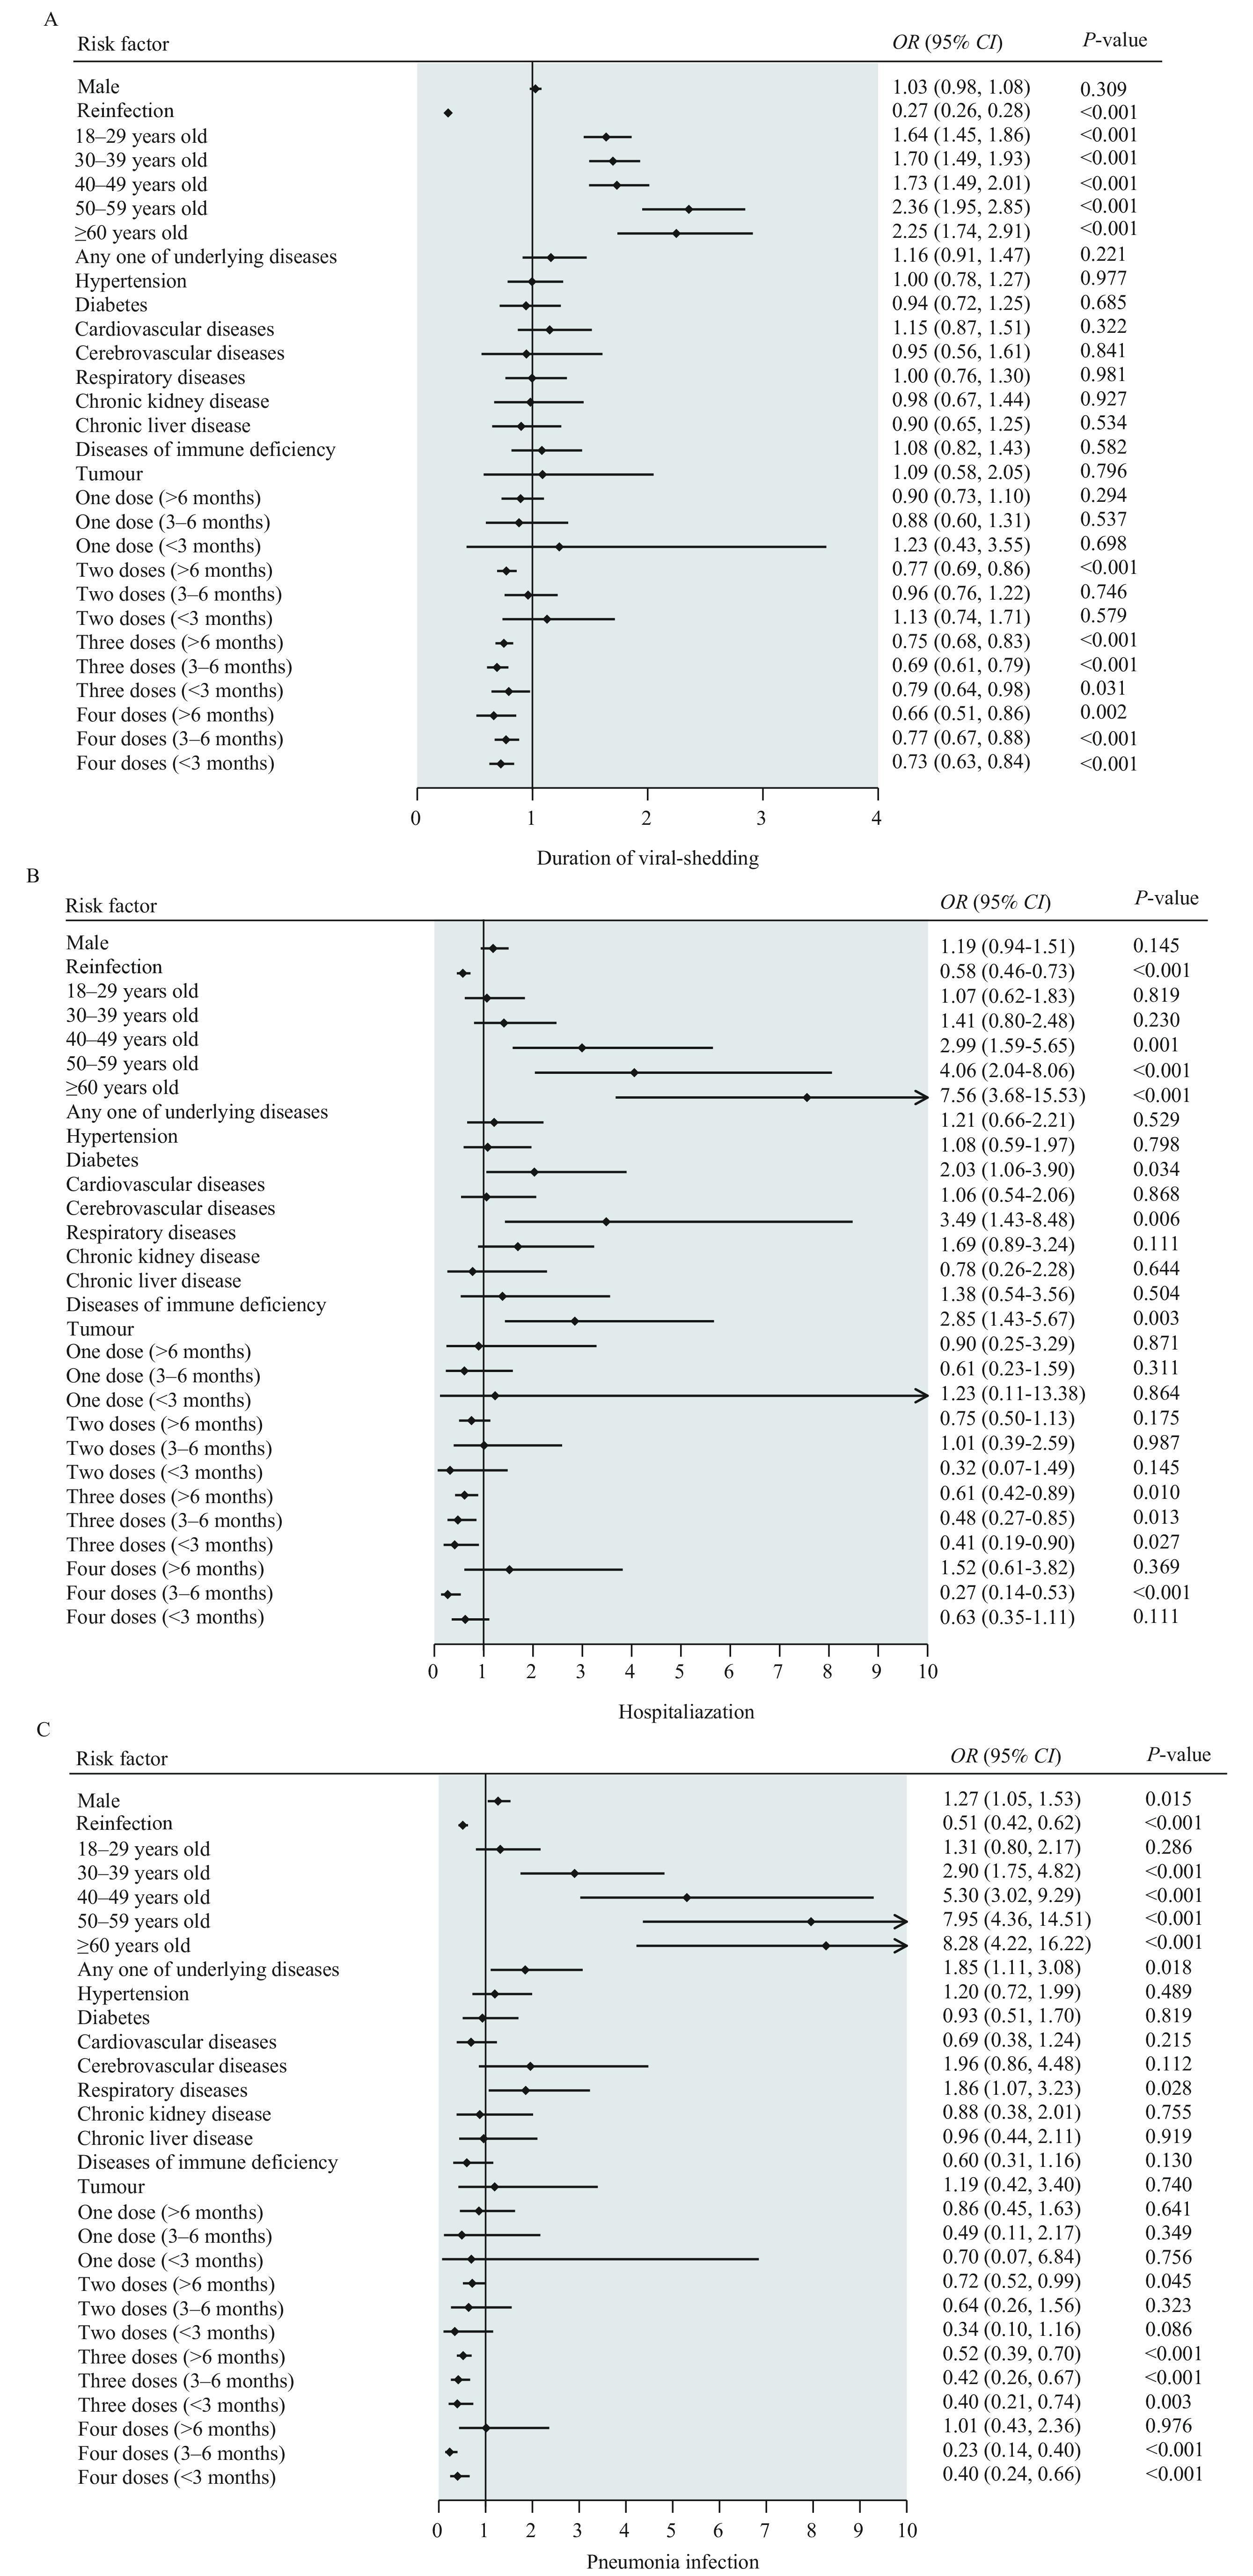 Figure 3.
Risk factors associated with clinical severity in the Chinese mainland from April 1 to May 30, 2023.
Note: Participants were divided into two groups based on the median viral shedding duration. The factors taken into consideration were regions, age, sex, infection history, underlying diseases, and SARS-CoV-2 vaccination status. Additional factors were adjusted in the regression models as confounding variables for each assessed factor.
Abbreviation: OR=odds ratios; CI=confidence intervals.
-
Our study found that among individuals infected with the dominant Omicron variant during the study period in China, the most common acute-phase symptoms were fever, cough, and sore throat. This is not in accordance with a previous meta-analysis (4), which reported that fever, cough, and myalgia were the most prevalent symptoms in initial infections and re-infections. The difference in findings is likely due to the predominance of non-Omicron strains in the studies included in the meta-analysis. In our study, we observed that reinfections had a higher prevalence of upper respiratory symptoms, while initial infections were characterized by a greater presence of general, neurological, and gastrointestinal symptoms. Therefore, it is important to prioritize the management of non-respiratory symptoms in initial infections. Patients with a history of COVID-19, even if they have mild upper respiratory symptoms, should undergo nucleic acid or antigen testing to ensure early detection, diagnosis, isolation, and treatment in order to prevent transmission.
Reinfection was found to be associated with a significant decrease in high fever, hospitalization, ICU admission, and pneumonia. Additionally, it was observed that the number of symptoms and duration of viral shedding were negatively correlated with reinfection. Notably, individuals who had experienced reinfection exhibited lower levels of healthcare-seeking behavior. In line with previous studies, primary infection provided protection against reinfection and contributed to decreased severity of illness (5). In our study, reinfection reduced the risk of hospitalization, ICU admission, and pneumonia by 42%, 89%, and 49%, respectively. This indicates reduced severe illness risk with Omicron reinfection across all age groups, while reduced clinical severity may discourage healthcare-seeking behaviors.
In our study, we found that older age is associated with higher rates of hospitalization, pneumonia, ICU admission, and prolonged viral shedding durations. A previous study has also shown that reinfection in elderly patients increases the risk of mortality, hospitalization, and long-term effects (6). Another observational study conducted in China found that patients aged ≥60 years had longer disease courses and higher rates of respiratory failure compared to younger patients (7). These findings suggest that the elderly population remains highly vulnerable to Omicron variant infections, emphasizing the importance of proactive healthcare-seeking behavior. Additionally, our results indicate that middle-aged individuals have an increased risk of hospitalization and pneumonia. Therefore, we recommend performing chest imaging in patients with typical COVID-19 symptoms, such as cough, shortness of breath, and chest pain, to detect early lung damage and improve outcomes.
Pre-existing underlying diseases have been shown to significantly increase the risk of hospitalization, ICU admission, and pneumonia, consistent with a prospective cohort study that demonstrated the association between comorbidity and hospitalization due to COVID-19 (8). This increased risk can be attributed to compromised immune function and a pro-inflammatory state (9). Our study found that diabetes, cerebrovascular disease, and immunodeficiency disorders increased the risk of hospitalization, while cardiovascular disease increased the risk of ICU admission. These findings underscore the susceptibility of individuals with specific underlying diseases to severe clinical symptoms from SARS-CoV-2 infections, highlighting the need for special clinical attention. Additionally, co-infections with multiple pathogens may potentially impact the assessment of SARS-CoV-2 severity. Timely and comprehensive data on the changing characteristics of respiratory infections are crucial to complement the existing respiratory surveillance mechanisms in the Chinese mainland. Understanding the evolving epidemiological characteristics of respiratory pathogens is essential for implementing measures to mitigate the risk of respiratory diseases. Future studies should collect data on co-infections with multiple respiratory pathogens to accurately analyze these confounding factors.
Our findings demonstrate that vaccination effectively reduces hospitalization, admission to the ICU, and pneumonia in cases of Omicron variant infection. A systematic review revealed that hybrid immunity was 97.4% effective against hospitalization or severe disease 12 months after the primary vaccine series, and 95.3% effective 6 months after the first booster vaccine following the most recent infection or vaccination (10). In terms of magnitude and durability of protection, individuals with hybrid immunity experienced significantly higher levels of protection compared to those with previous infection alone. This emphasizes the importance of vaccination in safeguarding against severe Omicron variant-related illness, even in individuals who have had a previous infection (10).
In our study, only 73.79% of participants completed the primary vaccine series, with 57.13% receiving their last vaccination more than 6 months prior to completing the questionnaire. To maintain effective immunization coverage, interventions are needed to promote timely vaccine uptake among priority populations.
This study has several limitations. First, the ratio of symptomatic to asymptomatic patients may not accurately represent real-world conditions due to potential selection bias among participants who completed the online questionnaire, as they are more likely to have symptoms. Secondly, there may have been errors in recall accuracy, leading to underestimation or overestimation of certain factors. Lastly, the use of online social media-based surveys can introduce user and selection bias. To address this, we allowed co-habitants to participate in the survey. However, given that most participants were under 40 years of age, we conducted a stratified analysis based on different age groups and included age as a confounding factor in the multivariate analysis.
-
No conflicts of interest.
-
This study collected data based on an online questionnaire on Sina Weibo, thank all the participants who contributed to the study by collecting and sharing data.
HTML
| Citation: |

|