Download:


-
Several studies have found greenness to be associated with a lower risk of childhood-onset asthma (1). However, limited evidence has been available on the influence of greenness on asthma onset during adulthood, especially in the middle-aged and elderly. Different from childhood-onset asthma, adult-onset asthma is less associated with allergic and atopic diseases. In addition, adult-onset asthma is accompanied by a faster decline in lung function, poorer prognoses, and more severe airflow limitation. Considering the higher risk of asthma-related morbidity and mortality among elderly asthmatics, paying more attention to asthma in older people is critical. Based on the China Health and Retirement Longitudinal Study (CHARLS) from 2011 to 2018, a per 0.1-unit increase in annual normalized difference vegetation index (NDVI) was associated with a hazard ratio (HR) of 0.840 [95% confidence interval (CI): 0.774, 0.991] for asthma in fully adjusted models. The exposure-response curve showed that the HR of asthma decreased with increasing NDVI. These findings have substantial significance for guiding environmental policymaking in city planning and public health protection.
The participants in the study were from CHARLS, which is a nationally representative longitudinal survey of the middle-aged and elderly population (≥45 years old) in China. Further details about CHARLS were detailed elsewhere (2). Greenness exposure was measured by NDVI, which calculates the ratio of the difference between the near-infrared region and red visible reflectance to the sum of these two measures, ranging from −1.0 to 1.0, with larger values above zero indicating higher levels of vegetative density. Negative NDVI values are often regarded as blue space or water; values near zero are often bare ground or buildings. The long-term vegetation index dataset of China, SPOT VEGETATION NDVI, which has a spatial resolution of 1 km and a temporal resolution of 10 days, was used to assess greenness (3). The estimations for fine particulate matter (PM2.5), ozone (O3), and nitrogen dioxide (NO2) have been detailed elsewhere (4–6). Meteorological indicators, including annual average temperature, annual average relative humidity, and annual precipitation, were obtained from the China Meteorological Data Sharing Service System (
http://www.nmic.cn/ , accessed on June 1, 2021). Annual NDVI, PM2.5, O3, NO2, and meteorological indicators for individual adults were estimated at participants’ residential cities. Gross Domestic Product (GDP) was obtained from the China Statistical Yearbook and assigned to participants according to their residential cities. All participants involved in CHARLS were asked “Have you been diagnosed with asthma by a doctor?” in each interview. Participants with affirmative answers were classified as having asthma.Time-varying Cox proportional hazards models with time-varying exposures on an annual timescale were used to estimate the associations between greenness and the risk of asthma. The geographic coordinates of the participants were not available due to confidentiality. To verify the reliability of the results, this study used regression calibration to calibrate the measurement error (7). The greenness exposure is represented as W=X+U; where W is city-level exposure, X is individual exposure, and U is the additive classic measurement error which is a normal distribution with the mean is 0 and the standard deviation is σ. The NDVI data have the standard deviation within all cities ranging from 0.03 to 0.30 and were used in the regression calibration. Potential effect modification was examined based on covariates. All statistical analyses were performed with R software (version 4.1.0, R Foundation for Statistical Computing, Vienna, Austria). The Cox proportional hazards models with time-varying exposures were conducted with the “survival” package. A two-sided P-value <0.05 was considered statistically significant.
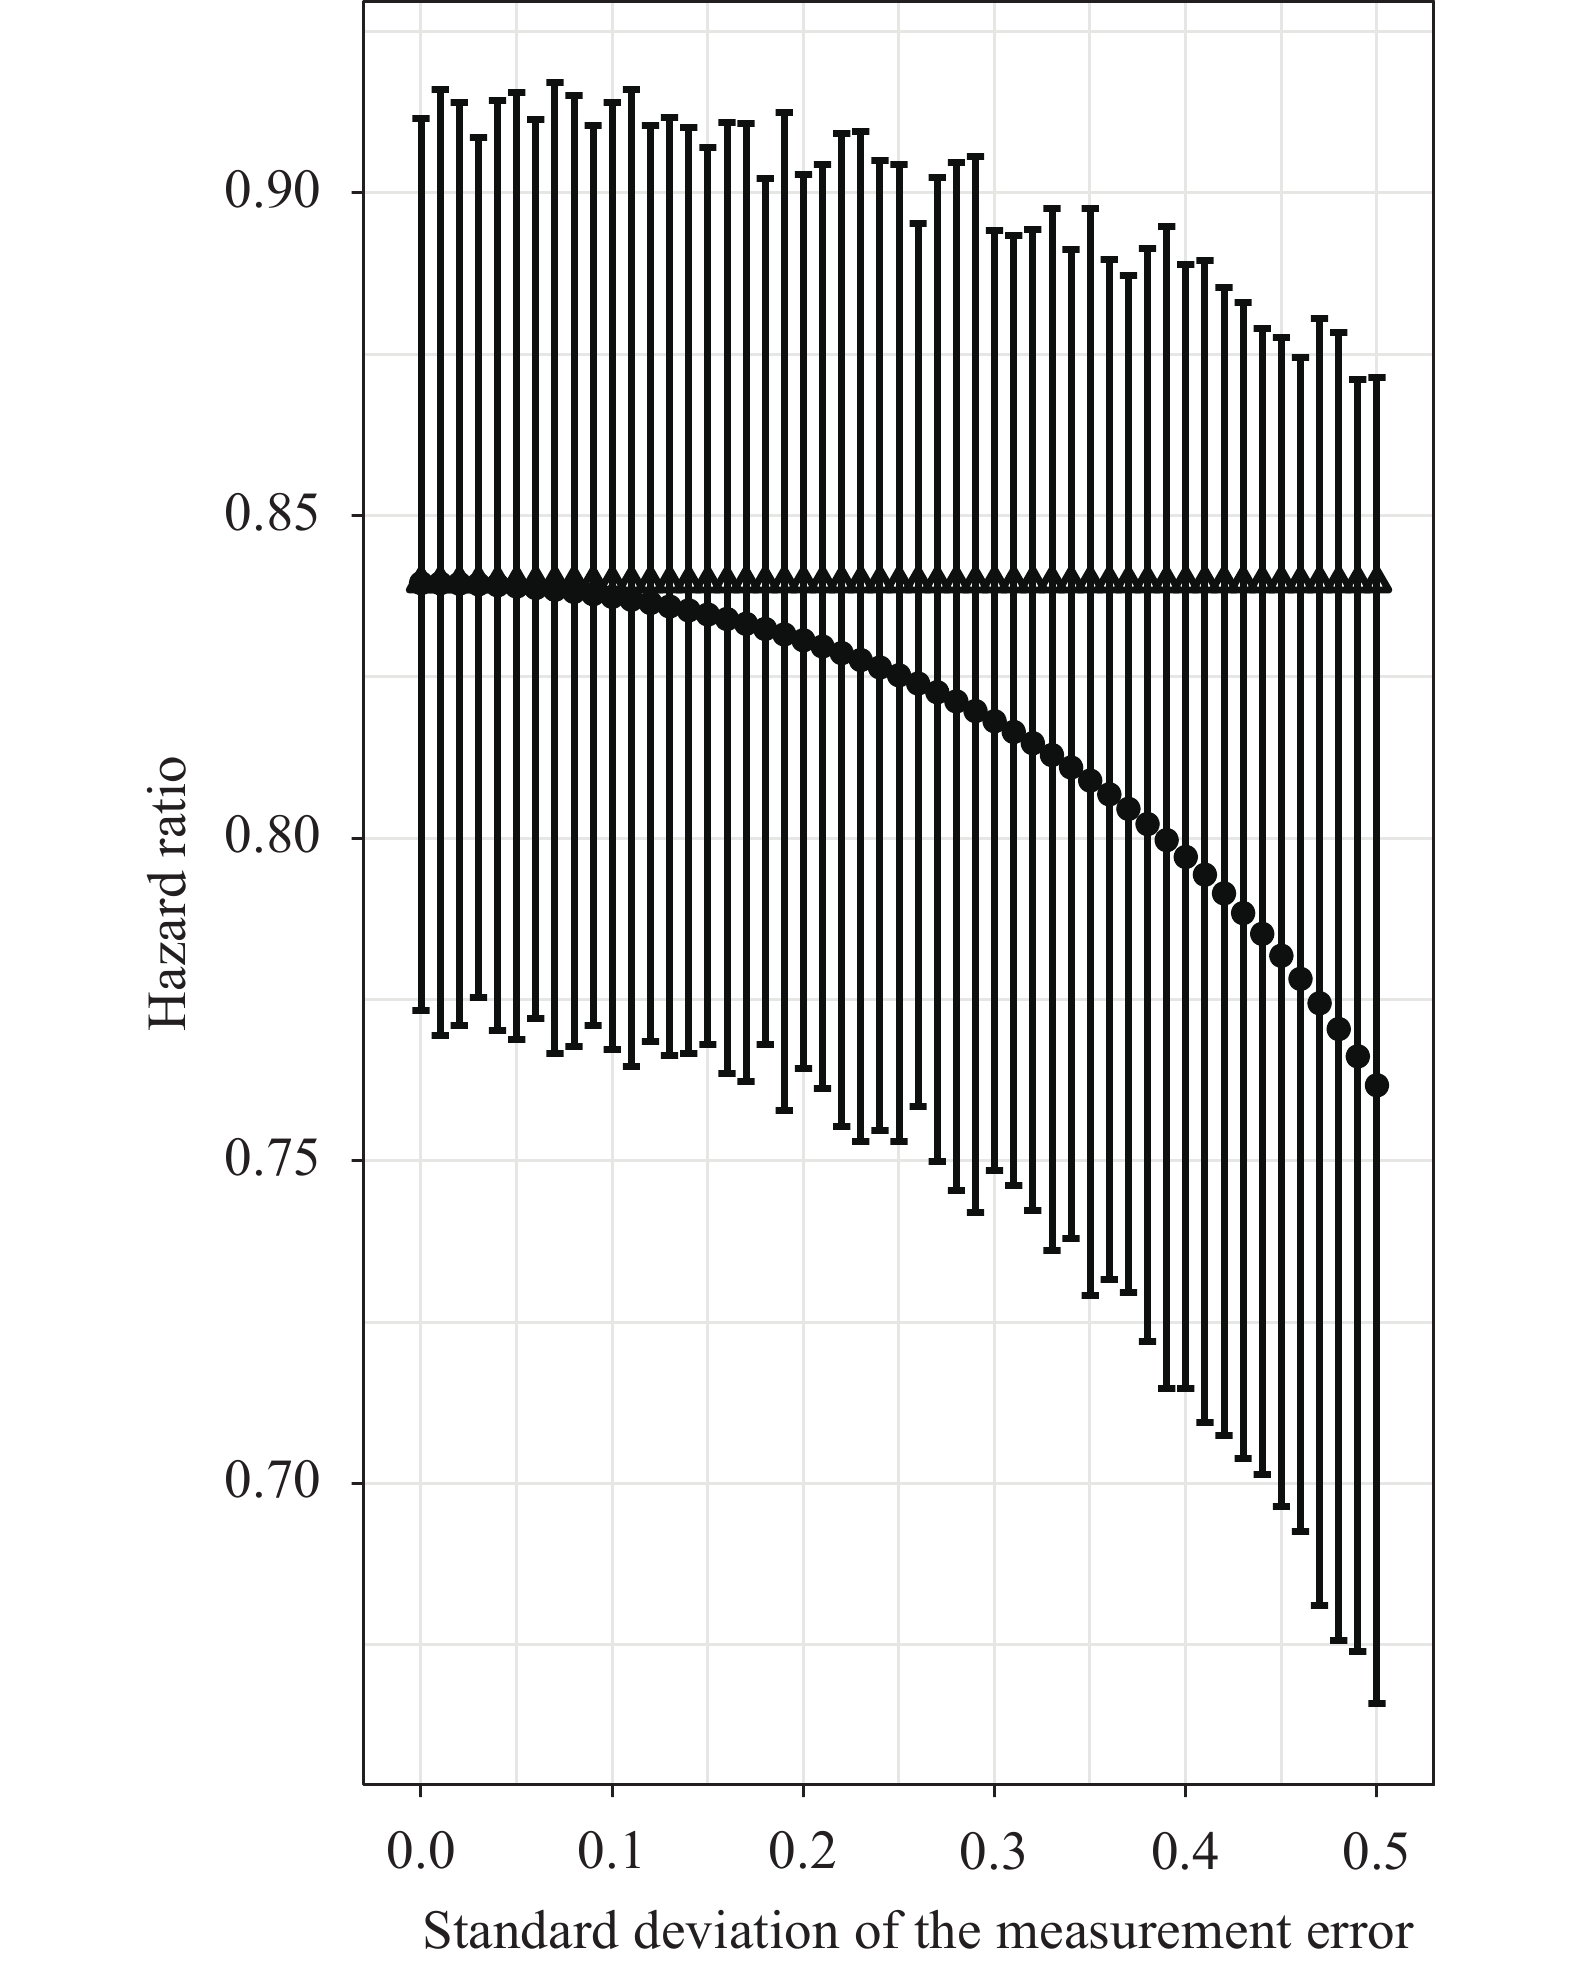
A total of 670 new-onset asthma cases from 17,574 adults were observed during a mean of 6 years of follow-up (Table 1). The association between greenness and the risk of asthma is shown in Table 2. The exposure-response curve showed that the HR of asthma decreased with NDVI increasing, and the HR decreased more slowly at higher NDVI (Figure 1A). After regression calibration, the HR decreased with the standard deviation of the measurement error increasing (
Supplementary Figure S1 ). However, at the highest standard deviation of the measurement error, less than a 5% difference between the result of city-level exposure and the regression calibration value was observed. Thus, the results of city-level exposure in this study were convincing and relatively conservative. The associations were significantly stronger in adults with lower household income (P-interaction=0.035) and nonsmokers (P-interaction=0.049) (Figure 1B).Variables Descriptive characteristics Study participants Participant counts 17,574 Counts of asthma 670 Total person-year 106,716 Age, ≥60 years, % 41.08 Female, % 51.73 Rural area, % 60.16 BMI, <24 kg/m2, % 53.06 Illiteracy, % 26.48 Lower income, % 48.35 Disability, % 16.92 Smoking status, % 36.77 Alcohol consumption, % 42.34 Solid cooking fuel, % 51.63 Sleep duration, <7 hours, % 46.17 Environmental exposure NDVI, median (IQR) 0.77 (0.08) PM2.5, μg/m3, median (IQR) 42.69 (30.56) O3, μg/m3, median (IQR) 85.77 (17.24) NO2, μg/m3, median (IQR) 21.12 (8.32) Annual precipitation, cm, median (IQR) 14.22 (19.35) Annual average temperature, ℃, median (IQR) 15.83 (5.00) Annual average relative humidity, %, median (IQR) 70.38 (15.23) Abbreviation: NDVI=normalized difference vegetation index; IQR=interquartile range; PM2.5=fine particulate matter; O3=ozone; NO2=nitrogen dioxide; BMI=body mass index. Table 1. Descriptive characteristics of the study participants and environmental exposure.
NDVI Number of
eventsModel a Model b Model c HR (95% CI) P value HR (95% CI) P value HR (95% CI) P value Continuous NDVI (per 0.1-unit increase) 670 0.88 (0.81, 0.95) 0.001 0.84 (0.77, 0.91) <0.001 0.86 (0.77, 0.96) 0.005 Quintile 1 (0.167–0.717) 144 1 1 1 Quintile 2 (0.717–0.757) 104 0.67 (0.52, 0.86) 0.002 0.64 (0.50, 0.83) 0.001 0.67 (0.51, 0.87) 0.002 Quintile 3 (0.757–0.784) 148 0.86 (0.68, 1.08) 0.202 0.78 (0.62, 0.99) 0.040 0.74 (0.57, 0.95) 0.020 Quintile 4 (0.784–0.819) 140 0.79 (0.61, 1.01) 0.056 0.75 (0.58, 0.96) 0.026 0.78 (0.59, 1.03) 0.084 Quintile 5 (0.819–0.878) 134 0.68 (0.52, 0.87) 0.003 0.64 (0.49, 0.83) 0.001 0.65 (0.59, 0.87) 0.004 P trend* 0.008 0.002 0.008 Note: Model a as minimally adjusted model included age, sex, region of residence (urban/rural), and GDP. Model b was a fully adjusted model additionally adjusted for BMI, education level, household income, smoking status, alcohol consumption, cooking fuel, disability, sleep duration, time-varying PM2.5, and time-varying annual precipitation. Model c was further adjusting for O3 and NO2 based on Model b.
Abbreviation: NDVI=normalized difference vegetation index; HR=hazard ratio; CI=confidence interval; BMI=body mass index; GDP=Gross Domestic Product; PM2.5=fine particulate matter; O3=ozone; NO2=nitrogen dioxide.
* Test for trend is based on the median value for each quintile.Table 2. Associations between greenness and risk of asthma.
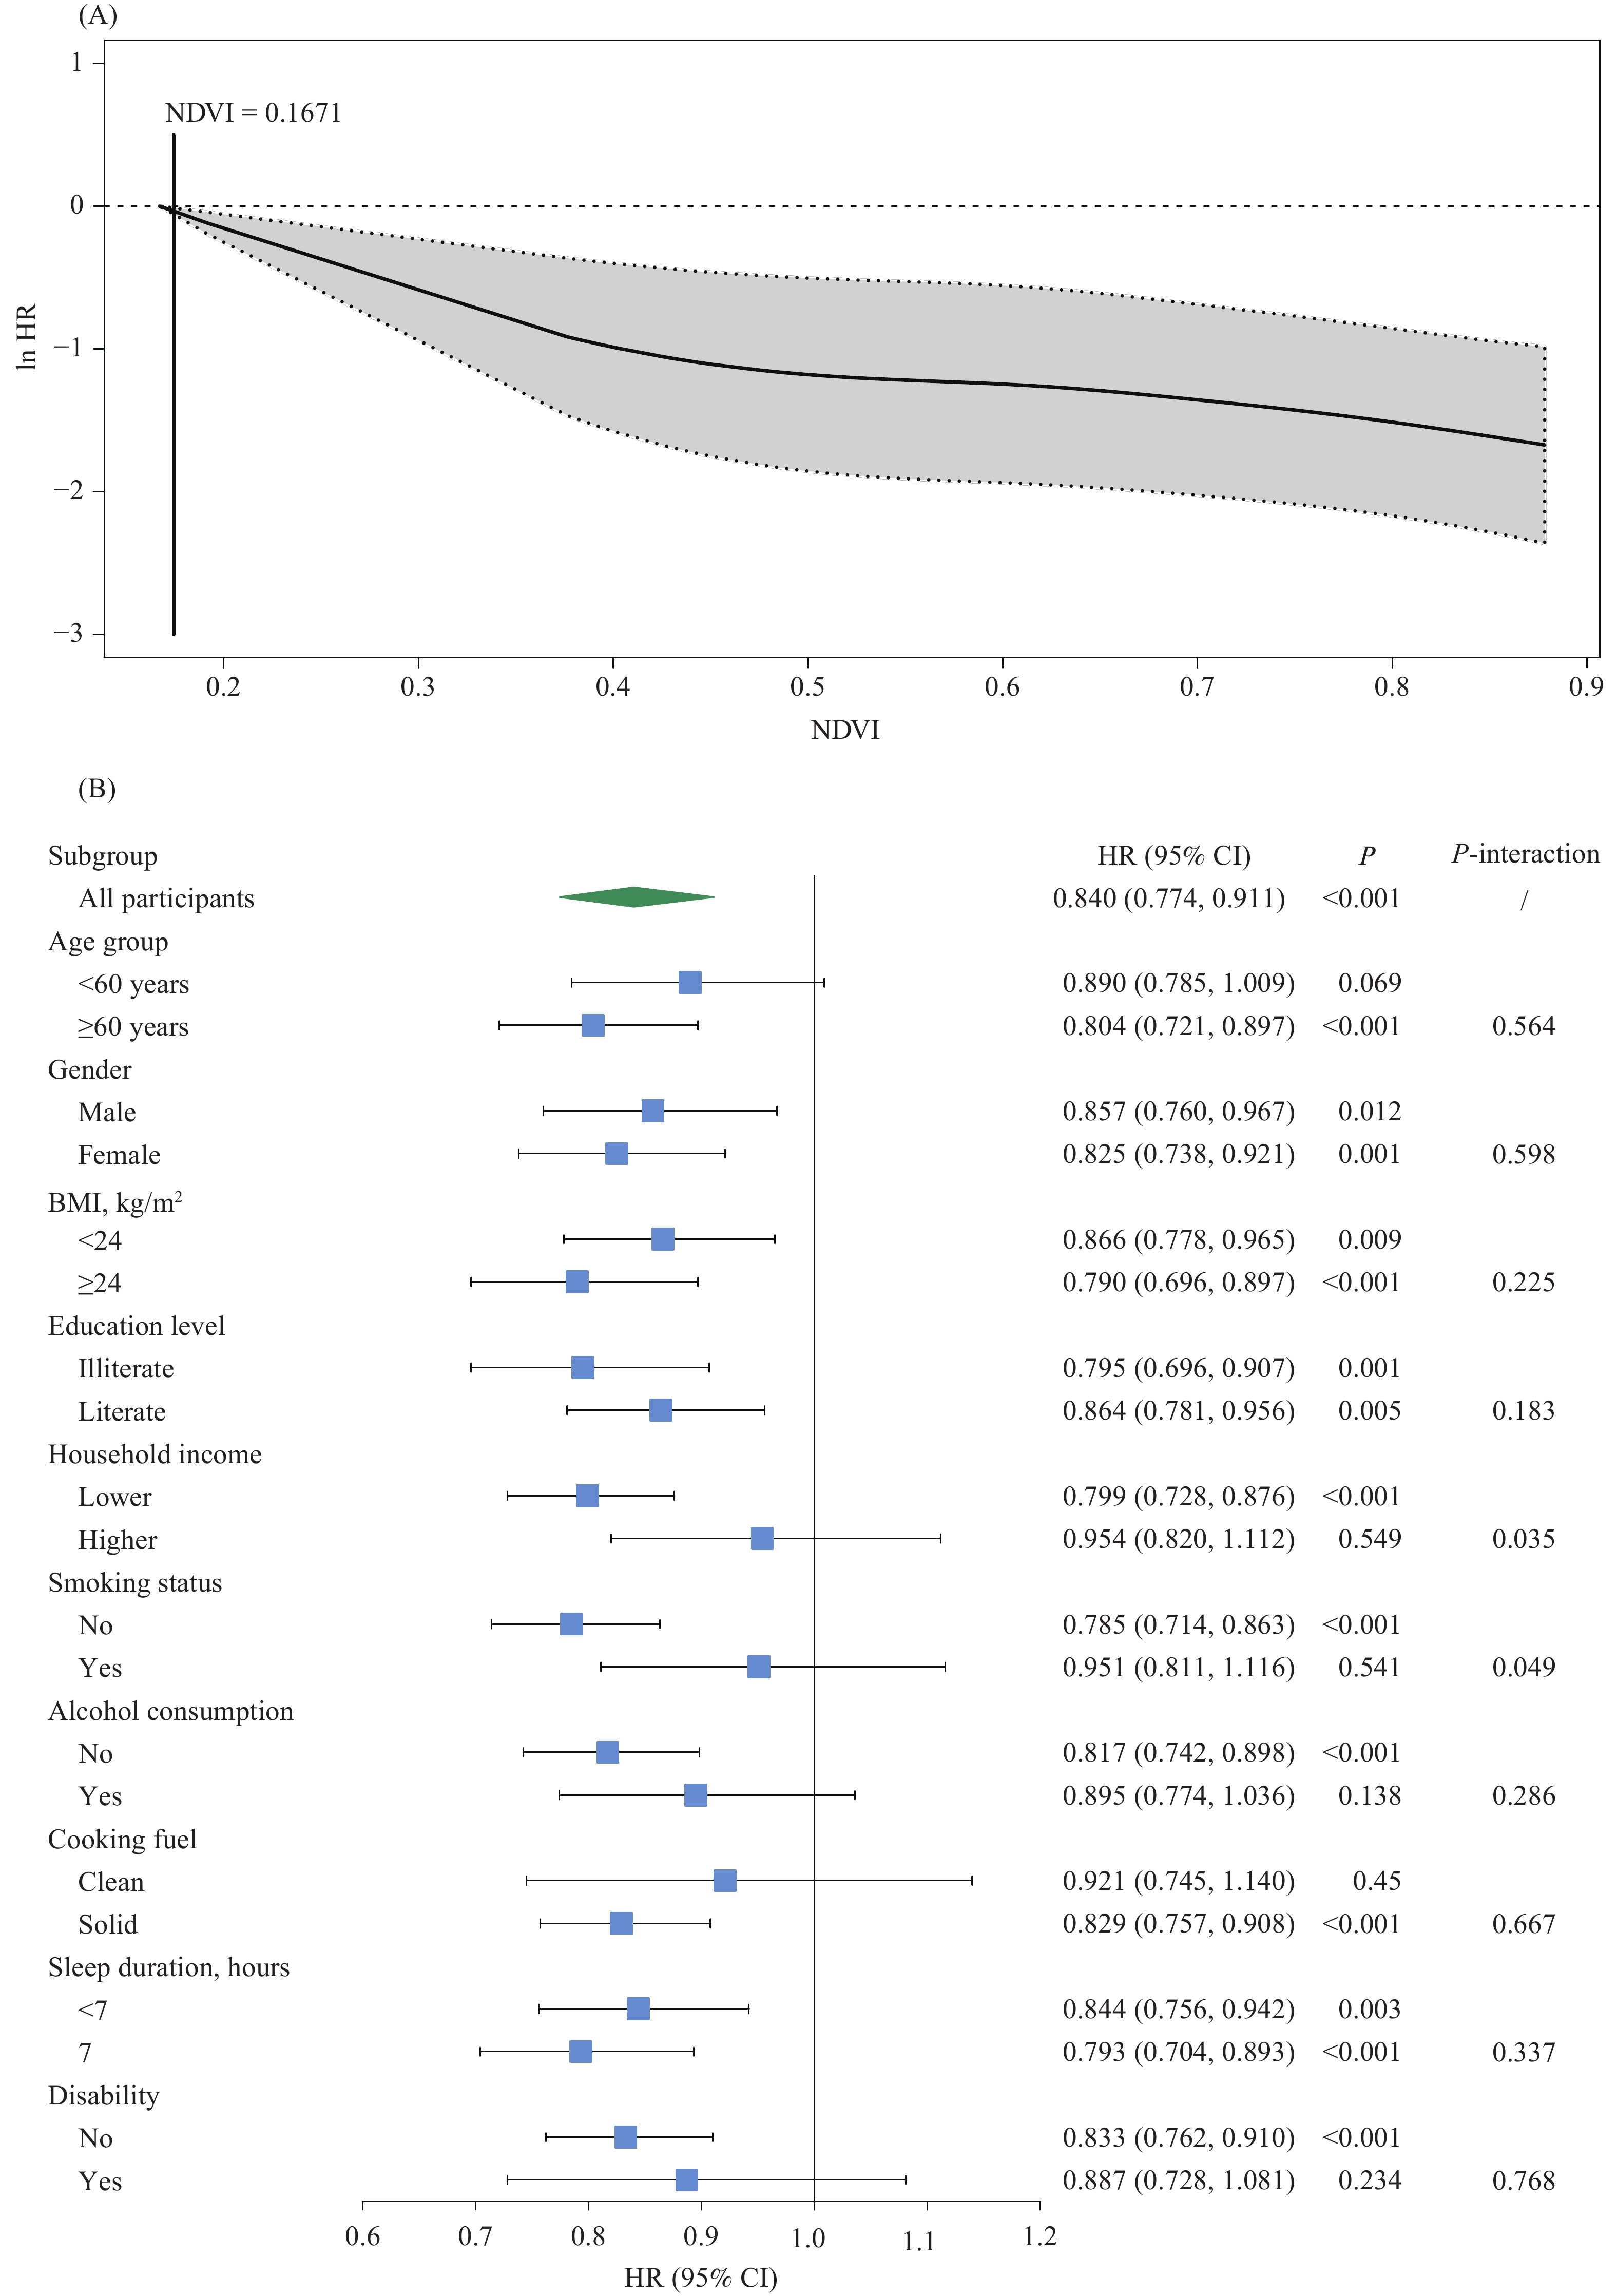 Figure 1.
Exposure-response curve and subgroup analyses. (A) Exposure-response curve for the association between greenness and risk of asthma. (B) Subgroup analyses of HR (95% CI) for asthma with per 0.1-unit increase in NDVI according to the characteristics at baseline.
Abbreviation: HR=hazard ratio; CI=confidence interval; BMI=body mass index; NDVI=normalized difference vegetation index. -
This prospective cohort study among the middle-aged and elderly population suggests that greenness is associated with a lower risk of asthma and the exposure-response curve shows the risk of asthma decreasing monotonically with greenness increasing.
Recently, a large cross-sectional study reported the findings from UK Biobank that higher levels of residential greenness exposure were associated with a lower risk of asthma among adults aged 37 to 73 years (8). However, the cross-sectional design restricted the inference of temporal or causal relationships. The findings from this prospective cohort study are more convincing in causal inference, strengthening the evidence on the protective effect of greenness on asthma in adults.
Although less is known about the biological plausibility of the observed association, there are several possible mechanisms. Trees and forests may reduce adverse health effects by reducing air pollution. Moreover, considering the beneficial association between greenness and lower body weight, and the fact that obesity is a risk factor for the development of asthma in adulthood, greenness may reduce the risk of asthma by regulating obesity. In addition, green spaces may host a high diversity of environmental microbiota, which may mediate biodiversity effects on human health, including asthma, through their impact on the immune system. Alongside this, the lower risk of asthma associated with greenness may be mediated by reduced psychological stress, which is increasingly recognized as a risk factor for incident asthma (9), since the potential benefits of residential greenness on stress have been identified. Finally, increased access to greenness was associated with a higher likelihood of participating in physical activities, which may further improve human health. Further studies about the underlying mechanisms accounting for the association between greenness and asthma need to be conducted.
Greenness showed a stronger effect among adults with lower household incomes, which may be associated with the socioeconomically disparate situation in China. China has witnessed increasingly rapid urbanization in recent years, which has resulted in an imbalance in the distribution and composition of green spaces. Adults of lower socioeconomic status tend to have more access to green spaces with a high diversity of environmental microbiota. In addition, the effect of greenness on asthma was stronger in nonsmokers. Smoking increases oxidative stress and has pro-inflammatory effects on the lungs, accelerating the normal annual decline in lung function and increasing the risk of airway obstruction, which are changes that predispose the development of asthma. Although greenness was probably a protective factor for asthma, the adverse health effect caused by smoking was so strong that the health benefits from greenness were attenuated greatly.
This study has several strengths. First, this is the first study to investigate the association between greenness and risk of asthma in the middle-aged and elderly population worldwide. Furthermore, a prospective cohort design was used, which is more convincing in causal inference. In addition, the study included a large and population-based sample from 125 cities and 28 provincial-level administrative divisions (PLADs) in China, providing nationally representative panel data (2). Finally, this study included a wide range of individual- and area-level covariates to control for potential confounding.
There are also some limitations to this study. First, since the exact residential addresses of participants are concealed in CHARLS, this study was unable to obtain the precise exposure. City-level measured exposures may introduce misclassification in exposure evaluation. However, such exposure misclassification tends to be non-differential and thus biases the results towards the null. Furthermore, the results of the regression calibration indicated that this study’s findings are convincing and relatively conservative. Second, the outcome definition relied on doctor-diagnosed self-reported asthma, lacking more objective definitions, which may underestimate the incidence of asthma in China. Nevertheless, the overall prevalence of asthma between 2011 and 2018 in CHARLS was 6.1%, which is similar to a large cross-sectional study in China, indicating that the quality of investigation for asthma in CHARLS is credible (10). Third, greenness was assessed with NDVI, which is unable to distinguish the structure of green spaces, making it difficult to determine whether different types of vegetation have variations in the association between greenness and asthma. Fourth, although a wide range of individual- and area-level covariates were included to control for potential confounding, residual confounding could not be excluded.
HTML
| Citation: |

|