Download:


-
The ongoing global pandemic of coronavirus disease 2019 (COVID-19) caused by severe acute respiratory syndrome coronavirus 2 (SARS-CoV-2) has caused incredible global disruption and challenges with a substantial impact on public health and healthcare systems (1). As of March 2022, the world has reported over 460 million confirmed COVID-19 cases and 6 million deaths in over 200 countries and regions (2 ). At the same time, China has had the most severe COVID-19 outbreak since the original wave from Wuhan, driven by the Omicron variant, resulting in lockdowns in Shanghai Municipality, Shenzhen City, and Jilin Province (3-4). For regions with high importation risk, stringent measures (e.g., reduction of international flights, post-arrival quarantine, and strict surveillance) can be applied to earn more time for preparedness and response (5-6). In support of this, this study estimates importation and exportation risks of various regions using nationwide mobility data in China: using Changchun City and Jilin City in Jilin Province as a case study.
-
This study analyzed the daily number of passengers traveling between 367 prefectures (cities) in China, including 4 municipalities, 1 special administrative region, 332 prefecture-level divisions, 6 autonomous counties, and 24 county-level cities and centrally administered municipalities.
The mobility data were from a national mobile phone carrier (China Unicom), with 318 million active users in 2019, during the period from January 7 to 13, 2020 (7-8). When users made phone calls, sent messages, turned on/off their devices, or switched towers, the national mobile phone carrier collected their location information (8-9). The dataset was anonymized so that this study cannot identify or filter users of certain groups. The dataset includes approximately 100 million daily between-city trips, without overseas mobility. This research assumed that the mobility between cities for each week in this study’s following simulations is the same as the study week. -
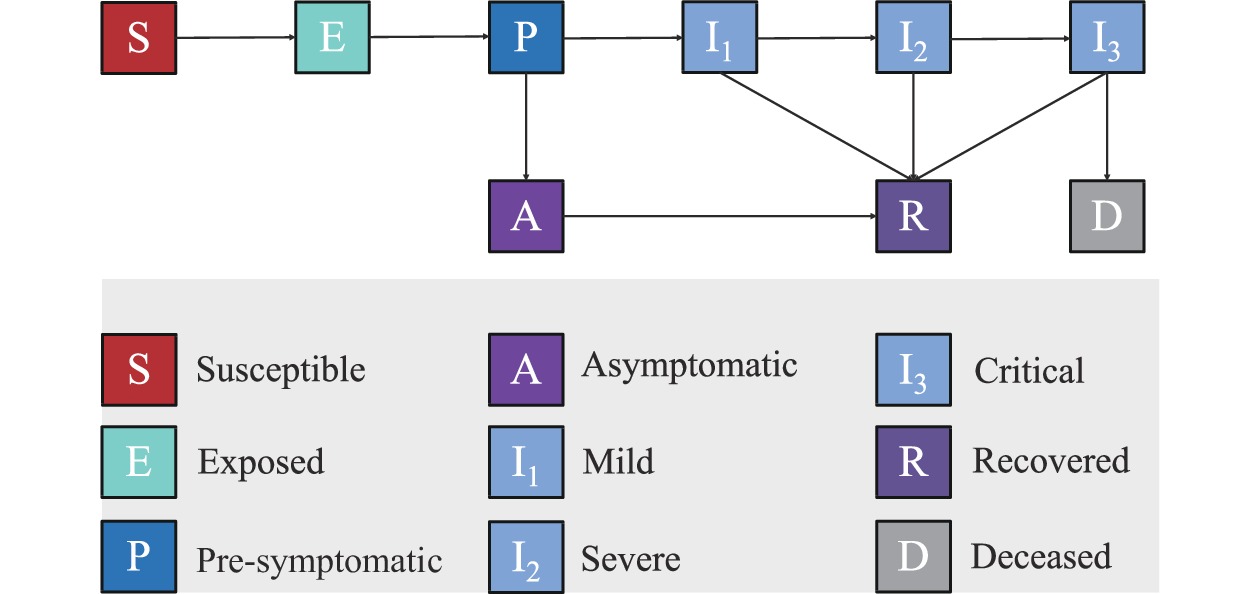
Following the Covasim model structure, this study used a stochastic metapopulation model of COVID-19 transmission (
Supplementary Figure S1 ) (10). The population is characterized as either susceptible (S), exposed (E, infected but not yet infectious), infectious (I), recovered (R), and deceased (D), with infectious population additionally categorized according to symptoms: pre-symptomatic (P), asymptomatic (A), mild (I1), severe (I2), or critical (I3). This study set initial cases (one seed per million population) for each prefecture (city) to simulate the daily situation of disease transmission. Then, this study evaluated the mean and 95% confidence interval (CI) of the daily infected cases based on 100 simulations. Specifically, this simulation calculated the number of infected cases without severe or critical symptoms in city i at time t as follows:$$ \Lambda_{i}(t)=E_{i}(t)+P_{i}(t)+A_{i}(t)+I_{1, i}(t) .$$ (1) The prevalence
$ \xi_{i}(t) $ of infected cases in prefecture (city) i at time t is given by:$$ \xi_{i}(t)=\frac{\Lambda_{i}(t)}{\rho_{i}} $$ (2) where
$ \rho _i $ represents the population size of prefecture (city) i. This study then constructed an intercity mobility network to track the movement patterns of individuals between cities. Let$ \omega_{o, d}(t) $ denote the number of residents from the origin prefecture (city) o that travel to the destination prefecture (city) d on day t. Given the daily prevalence$ \xi_{o}(t) $ of prefecture (city) o, the rate at which infected residents from prefecture (city) o travel to prefecture (city) d on day t is given by$ \vartheta_{o, d}(t)=\xi_o(t)\times \omega_{o,d}(t) $ . The potential of importing at least one infected case from prefecture (city) o to prefecture (city) d on day tu, is given by (3 ,11 ):$$ \psi_{o,d}\left(t_{u}\right)=1-\exp \left[-\vartheta_{o,d}\left(t_{u}\right)\right]. $$ (3) The cumulative probability of importing at least one infection from prefecture (city) o to prefecture (city) d between t0 and tu is given by:
$$ \kappa_{o, d}\left(t_{u}\right)=1-\operatorname{exp}\left[-\int_{t_{0}}^{t_{u}} \vartheta_{o, d}(u) d u\right] .$$ (4) For each epidemic origin, this study conducted 100 stochastic simulations across 4 months (120 days). In each simulation, the prefecture (city) d has at least 1 infected case on or by day tu when incorporating the probability
$ \psi_{o, d}\left(t_{u}\right) $ or$ \kappa_{o, d}\left(t_{u}\right) $ , respectively. This study tracked the geographic expansion of simulated epidemics by taking each prefecture (city) as an epidemic origin (epicenter). To compare the epidemic growth across outbreak scenarios, this study measured the time until a certain percentage of prefectures (cities) with importations reaches specified thresholds, such as T=50%, and denoted this quantity as ΓT to measure the exportation risk. To assess the epidemiological vulnerability of a specific location l, this study tracked the days until l becomes infected under various scenarios as the importation risk,$\chi $ . Matlab (version R2021b, The MathWorks, Massachusetts, US) was used for analyzing mobility data and simulating the epidemic transmission model. -
For each possible importation location of 367 prefectures (cities), this study simulated epidemics using a stochastic epidemiological model over three transmission scenarios for the Omicron variant (different R0): running 100 simulations for each scenario (parameters are in
Supplementary Table S1 . Under the middle transmission scenario (R0=5.49), the cumulative infections of Changchun are estimated as 3,233 (95% CI: 1,480, 4,986) before the quarantine was imposed on March 14, 2022, which is close to the real number of cases, 3,168, reported by March 16, 2022 (12-13). This study shows the results of the middle transmission scenario in the main text and the sensitivity analysis in the supplementary.This study estimated importation and exportation risk (Figure 1), finding that epidemics tend to spread fastest and in the shortest amount of time when imported or exported from Beijing or Shanghai. The rates at which epidemics spread from and to each prefecture (city) are highly correlated to prefectures (cities) with larger population sizes. For R0=5.49, 127 (35%) of 367 cities have high exportation risks and could transmit the disease to 50% of all other locations within a period from 17 to 94 days. The population sizes in the 127 prefectures (cities) with high exportation risks are around 5.69 million (95% CI: 2.08, 7.88). As a comparison, population sizes in the remaining 240 prefectures (cities) are much smaller, within 2.24 million (95% CI: 0.10, 6.09) (
Supplementary Table S2 ). The importation risk, as the average time until a new infection arrives in a location in 1 of the 367 prefectures (cities), ranges from 26 to 101 days. The correlation coefficients between the population size and days of the importation and exportation risks are –0.56 and –0.77, respectively (both with P<0.001). These patterns also hold for other transmission scenarios (Supplementary Figure S2 ). The importation and exportation transmission risks in China are highest for outbreaks starting in Beijing and Shanghai, in terms of both geography and the underlying mobility network. In the case study of Changchun, if a city lockdown is implemented two weeks after the seeds are imported, on average 16 (95% CI: 12, 19) cities will then have imported cases from a random city. If a city lockdown is implemented one week earlier or later, on average 1 (95% CI: 1, 2) and 92 (95% CI: 86, 99) cities will have imported cases, respectively.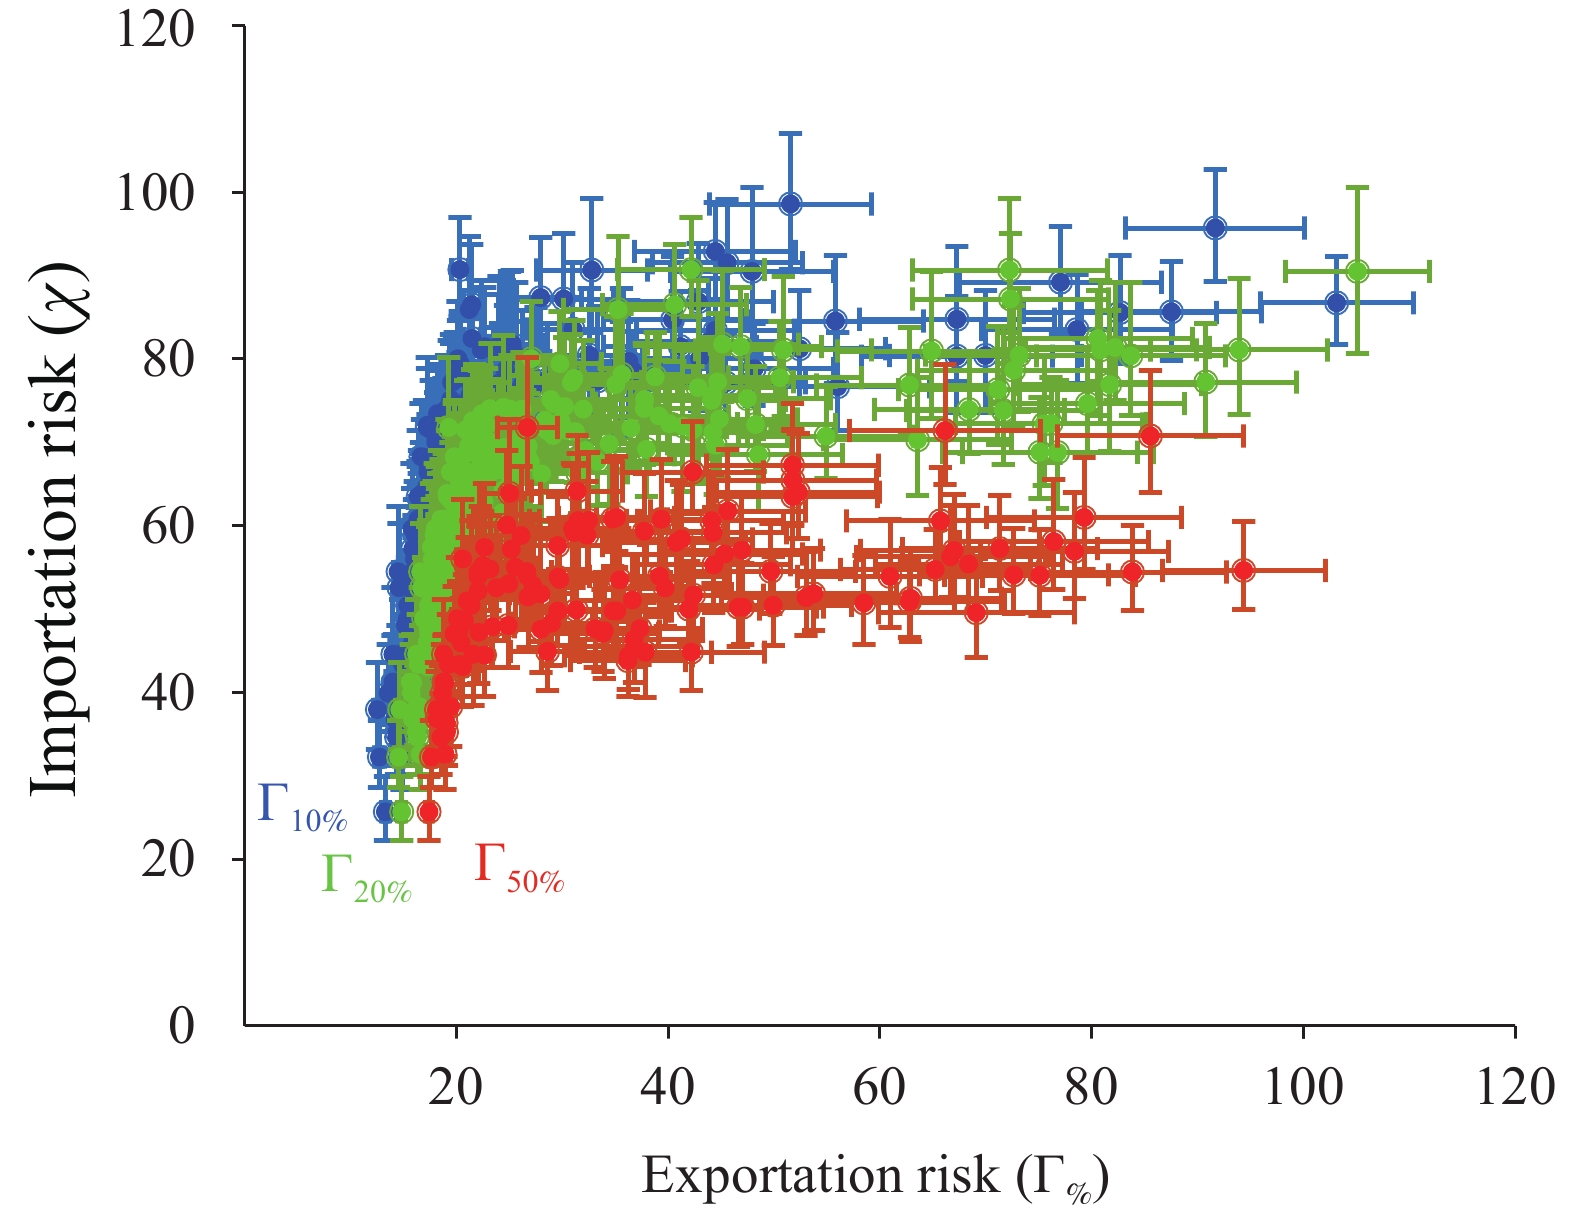 Figure 1.
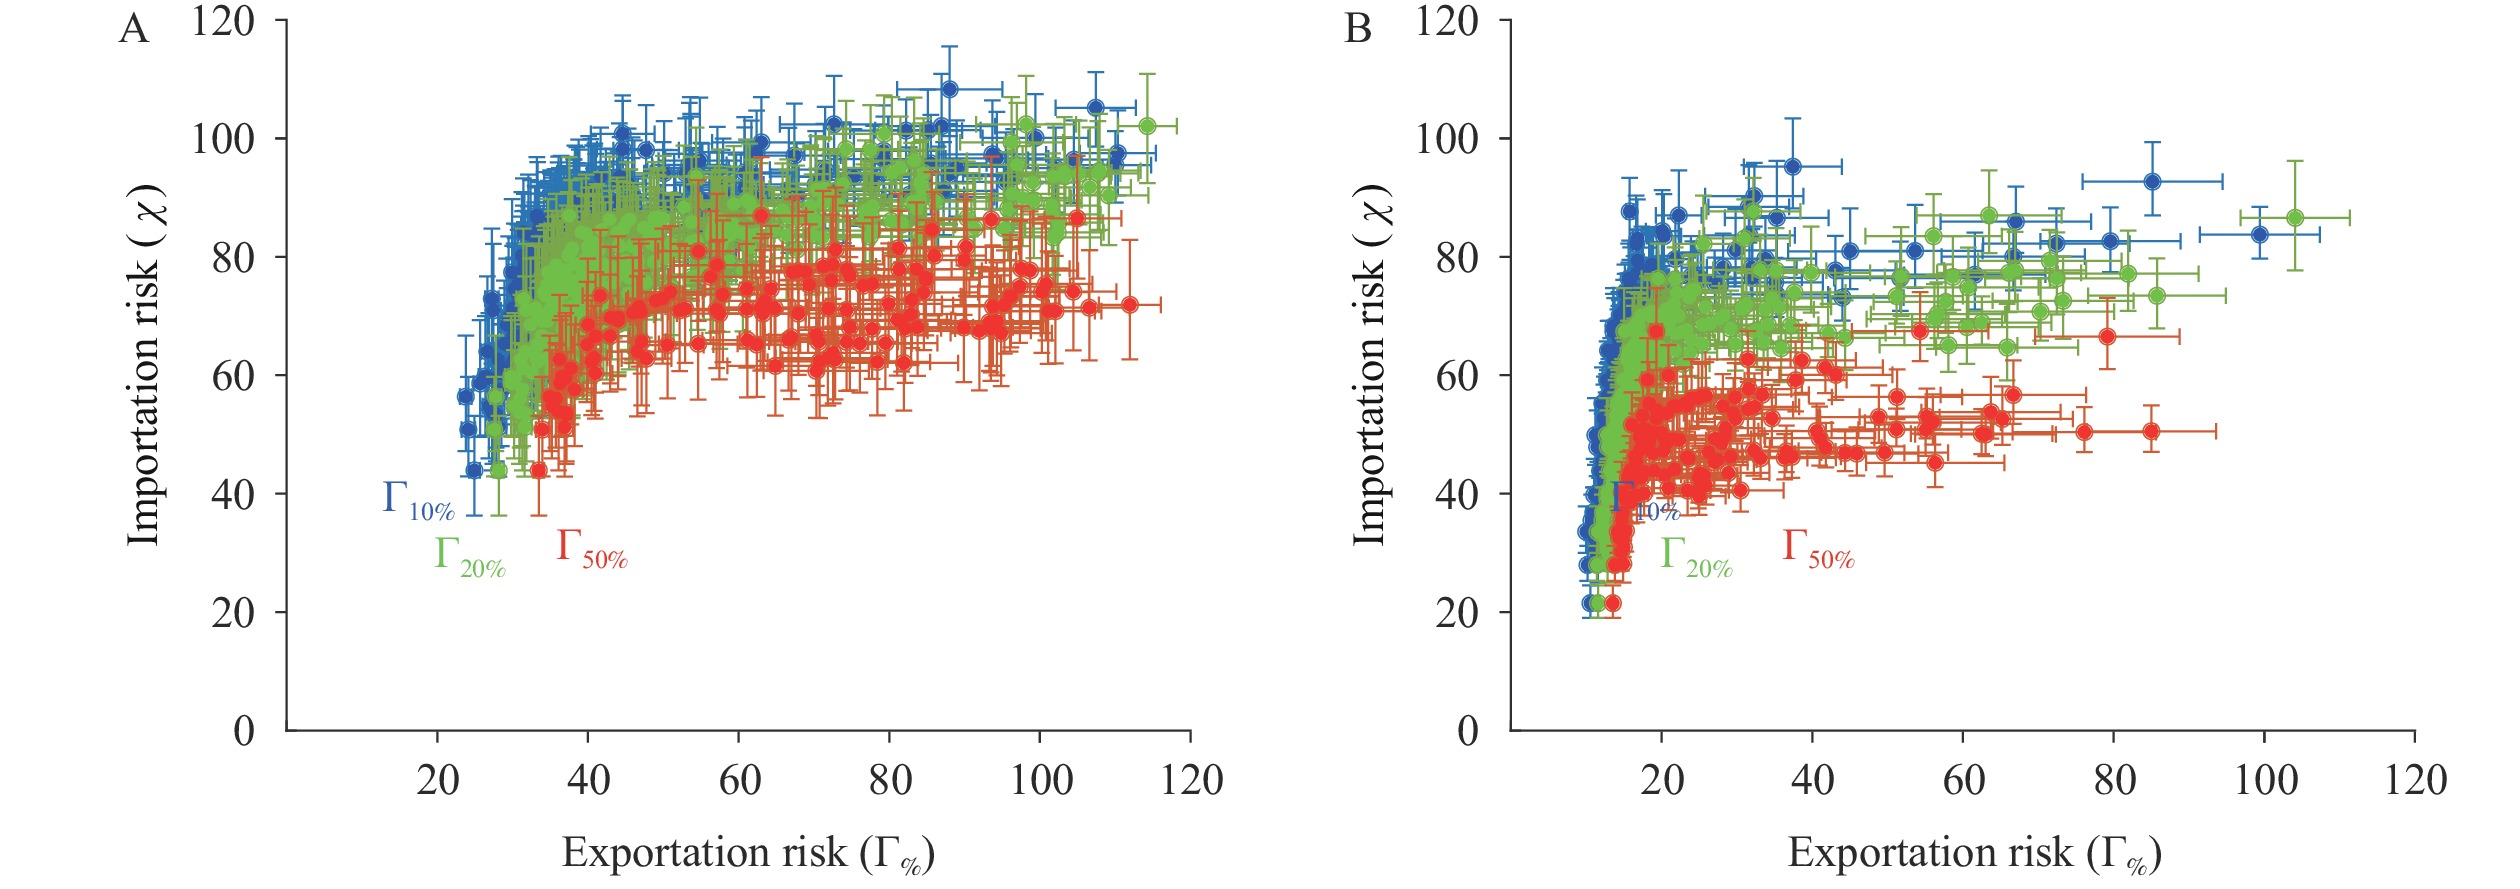
Risks of epidemic importation and exportation transmission.
Note: For each prefecture (city), the mean and 95% confidence interval (CI) of the exportation risk (x-axis) are estimated by the number of days following an importation into that prefecture (city) until 10%, 20%, and 50% of prefectures (cities) experience outbreaks (Γ10%, Γ20%, and Γ50%), averaged over 100 stochastic simulations.The mean and 95% CI of the importation risk (y-axis) are estimated by the number of days following importation in another prefecture (city) until the focal prefecture (city) receives its first infection, averaged over 100 stochastic simulations. All simulations assume an initial outbreak of R0=5.49; analogous graphs for other R0s are provided in Supplementary Figure S2. The importation and exportation risks are correlated with a Pearson’s correlation coefficient of 0.72, and to population size of the prefecture (city) with coefficients of −0.56 and −0.77, respectively (all have P value <0.001). This study provided a data-driven modeling approach to tailoring importation and exportation risks, using Changchun and Jilin City in Jilin Province as examples (Figure 2). If transmissions start from Changchun, Harbin and Siping will have the highest probability that >1 person infected with the Omicron variant arrives from Changchun: both have a probability above 50% by March 6, 2022. In contrast, if starting from Jilin, Changchun and Harbin will have the highest probability of importation. If city lockdowns are implemented two weeks after the seeds are imported, Changchun and Jilin will introduce the disease to 18 (95% CI: 15, 21) and 8 (95% CI: 7, 9) cities in China, respectively. If the city lockdown is implemented one week earlier, they can only import to 1 (95% CI: 1, 2) and 0 (95% CI: 0, 1) cities, respectively. If it’s one week later, they will import 131 (95% CI: 122, 140) and 56 (95% CI: 51, 62) cities, respectively.
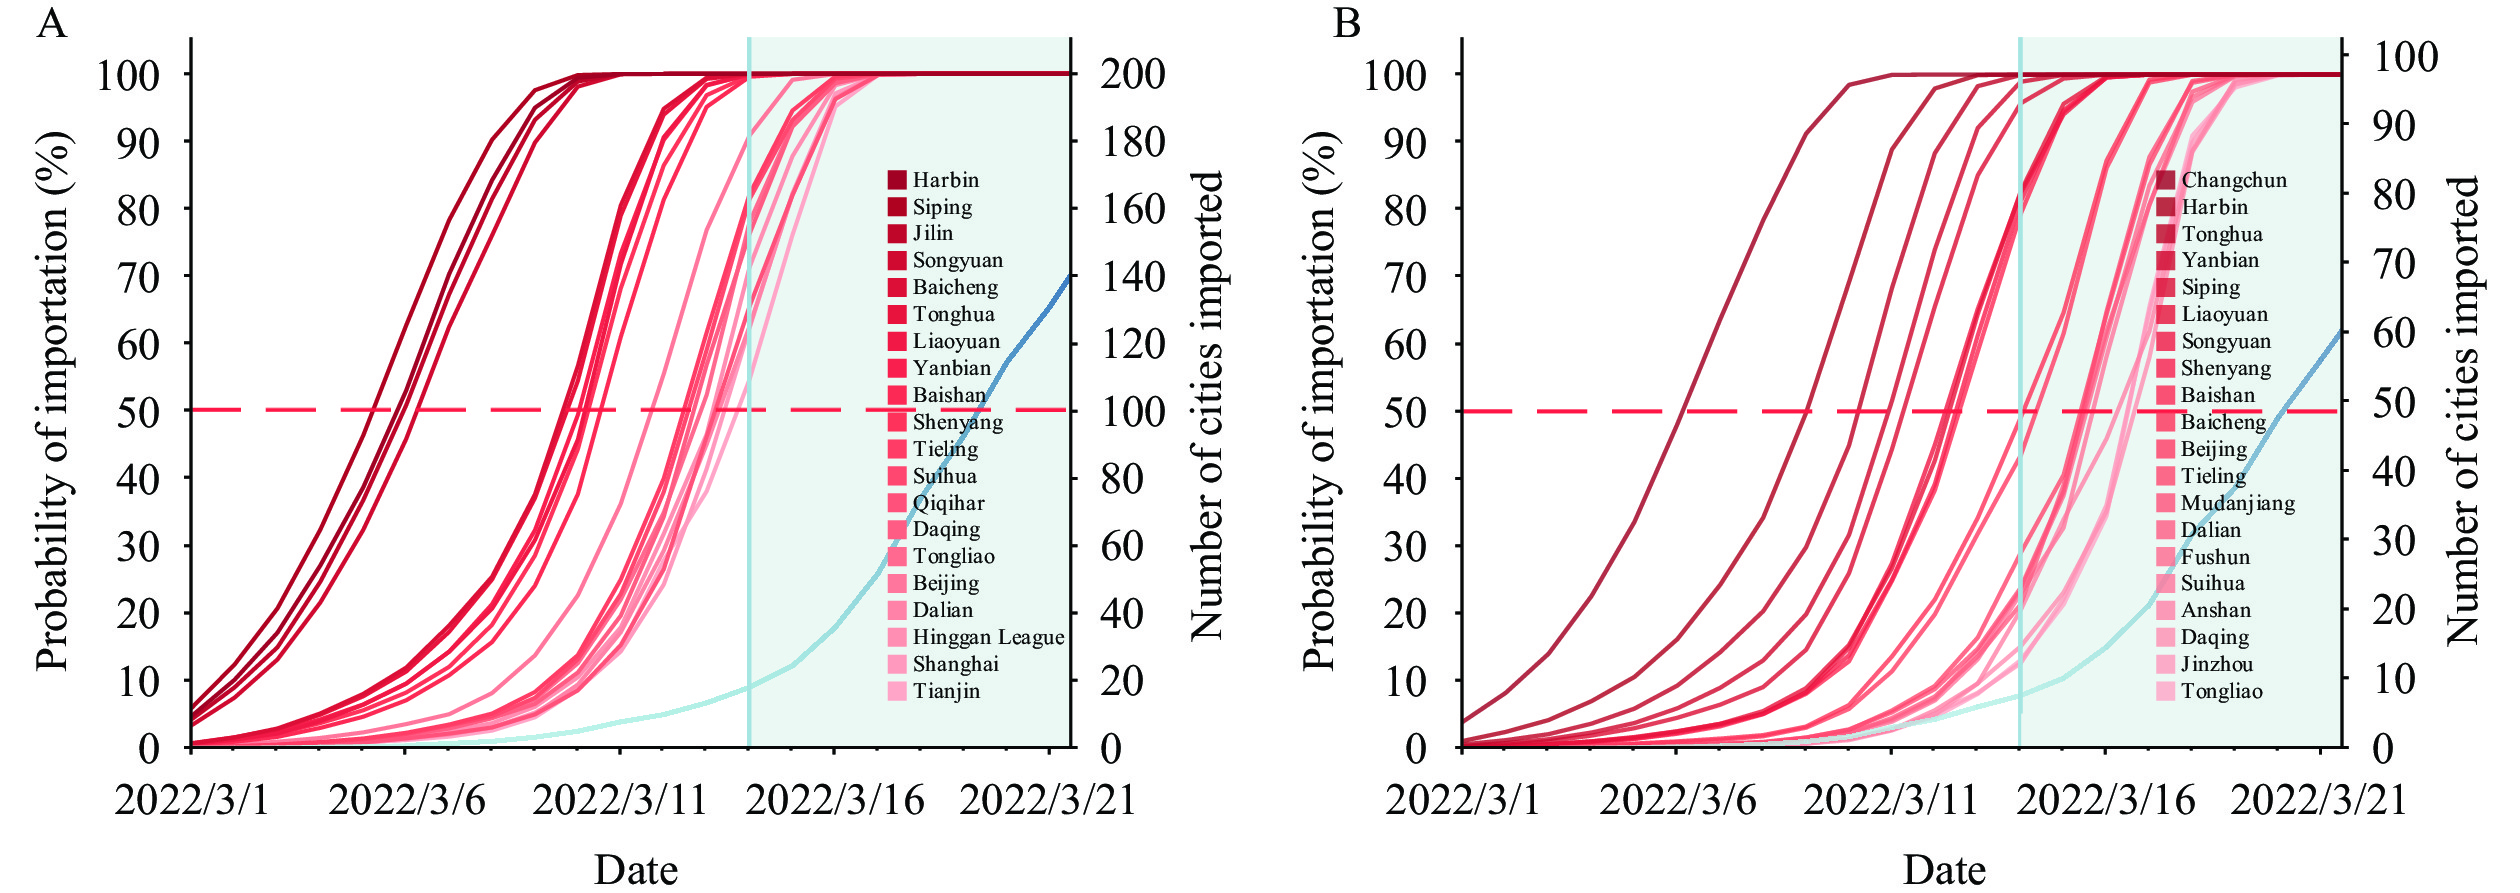 Figure 2.
Estimated risks for importation and exportation of the SARS-CoV-2 Omicron variant over prefectures (cities) in China. (A) Changchun; (B) Jilin City.
Note: This study estimated the probability that >1 person infected with the Omicron variant arrived at the target prefecture (city) by the date indicated on the x-axis, based on China Unicom mobility data. All simulations assume an initial outbreak of R0=5.49. This study showed the top 20 regions (with the highest probability on March 14, 2022) from cities of Changchun and Jilin City. The grey vertical line indicates March 14, 2022, the date when Jilin Province was locked down (14); line colours correspond to the importation risk on March 14, 2022.
Abbreviation: SARS-CoV-2=severe acute respiratory syndrome coronavirus 2.
-
Human mobility patterns shape epidemiological risk. The destiny of a newly emerging infectious disease will most likely be determined by where it was first imported. This study’s analysis of prefectures (cities) in China suggests that the rate of epidemic expansion depends not only on well-understood epidemiological drivers, e.g., R0, but also on the importation locations of the initial cases. Locations that are more vulnerable to aggressive epidemics are also the earliest to be hit by outbreaks that originate elsewhere.
Throughout the COVID-19 pandemic, as case numbers started to soar in the initial stage, countries had to make policy decisions quickly to avoid local outbreaks — even without timely and definite scientific evidence. In response to the resurgence of vaccine-evasive variants, estimation of importation risk is essential for implementing targeted risk-based travel restrictions. This study helped estimate the importation risk of prefectures (cities) from any epicenter using nationwide mobility data in China.
This study was subject to some limitations. The synthetic simulation does not explicitly include the possible delay of reports of new cases that could have happened early in the COVID-19 outbreak. In addition, this study’s model does not include moderate cases directly, which are combined into severe cases. However, it does assume that asymptomatic/exposed/pre-symptomatic/mild cases can travel between prefectures (cities). Therefore, such a model design would have little impact on this study’s estimates of both risk and incidence.
As Omicron outbreaks emerge within prefectures (cities) in the mainland of China in March 2022, the government will continue to face high pressure from the rapid transmissibility of the Omicron variant and coming variants in the future. The current pandemic presents a broader opportunity for us to interrogate how to control outbreaks. Like other transmissible pathogens (e.g., influenza), SARS-CoV-2 is likely to circulate in humans for many years to come (15). Estimating COVID-19 importation and exportation risks is necessary for preparedness and prevention and control measures of COVID-19 — especially when new variants emerge.
-
Parameters Values
(mean, std)Data source R0: basic reproduction number 2.43 (5.49, 8) Given that the effective reproduction number (Re) of the Omicron variant of SARS-CoV-2 is estimated at 2.43 (95% CI: 1.05, 5.49) in China (2) and around 8 in South Africa (3), we study the basic reproduction number (R0) in the range from 2.43, 5.49 to 8. (2–3) β: transmission rate per contact for a symptomatic case (mild, severe, critical) Calibrated to R0 Assumed ωp: relative infectiousness of pre-symptomatic cases as compared to symptomatic cases 1.57 (4–5) ωa: relative infectiousness of asymptomatic cases as compared to symptomatic cases 0.5 (6) ρI: initial cases One seed per million population Assumed Tinf: latent period Lognormal (4.5, 1.5) (7–8) Tpre: duration of pre-symptomatic infectiousness (length of duration after viral shedding has begun before an individual has symptoms) 2 (9) Tm: duration of mild symptomatic infectiousness Lognormal (6.6, 4.9) (10–11) Ts: duration of severe symptomatic infectiousness Lognormal (1.5, 2.0) (11–12) Tc: duration of critical symptomatic infectiousness Lognormal (10.7, 4.8) (13) Ta: duration of asymptomatic infectiousness Lognormal (8.0, 2.0) (14) Fa: fraction of asymptomatic infectiousness 27% (15) Fs: fraction of (symptomatic) infections that are severe 0.8% Assumed Fc: fraction of (symptomatic) infections that are critical 0.1% Assumed CFR: Case fatality rate (fraction of infections that eventually result in decease) 0.1% Assumed α0: transition rate out of exposed state 1 / Tinf (16) α1: transition rate out of pre-symptomatic state to symptomatic state 1 - Fa αm: transition rate out of mild infectiousness state (1 / Tm) - γm αs: transition rate out of severe infectiousness state (1 / Ts) * (Fc/Fs+Fc) αc: transition rate out of critical infectiousness state (1 / Tc) * (CFR / Fc) γm: recovery rate of mild symptomatic individuals (1 / Tm) * (1 - Fa) γs: recovery rate of severe symptomatic individuals (1 / Ts) - αs γc: recovery rate of critical symptomatic individuals (1 / Tc) -αc γa: recovery rate of asymptomatic individuals 1 / Ta Table S1. Epidemiological parameters.
Prefecture (city) Population Γ10% Γ20% Γ50% Exportation
risk (mean)Importation
risk (mean)Exportation
risk (mean)Importation
risk (mean)Exportation
risk (mean)Importation
risk (mean)Chongqing 30,752,000 14.74 36.38 16.58 36.38 19.01 36.38 Shanghai 24,183,000 12.72 32.26 14.53 32.26 17.63 32.26 Beijing 21,707,000 13.28 25.70 14.82 25.70 17.40 25.70 Chengdu 16,044,700 14.34 34.64 16.30 34.64 18.53 34.64 Tianjin 15,569,000 14.96 38.32 16.50 38.32 19.45 38.32 Guangzhou 14,498,400 12.53 37.96 14.64 37.96 18.11 37.96 Harbin 10,929,000 16.38 57.43 17.63 57.43 22.65 57.43 Wuhan 10,892,900 14.19 36.84 15.83 36.84 18.17 36.84 Shijiazhuang 10,879,900 16.66 47.24 17.96 47.24 22.10 47.24 Zhengzhou 9,880,000 14.85 32.61 16.56 32.61 18.91 32.61 Hangzhou 9,468,000 14.00 41.27 15.63 41.27 18.82 41.27 Xi’an 8,989,000 14.38 35.25 16.21 35.25 19.05 35.25 Nanjing 8,335,000 14.13 41.19 15.86 41.19 18.88 41.19 Shenyang 8,294,000 15.38 50.44 17.36 50.44 21.37 50.44 Hefei 7,965,300 14.90 43.38 17.01 43.38 20.28 43.38 Changsha 7,918,100 14.59 38.07 16.17 38.07 18.50 38.07 Changchun 7,674,439 16.64 60.64 18.85 60.64 31.49 60.64 Hong Kong 7,413,100 51.55 98.63 − 98.63 − 98.63 Jinan 7,321,200 15.68 43.13 17.28 43.13 20.57 43.13 Nanning 7,153,300 15.94 50.91 17.54 50.91 21.34 50.91 Dalian 6,988,000 16.38 58.84 18.18 58.84 26.09 58.84 Kunming 6783,,000 14.73 44.61 16.23 44.61 18.77 44.61 Nanchang 5,463,538 15.20 43.39 16.38 43.39 19.25 43.39 Suihua 5,418,153 20.76 69.19 37.94 69.19 − 69.19 Qiqihar 5,367,003 21.61 70.76 54.90 70.76 − 70.76 Guiyang 4,802,000 15.85 45.97 17.22 45.97 20.44 45.97 Jilin 4,413,157 18.98 68.08 26.78 68.08 − 68.08 Taiyuan 4,379,700 16.65 53.93 18.17 53.93 22.03 53.93 Fuzhou 4,031,037 16.69 52.55 17.95 52.55 39.71 52.55 Lanzhou 3,729,600 16.78 55.24 18.44 55.24 22.48 55.24 Anshan 3,598,000 19.18 70.13 26.05 70.13 − 70.13 Urumqi 3,500,000 17.24 71.81 19.27 71.81 26.68 71.81 Siping 3,385,156 18.73 68.53 48.51 68.53 − 68.53 Tongliao 3,128,700 19.58 70.33 63.55 70.33 − 70.33 Hohhot 3,114,800 17.74 67.28 20.40 67.28 51.74 67.28 Jinzhou 3,050,000 18.47 67.81 25.36 67.81 − 67.81 Daqing 2,904,532 21.26 75.69 44.21 75.69 − 75.69 Songyuan 2,880,086 20.17 68.84 75.10 68.84 − 68.84 Mudanjiang 2,798,723 25.45 70.46 − 70.46 − 70.46 Tieling 2,638,000 20.06 69.67 44.44 69.67 − 69.67 Xining 2,355,000 18.72 67.88 22.32 67.88 − 67.88 Tonghua 2,324,439 23.97 68.81 76.77 68.81 − 68.81 Haikou 2,272,100 16.03 56.04 17.71 56.04 20.58 56.04 Yanbian Korean
Autonomous Prefecture2,270,816 20.65 72.24 75.50 72.24 − 72.24 Yinchuan 2,225,391 18.27 71.43 21.71 71.43 66.14 71.43 Fushun 2,065,000 20.97 71.32 31.23 71.32 − 71.32 Baicheng 2,032,356 22.18 74.67 79.59 74.67 − 74.67 Baishan 1,296,127 24.82 72.66 − 72.66 − 72.66 Hinggan League 1,604,200 23.45 76.48 − 76.48 − 76.48 Liaoyuan 1,176,239 25.02 71.88 − 71.88 − 71.88 Lhasa 559,423 21.44 86.53 40.61 86.53 − 86.53 Note: For each prefecture (city), the mean estimates of the exportation risk and the importation risk are calculated until 10%, 20%, and 50% of prefectures (cities) experience outbreaks (Γ10%, Γ20%, and Γ50%), averaged over 100 stochastic simulations. All simulations assume an initial outbreak of R0= 5.49.
“–” denotes regions without any importations or exportations in the studied period.Table S2. List of 51 study regions including 28 provincial capitals, 4 municipalities, 1 speical administrative region of China, and the prefectures (cities).
HTML
Mobility Data
Epidemic Model


| Citation: |

|