

 Download:


-
Coronavirus disease 2019 (COVID-19) is an acute respiratory infectious disease caused by the severe acute respiratory syndrome coronavirus 2 (SARS-CoV-2). In China, the Omicron variant was initially detected in the respiratory tract samples of 2 imported cases in Tianjin Municipality, on December 13, 2021 (1). The first local transmission case with the Omicron variant BA.2 in China was reported on December 29, 2021, in Guangdong Province (2). Subsequently, over 30 provincial-level administrative divisions (PLADs) reported outbreaks caused by the Omicron variant. The Omicron variant BA.2 became the preponderant strain in China in just a few months. An imported case who returned to Wuchuan County, Zunyi City, Guizhou Province from Zhejiang Province was reported on March 11, 2022. The next 11 cases were successively detected from March 12 to 17, 2022 after a series of emergency measures. Wuchuan’s outbreak was effectively controlled after the implementation of comprehensive countermeasures, including closing key areas, conducting region-wide and county-wide nucleic acid screening, restricting inbound and outbound traffic, and tracking and isolating close contacts. Once the outbreak was under control, this study used the susceptible-exposed-infectious-asymptomatic-removed (SEIAR) model to evaluate the effectiveness of Wuchuan’s prevention and control measures during its March, 2022 COVID-19 outbreak caused by Omicron variant BA.2.
-
A total of 12 cases were reported in Wuchuan from March 11 to 17, 2022. Of these cases, 9 were symptomatic and 3 were asymptomatic. Overall, the full course of vaccination was administered to 11 cases, of which 6 were administered with booster injections. The initial case was detected by an individual’s nucleic acid test on March 11, 2022, and the other 11 cases were detected through close contact tracking and nucleic acid screening on March 12–15 and 17.
Upon the occurrence of the outbreak, Guizhou Province, Zunyi City, and Wuchuan County immediately established three levels of communications linkage to implement coordinated countermeasures. They started the contingency plan and traffic control within 2 hours after confirmation of the first case. Epidemiological investigation, the checking of close contacts and other relevant persons, and the isolation of cases and close contacts were conducted right away. The epidemiological investigation in the field revealed that the first case was a courier who had lived and worked in Yuhang District, Hangzhou City, Zhejiang Province until March 7, 2022. Some key areas were divided into temporary close control areas and management control areas based on the epidemiological investigation’s risk evaluation, and one close contact of the first case was detected nucleic acid positive on March 12. The region-wide nucleic acid screening was conducted on March 13, and 4 additional cases were detected. However, there was no epidemiological correlation among these cases according to the results of the investigation. Wuchuan then extended the scope of nucleic acid screenings on March 14, and 1 case was detected by isolating close contacts and nucleic acid screening. Wuchuan’s outbound and inbound traffic were restricted on March 15, and 2 cases were detected in isolation locations on the same day. A county-wide nucleic acid screening was conducted on March 16 because of the rising number of cases, no cases were detected. A second cycle of county-wide nucleic acid screening was then conducted on March 17, and 3 cases were detected. With these additional data points, Wuchuan’s response team was able to confirm the epidemiological correlation among the 12 cases by meticulous research. Furthermore, of the 12 cases, the viral genomes of 4 cases were sequenced and all belonged to the Omicron BA.2 branch, which was homologous with the results of a recent outbreak in Zhejiang Province.
During the period of the outbreak, the secondary close contacts were monitored and their nucleic acid results were collected via door-to-door testing; the persons at risk who resided with cases in the same space at the same time were given yellow health codes and conducted their nucleic acid tests under supervision through phone calls; and the list of close contacts in need of testing was checked daily to ensure rigorous adherence to testing requirements. Efficient nucleic acid test administration training helped support this process so that the results of nucleic acid tests were consistently available same-day. In total, 7 cycles of regional nucleic acid screening, 6 cycles of the nucleic acid screening of streets or towns that reported cases, and 4 cycles of the nucleic acid screening of the whole county were completed. In addition, the total number of individual nucleic acid screenings exceeded 1,667,000: there were 628 close contacts tracked and isolated, and 3,180 secondary close contacts were checked and monitored. If no case was detected in 4–5 cycles of nucleic acid screening over the course of 1 week, or if no close contact was added, a close control area would be unlocked after risk evaluation. However, if infections were detected in a close control area, 1–2 cycles of nucleic acid screening would be added for the area. Later, the block of the area would be removed in accordance with the results of the risk evaluation.
The SEIAR model was developed to analyze the transmission dynamics of COVID-19 and to evaluate the effectiveness of countermeasures taken during the COVID-19 outbreak. According to the transmission mechanisms of COVID-19, people who were entered into the SEIAR model were divided into five types: susceptible (S), exposed (E), infectious (I), asymptomatic (A), and removed (R). As presented in Table 1, the parameters of the SEIAR model included β, ω, ω’, p, γ, and γ’, among which β was obtained by simulating the reported data with the model data; p was calculated in accordance with the reported data of the outbreak and set to 0.33; 1/ω and 1/ω’ were set to 3 days on the basis of a previous study (3); 1/γ and 1/γ’ were set to 5 days in accordance with a previous study (4); and κ was set to 0.5 in accordance with a previous study (5). As illustrated in Figure 1, the SEIAR model was well aligned with the data of reported cases (R2=0.605, P<0.05). The SEIAR model divided the outbreak into the natural transmission stage (before March 13, 2022), the effective control stage (March 13–15, 2022), and the entire control stage (after March 15, 2022). The effective reproduction numbers (Reff) of the 3 stages were 6.32, 0.83, and 0. After interventions such as the isolation of close contacts or the quarantining of key areas, transmission decreased and the Reff in the second stage declined by 86.87% compared with that of the first stage. Subsequently, after multiple cycles of region-wide and county-wide nucleic acid screenings and traffic restrictions, the Reff declined to 0 by the end of the control stage. As described in Table 2, the simulation results indicated that if any intervening measures were not taken in the first stage, the total number of infected cases would have increased to 1,184 and 19,480 by March 24 and 31, respectively. In stark contrast, only 12 cases were reported during the outbreak. This result indicated that 98.99% and 99.94% of the population avoided COVID-19 infection after the implementation of prevention and control measures in the first stage. Furthermore, if effective measures had not been taken in the second stage, the number of cases would have increased to 39 and 51 by March 24 and 31. After countermeasures were adopted, the actual number of reported cases was reduced by 69.23% and 76.47% relative to those simulated for the second stage. Finally, if countermeasures were not taken during these two early periods of the outbreak, the outbreak is predicted to have continued until April 12. In reality, the outbreak ended on March 17, indicating that the epidemic time was significantly shortened by the series of countermeasures implemented.
Parameter Description Unit Value Source β The transmission rate Person−1×day−1 – Model simulating κ The transmissibility of A to I 1 0.5 Reference (6) ω The relative number of incubation period Day−1 0.33 Reference (4) ω’ The relative number of latent period Day−1 0.33 Reference (4) p The proportion of A 1 0.33 Report data γ The relative rate of infection period of I Day−1 0.2 Reference (5) γ’ The relative rate of infection period of A Day−1 0.2 Reference (5) Note: “–” means not applicable.
Abbreviation: SEIAR=susceptible-exposed-infectious-asymptomatic-removed; COVID-19=coronavirus disease 2019; A=asymptomatic; I=infectious.Table 1. Definition and values of parameters in SEIAR model of COVID-19 in Wuchuan County.
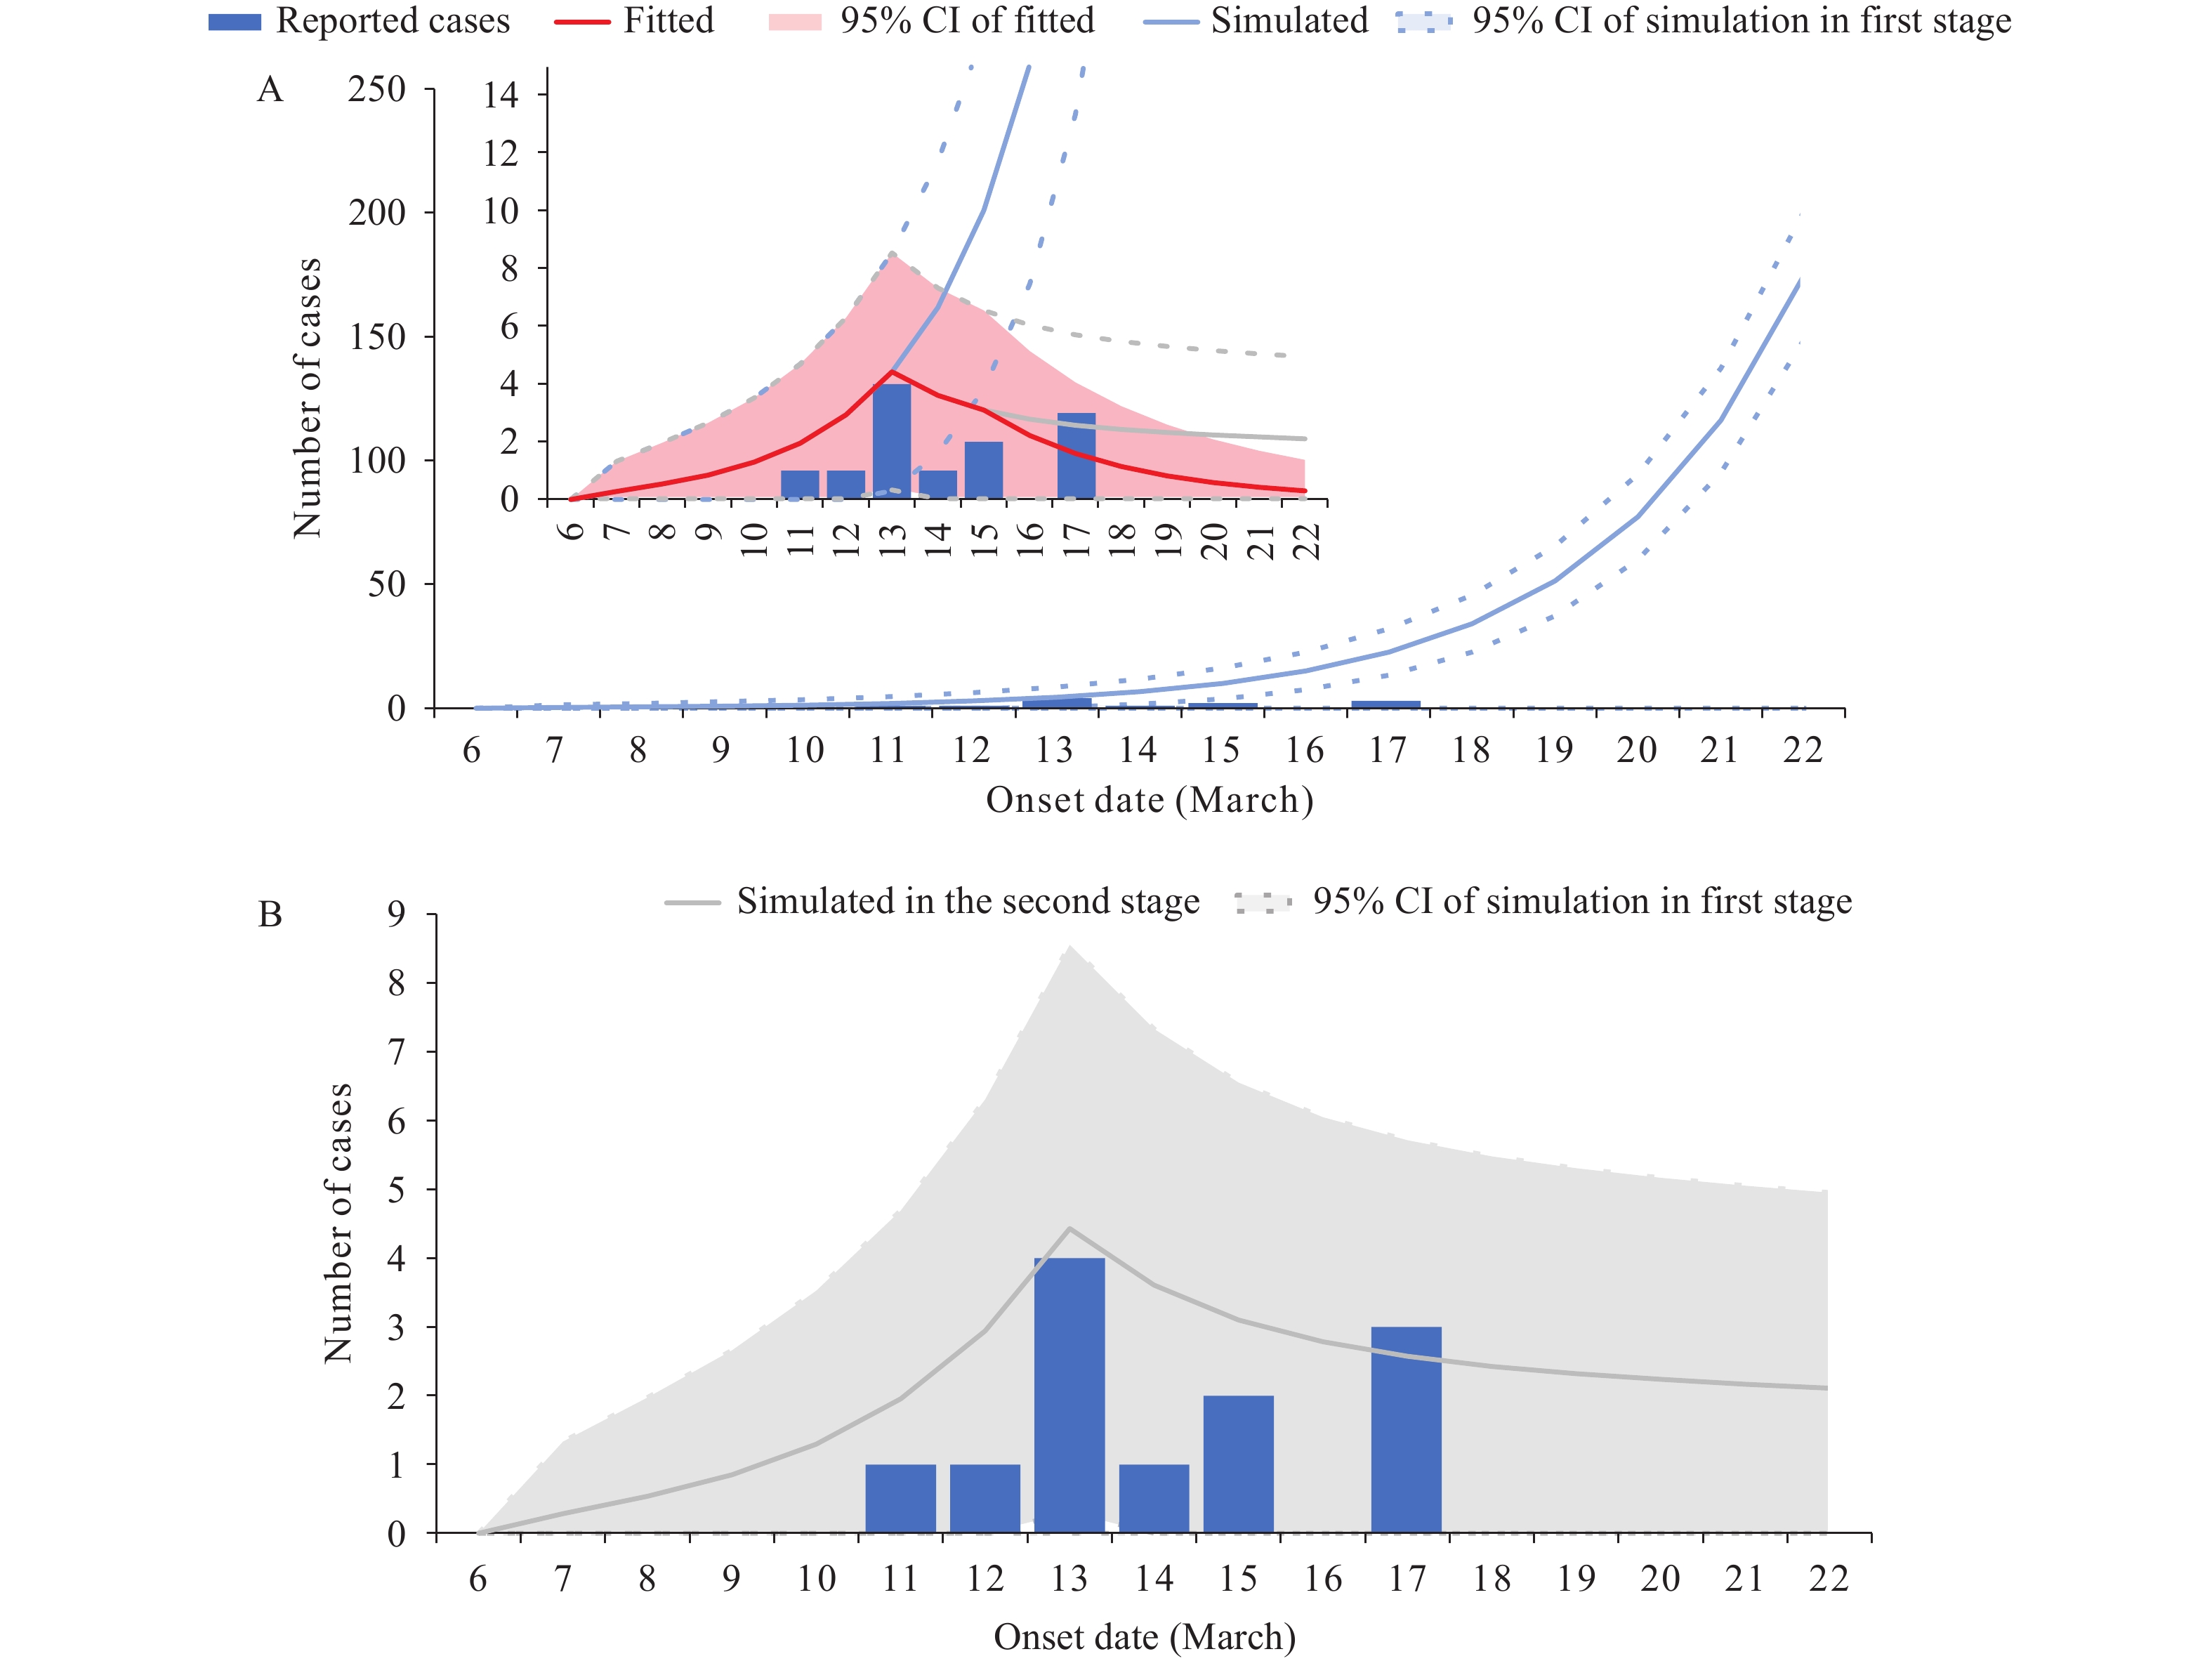 Figure 1.
The fitting results between SEIAR model and the actual data of COVID-19 cases in Wuchuan County. (A) The result in the first stage without interventions; (B) The result in the second stage with interventions taken in the first stage but not in the second stage.
Abbreviation: SEIAR=susceptible-exposed-infectious-asymptomatic-removed; COVID-19=coronavirus disease 2019; CI=confidence interval.Onset date First stage
(No intervention)Second stage
(No intervention)Report cases New cases Accumulated
casesNew cases Accumulated
casesNew cases Accumulated
casesMarch 6 0 0 0 0 0 0 March 7 0 0 0 0 0 0 March 8 1 1 1 1 0 0 March 9 1 2 1 2 0 0 March 10 1 3 1 3 0 0 March 11 2 5 2 5 1 1 March 12 3 8 3 8 1 2 March 13 4 12 4 12 4 6 March 14 7 19 4 16 1 7 March 15 10 29 3 19 2 9 March 16 15 44 3 22 0 9 March 17 23 67 3 24 3 12 March 18 34 101 2 27 0 12 March 19 52 153 2 29 0 12 March 20 78 231 2 31 0 12 March 21 117 347 2 33 0 12 March 22 176 523 2 35 0 12 March 23 264 787 2 37 0 12 March 24 397 1,184 2 39 0 12 March 25 595 1,779 2 41 0 12 March 26 891 2,670 2 43 0 12 March 27 1,332 4,002 2 45 0 12 March 28 1,982 5,984 2 46 0 12 March 29 2,935 8,919 2 48 0 12 March 30 4,309 13,228 2 50 0 12 March 31 6,253 19,480 2 51 0 12 April 1 8,917 28,397 2 53 – – April 2 12,407 40,804 2 54 – – April 3 16,685 57,488 1 56 – – April 4 21,437 78,925 1 57 – – April 5 25,986 104,911 1 58 – – April 6 29,378 134,289 1 60 – – April 7 30,734 165,023 1 61 – – April 8 29,702 194,725 1 62 – – April 9 26,658 221,383 1 64 – – April 10 22,465 243,848 1 65 – – April 11 18,018 261,866 1 66 – – April 12 13,938 275,804 1 67 – – April 13 10,515 286,319 0 0 – – Note: “–” means not applicable.
Abbreviation: SEIAR=susceptible-exposed-infectious-asymptomatic-removed.Table 2. Comparation of simulated results of the SEIAR model with the reported cases.
-
Previous studies predicted the transmission of COVID-19 and assessed the effect of prevention and control measures taken during the COVID-19 pandemic by using the SEIAR model (6–8). After implementing prevention and control measures, this study used the SEIAR model; after finding that the model fitted the reported data well, this study divided the outbreak into three stages. The P parameter in the SEIAR model is the proportion of asymptomatic infections. The P value in our study was similar to that obtained for Taiwan, China (8), higher than that reported for Anhui Province (7), and lower than that found for Zhejiang Province (6). The differences among the P values of PLADs may be associated with local demography and economics. In this study, the outbreak was transmitted through a breakthrough infection in the first stage. Because the Reff was 6.32, the data from Wuchuan indicates that one case could have infected an average of 6.32 cases even despite high vaccination coverage rates: a value that was similar to values found in outbreaks in South Africa, the United States, and Canada (9).
After the occurrence of the outbreak, a series of countermeasures were taken, such as the dividing and closing of key areas, the isolation of close contacts, the living at home of secondary close contacts, the conduction of regional nucleic acid screening, the starting of county-wide nucleic acid screening, and the implementation of traffic controls. The Reff value of the COVID-19 outbreak decreased gradually until the outbreak was ultimately controlled. The outbreak involved 12 cases and this number of cases was notably lower than that predicted by the SEIAR model simulation in the absence of intervention, suggesting that the countermeasures taken here were remarkably effective. This is significant because Wuchuan is one of the most important counties in Zunyi; if the implementation of countermeasures was not prompt, the outbreak may have spilled over to the Zunyi, Tongten, and Guiyang cities of Guizhou Province; the Luzhou City of Sichuan Province; or Chongqing Municipality. However, no cases spilled out in this outbreak, further confirming that the response measures enacted were reasonable. Therefore, this study suggests the following measures: 1) dividing key areas as early as possible; 2) tracing and isolating close contacts; 3) conducting county-wide nucleic acid screening; and 4) comprehensive and detailed epidemiological investigation.
This study was subject to some limitations. It had a relatively small sample size, and it did not consider natural births and deaths. This situation might lead to a slight bias between the reality of the Wuchuan outbreak and the results simulated by the SEIAR model.
-
No conflicts of interest.
HTML
| Citation: |

|