

 Download:


-
Dyslipidemia is a vital risk factor for cardiovascular disease (CVD) and has increased considerably in recent years. Temperature was convinced to be a major climate factor that affected plasma lipid levels (1). In 2021, Kang et al. suggested long-term temperature variability (TV), an indicator of extreme temperatures, increased the risk of CVD; furthermore, dyslipidemia can modify the long-term TV-related risk of CVD (2). Lao et al. also found that the variation of dyslipidemia prevalence showed seasonal features in China (3). However, as an indicator of climate change, TV was rarely included in exploring its impacts on dyslipidemia. Therefore, we evaluated the long-term effect of TV on dyslipidemia in middle-aged and older adults based on the China Health and Retirement Longitudinal Study (CHARLS) from 2011 to 2018.
The study data were collected from 17,596 individual participants in 150 county-level units sampled from 450 communities in 125 cities among 28 provincial-level administrative divisions (PLADs) of China selecting by the multi-stage probability sampling method. We excluded 1,615 participants with dyslipidemia, 5,753 participants without dyslipidemia reports, and 609 participants for the lack of key covariate information. The final analysis sample included 9,619 individuals without dyslipidemia at baseline with key variables in 2011–2018 (
Supplementary Figure S1 ). In CHARLS, all participants provided written informed consent.This study defined the dependent variable as being diagnosed with dyslipidemia or not at baseline. Diagnosed dyslipidemia was defined as participants’ self-reports of ever having been diagnosed with dyslipidemia by doctors. The daily meteorological information of all selected cities in the same period (2011–2018) was obtained from the China Meteorological Science Data Sharing Service Network. Nearest-neighbour interpolation was applied to estimate the daily data across the mainland of China at a spatial resolution of a regular grid of 10 km × 10 km (ten-fold cross validation: R2=0.95; root mean square error=2.34 ℃). We calculated the annual standard deviation (SD) of the daily average temperature as the TV index, and TV of the year before each survey was considered as the long-term TV exposure. TV data were assigned to each participant by their residential cities and survey year. Annual average concentrations of fine particles with a diameter ≤2.5 μm (PM2.5) from 2011 to 2018 were calculated from a combination of satellite observations, chemical transport modeling, and ground-based monitoring (R2=0.81; slope=0.90) (4). We assigned the annual average city-level PM2.5 concentration of the year before each survey to each participant.
Recorded demographic characteristics (age, sex) in CHARLS were included in covariates. We also collated three lifestyle covariates (smoking, alcohol drinking, social interactions) and three socioeconomic status covariates (education attainment, residence, and household income per capita). Household income status was divided into binaries by average. Educational attainment was divided by whether junior school education was attained. Gross domestic product (GDP) at the city level was also collected from the National Bureau of Statistics and China’s National Knowledge Infrastructure. By the Kunlun-Qinling-Huaihe line, the cities were divided into southern cities and northern cities. Environmental variables and dependent variables were time-varying for each survey, and other covariables were the values at baseline.
We assessed the association between long-term TV and the incidence of dyslipidemia using time-varying Cox proportional hazards model on a year-based time scale. We first evaluated the effects of TV on a continuous scale and reported the association with per 1 ℃ increase in TV. According to a previous study about long-term TV (2), TV was also divided into three categories (low<8.03 ℃, medium=8.03–10.23 ℃, high>10.23 ℃), with the low TV as the reference group. We tested the statistical significance of the linear trend between each category of TV and dyslipidemia.
We fitted three models with different categories of covariates, and TV was included as a continuous variable or categorical variable in the models. Punitive spline regression (df=3) was used to analyse the exposure-response curve of TV and dyslipidemia. Furthermore, we evaluated the modification in the association between long-term TV and dyslipidemia, stratifying by age, sex, residency, household income status, education attainment, and geographical location.
Data arrangement, cleaning, and all statistical analyses were conducted using R (version 4.0.2, R Foundation for Statistical Computing, Vienna, Austria) with packages dplyr, survival, smoothHR, and coxme. Statistical significance was defined as P<0.05, two sides. We included 9,619 participants without dyslipidemia and found 1,848 of them with dyslipidemia during the follow-up period. The median follow-up time was 4 years [interquartile range (IQR): 2–7 years]. In cities of CHARLS, the average annual TV between 2011 and 2018 ranged from 4.18 ℃ to 17.75 ℃. Participants living with high TV were more likely to have higher education attainment, live in urban areas, smoke more, drink less, and have higher PM2.5 exposure and higher incidence of dyslipidemia (
Supplementary Table S1 ).We observed a positive association between dyslipidemia and long-term exposure to TV in three models (details about the models can be found in Table 1). In model 3, we observed 8.3% [95% confidence interval (CI): 4.2%–12.6%] increase in dyslipidemia for each 1 ℃ increase in TV (Table 1). Compared with low TV levels, the increase in medium and high TV levels was associated with 34.0% (95% CI: 15.6%–55.3%) and 57.9% (95% CI: 30.3%–91.3%) higher risks of dyslipidemia in a significant positive trend (Table 1). We also did a sensitivity analysis using the interval years of TV between surveys as long-term exposure and found that hazard ratio (HR) was 1.079 (95% CI: 1.036–1.123) (Table 1). Punitive spline regression with 3 degrees of freedom showed that exposure-response curve of long-term TV exposure and dyslipidemia was almost linear (Figure 1).
Models TV per 1 ℃ increment [Hazard ratio (95%CI)] TV levels [Hazard ratio (95%CI)] P Low Medium High Model 1* 1.089 (1.071–1.107) 1.00 (Ref) 1.346 (1.167–1.553) 1.566 (1.301–1.885) <0.001 Model 2† 1.093 (1.052–1.136) 1.00 (Ref) 1.340 (1.156–1.553) 1.579 (1.303–1.913) <0.001 Model 3§ 1.083 (1.042–1.126) 1.00 (Ref) 1.338 (1.153–1.553) 1.583 (1.303–1.924) <0.001 Model 4¶ 1.079 (1.036–1.123) 1.00 (Ref) 1.279 (1.106–1.478) 1.389 (1.148–1.681) <0.001 Abbreviations: CI=confidence interval; PM2.5=particulate matter of diameter ≤2.5 μm; TV=temperature variability.
* Crude model.
† Adjusted for model 1 criteria and age, sex, whether having lifestyle of smoking, drinking, annual average temperature, PM2.5, GDP.
§ Adjusted for model 2 criteria and residency, household income per capita, educational attainment.
¶ Adjusted for model 3 criteria, using the interval years of TV between surveys as long-term exposure.Table 1. Cox regression models of TV and dyslipidemia among middle-aged and elderly adults, 2011–2018.
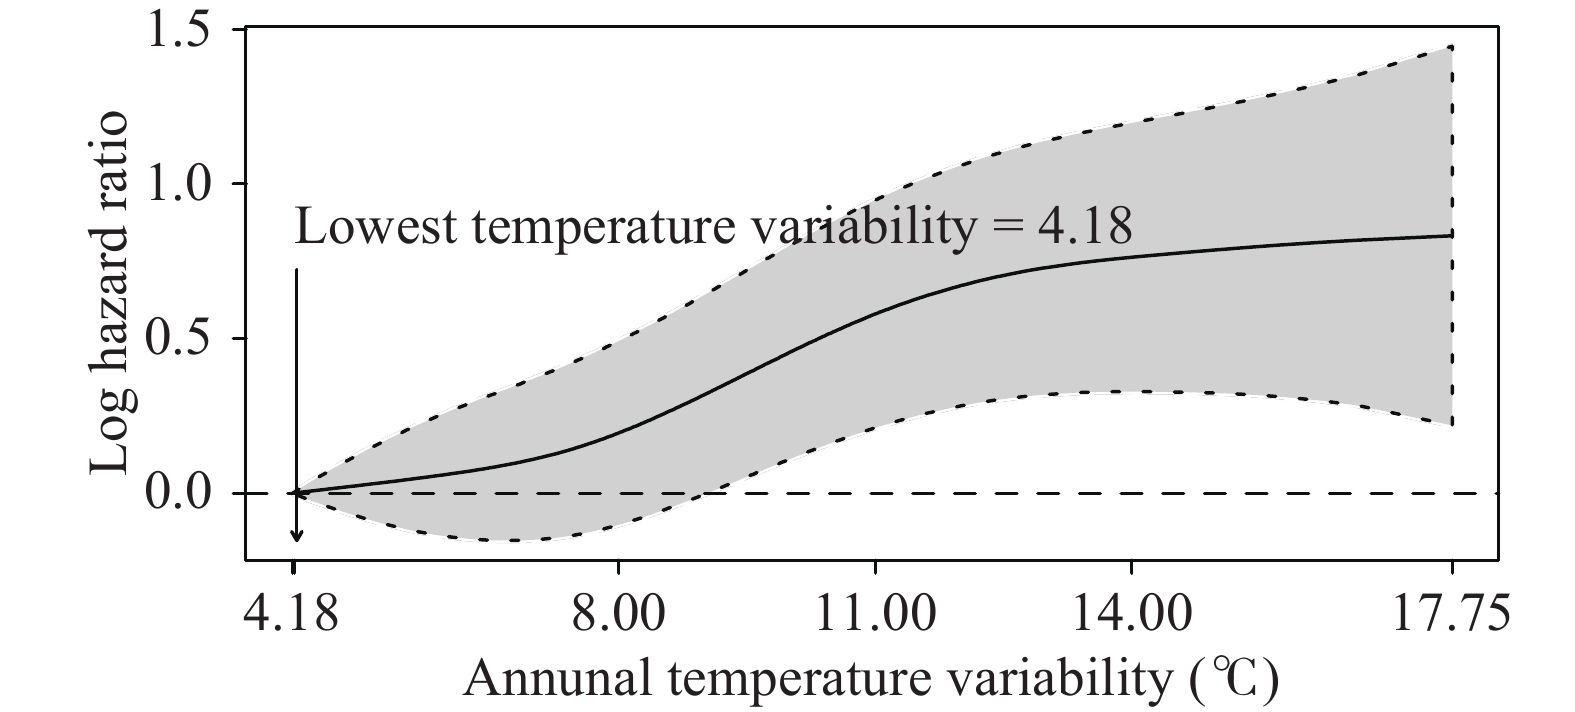 Figure 1.
The exposure-response curve of long-term TV and dyslipidemia among middle-aged and elderly adults — China, 2011–2018.
Notes: Age, sex, marriage status, having disability, smoking, drinking, having accident injury, and having social interactions were adjusted. The solid line represents log hazard ratio, and the gray zone indicates 95% confidence interval.
Abbreviation: TV=temperature variability.
Marginal significant difference was found in the long-term TV-related risk between participants with low education attainment (HR: 1.093; 95% CI: 1.011–1.181) and high education attainment (HR: 1.084; 95% CI: 1.036–1.134) (Interaction P value=0.053) (
Supplementary Table S2 ). No significant difference was found in the long-term TV effects in age, sex, residence, household income status, and living in different geographical regions. -
In this study, we found a positive near-linear association between TV and risk the of dyslipidemia in middle-aged and elderly people. TV might affect the incidence of dyslipidemia, the risk factor of CVD.
Previous studies focused more on TV-related mortality or the incidence of CVD. A study analysed the effects of short-term TV among 31 cities in China, and observed a 1 ℃ rise of TV would increase 0.98 of CVD mortality (5). Shi et al. study in the USA found that for each 1 ℃ increase in TV, mortality in summer and winter increased by 0.80 and 0.41, respectively (6). A study in China with 35,000 participants over 35 years found that per 1 ℃ increase of long-term TV was associated with 6 increased incidence of CVD, and dyslipidemia was possibly a modifying factor (2). In this current study, we observed that higher TV would increase the incidence of dyslipidemia, which helps to understand the effects of long-term TV on CVD, especially among middle-aged and elderly populations. However, further studies were needed to examine the cause-and-effect relationship among long-term TV, dyslipidemia, and CVD.
Limited researches had been carried out to explore the underlying mechanism. Several studies suggested that extreme ambient temperature might affect the levels of high-density lipoprotein (HDL) and low-density lipoprotein (LDL), possibly by disturbing the absorbing of lipid (7–8). Some mechanistic studies showed that the unstable temperature would affect other blood biomarkers, such as blood cholesterol levels and plasma fibrinogen concentrations (5). The fluctuation in ambient temperature due to climate change would result in an imbalance between energy intake and energy expenditure, which contributes to the prevalence of metabolic syndrome (9–10). The mechanism of how TV affects plasma lipid levels needs further investigation.
The study was subject to some limitations. First, because of the limitation of geographical information, exposure of TV was assessed at the city level, which might have induced exposure misclassification. Second, since the research object was the middle-aged and elderly people over 45 years old, the results could not represent the impact of long-term TV on dyslipidemia in younger people. Third, the long-term exposure could be affected by other potential unknown confounding factors, such as indoor air-conditioner use, which might have led to inaccurate estimation.
In conclusion, we observed that long-term exposure to TV may increase the risk of dyslipidemia. Under the challenges of climate change and aging of population, these findings provided implications for making policies and adaptive strategies, such as providing extreme temperature warnings and plans to protect people working outdoors. Further studies are needed to investigate the underlying mechanisms for the reported association.
-
No conflicts of interest.
-
China Center for Economic Research, National School of Development, Peking University, Beijing, China.
HTML
| Citation: |

|