

 Download:


-
The numbers of oldest-old aged 80 years and above who will most likely need care in daily life and health services will climb from nearly 20 million in 2010 to about 120 million in 2050 in China (1). However, little is known about the oldest-old in most developing countries including China (Supplementary Materials). To fill in this knowledge gap for scientific studies and policymaking, this paper presents easily understandable analyses of gender differentials in familial status, socioeconomics, activities of daily living (ADL), physical performance, cognitive functions, self-reported health, and life satisfaction among the oldest-old aged 80 years and above in China. The definitions of the measurements of the activities of daily living, physical performance, self-reported health, and life satisfaction are described in “measurements of the health statuses” of Supplementary Materials.
The Chinese Longitudinal Healthy Longevity Study (CLHLS) was conducted in 1998–2018 and purposefully over-sampled the oldest-old aged 80 years and above, plus a compatible sub-sample of younger-old aged 60–79. We use the datasets of oldest-old aged 80 years and above collected in 1998, 2008–2009, and 2017–2018 waves of CLHLS in the present study to perform meaningful comparative analyses on gender differences in the 3 periods (each roughly 10 years apart) from 1998 to 2018. The included sample sizes were 8,805 oldest-old in the 1998 wave, 12,281 oldest-old in the 2008–2009 wave, and 10,437 oldest-old in the 2017–2018 wave. P values vary among different 5-year-old age groups and periods. In total, there are 210 P values in Figures 1–4 that are available upon request to the author.
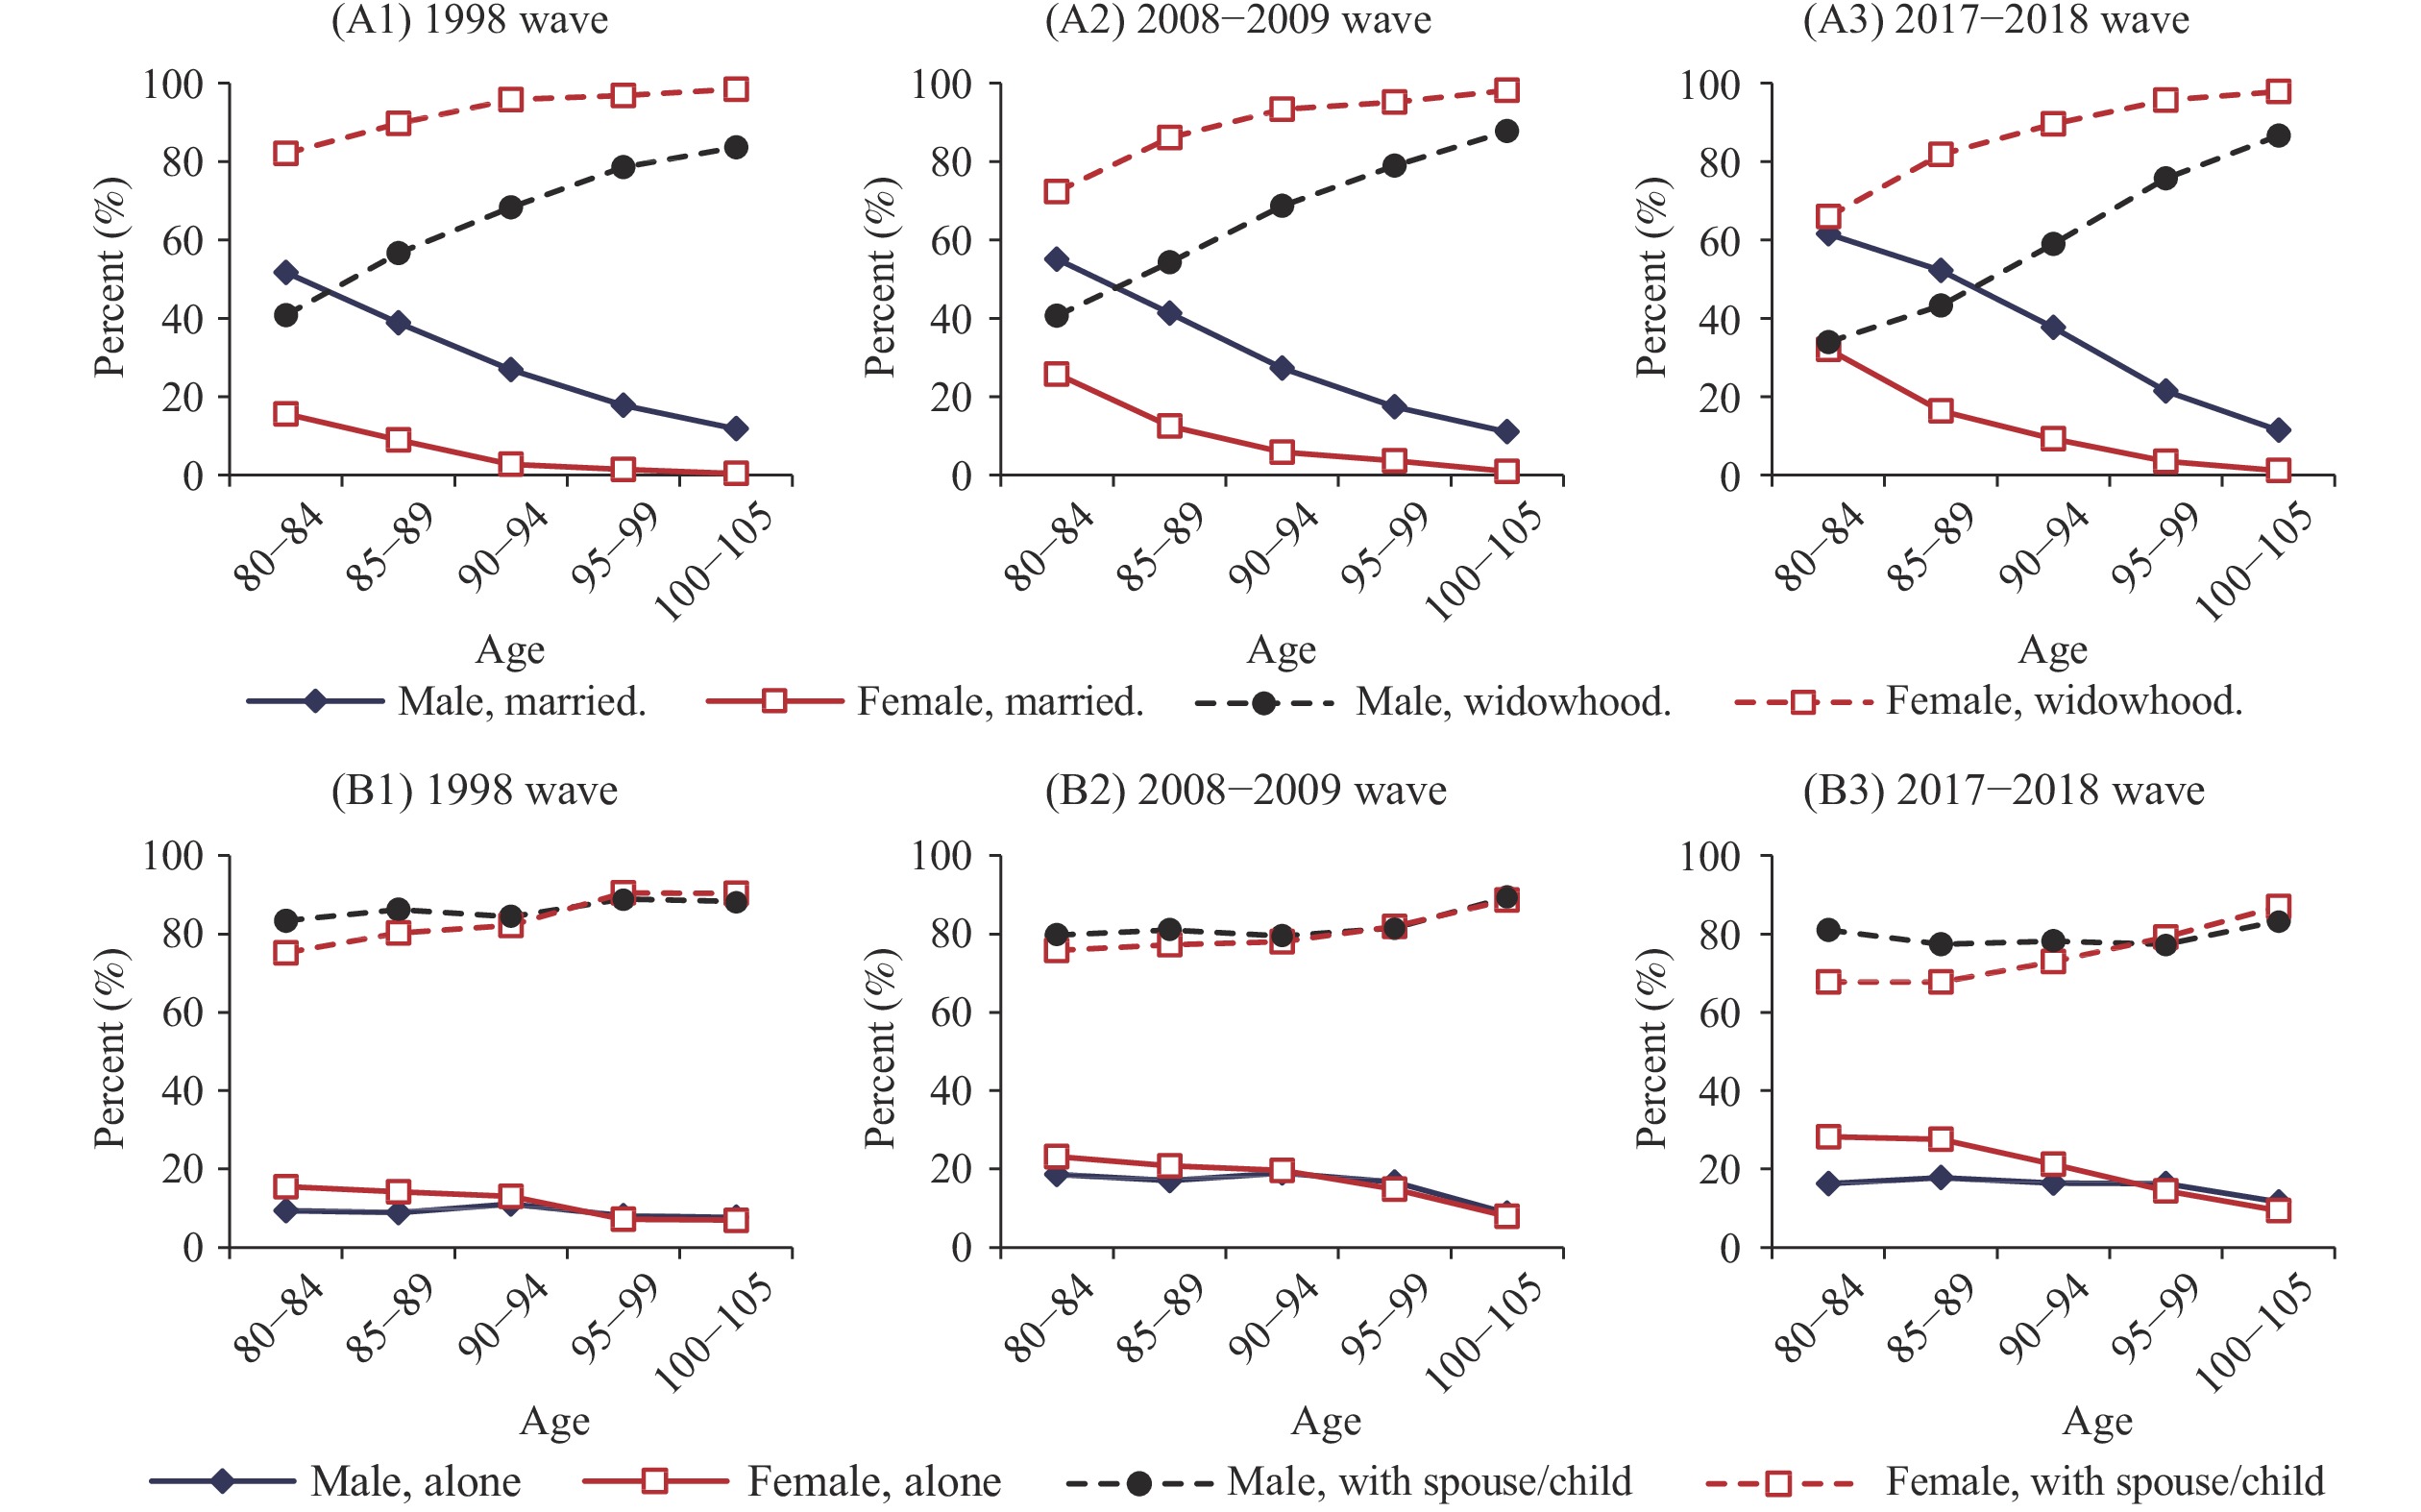 Figure 1.
Gender differences in familial status among the oldest-old in China, 1998–2018. (A) Percentage of marital statuses among the oldest-old; (B) Percentage of living arrangements among the oldest-old.
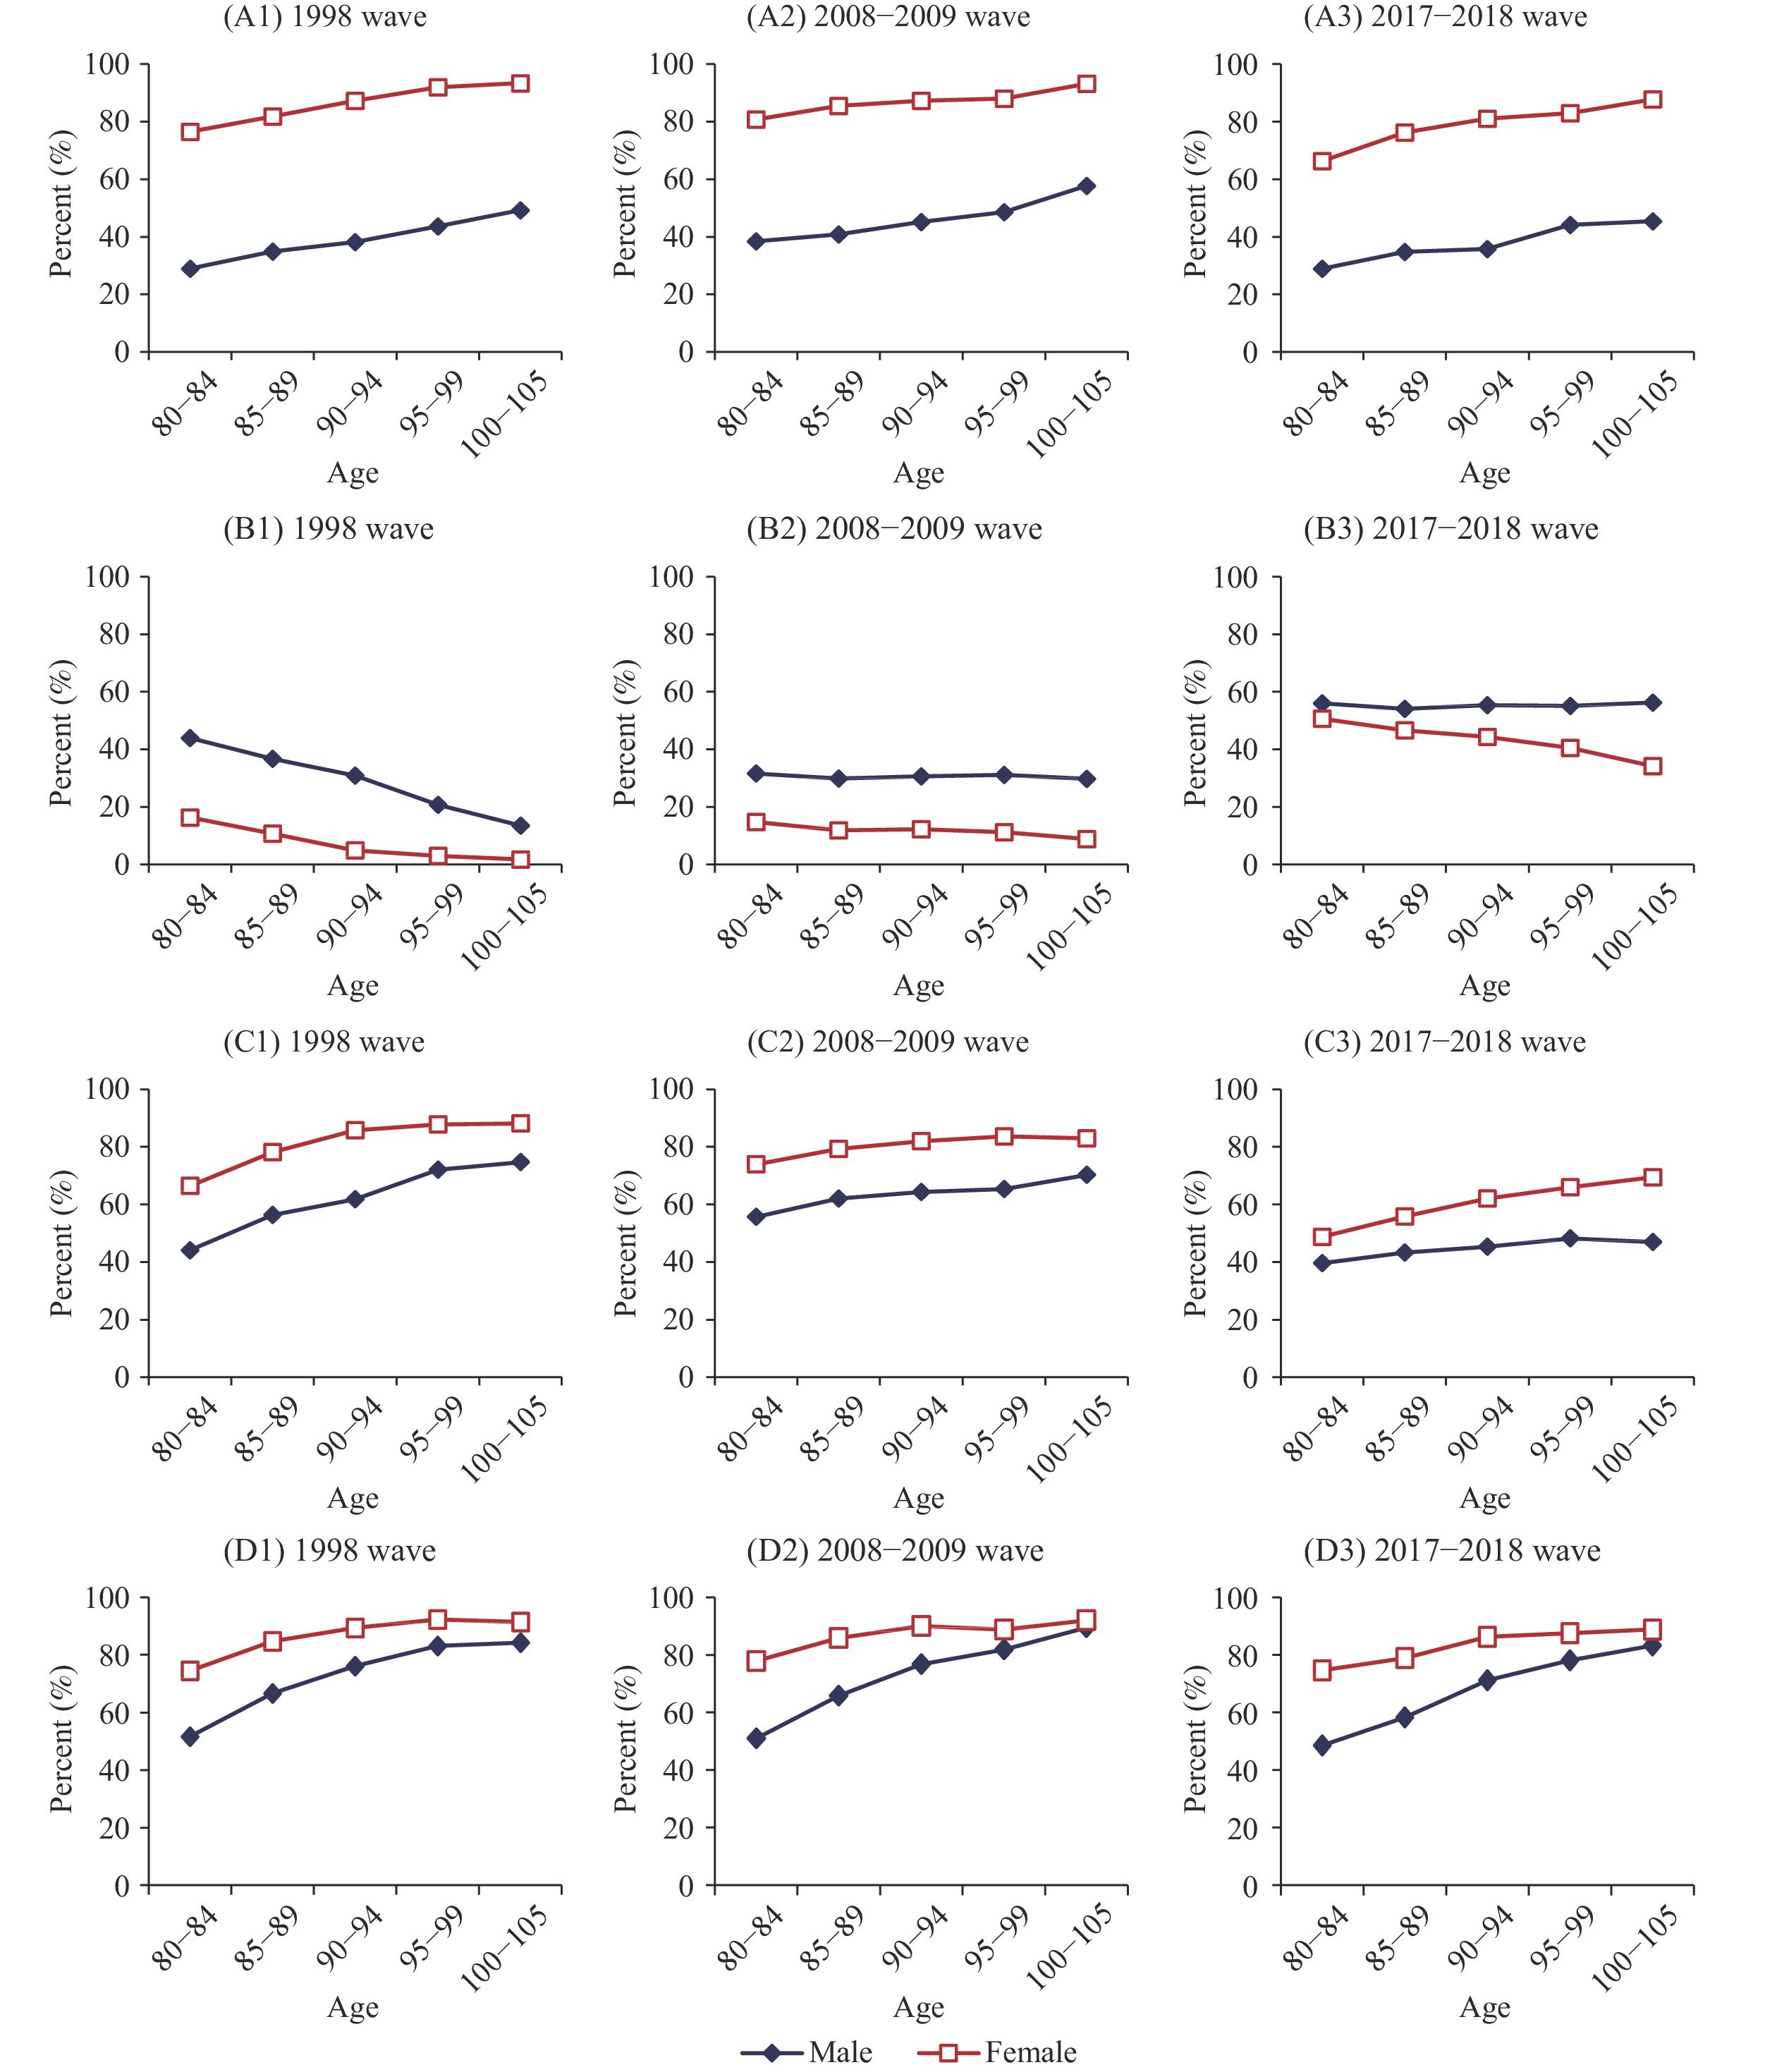 Figure 2.
Gender differences in socioeconomic statuses among the oldest-old in China, 1998–2018. (A) Percent of illiterate among the oldest-old. (B) Percent of pension receivers among the oldest-old. (C) Percent of the oldest-old who mainly rely on children for financial support. (D) Percent of the oldest-old whose primary caregivers were children.
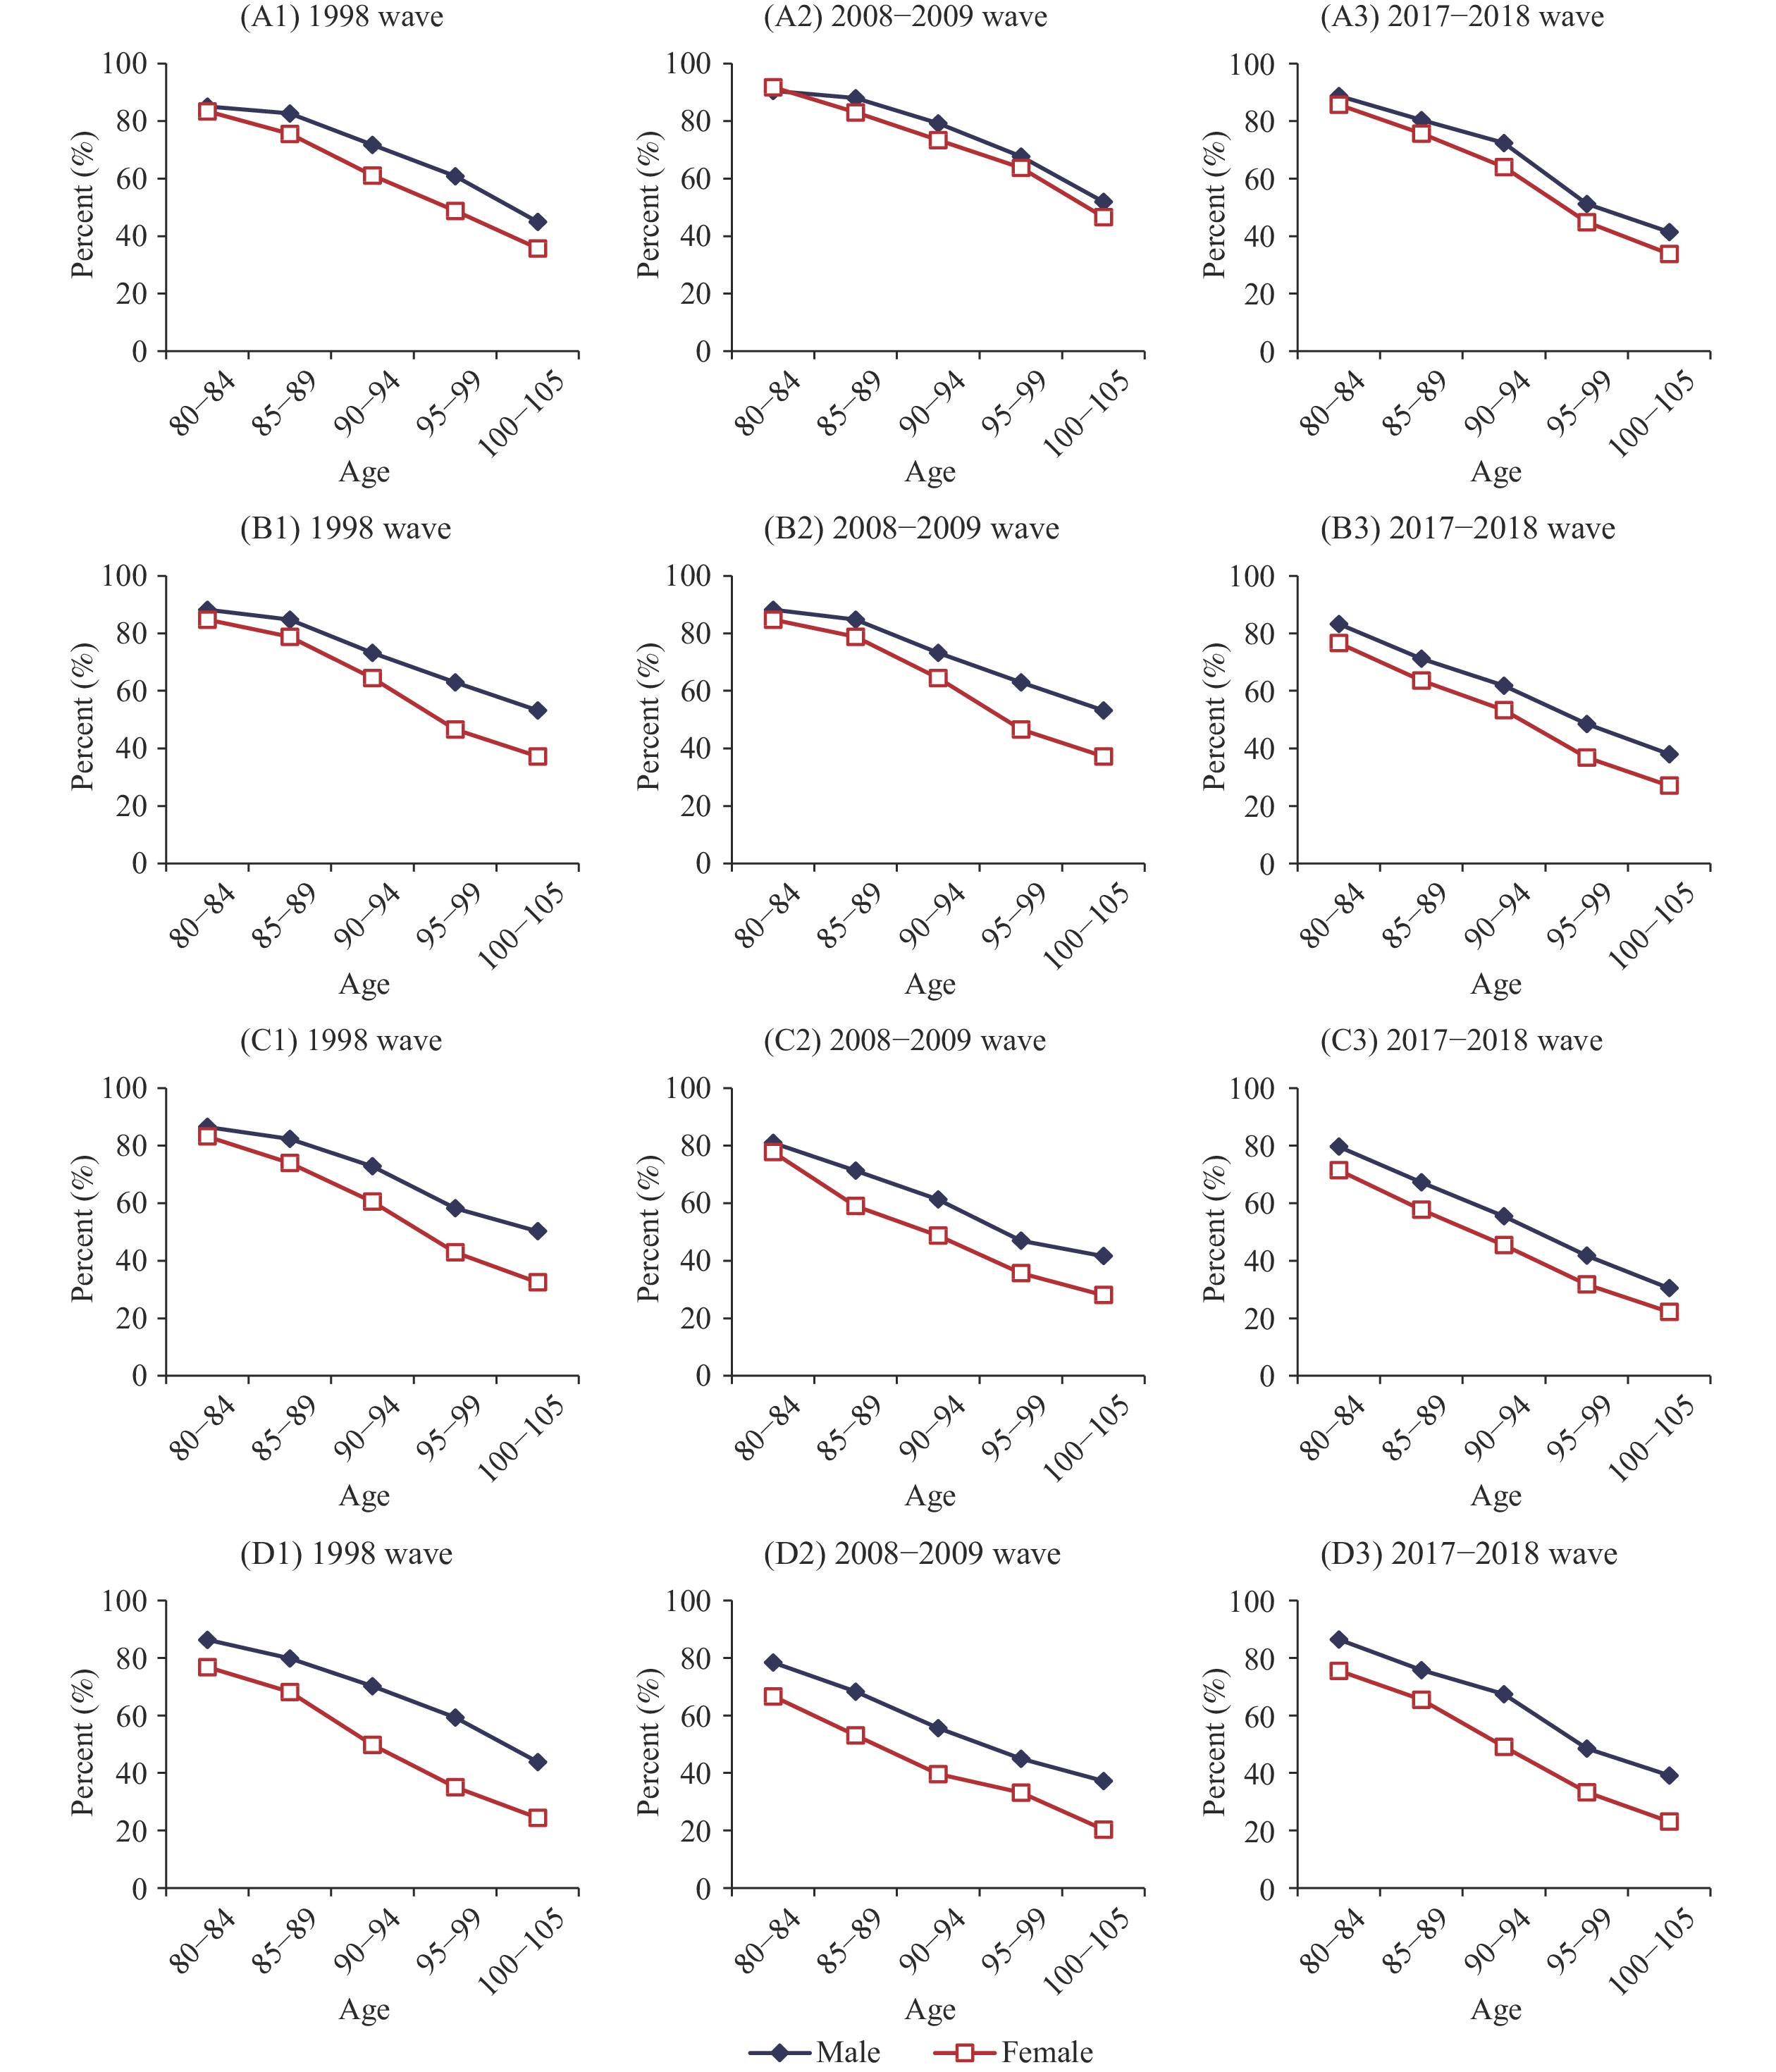 Figure 3.
Gender differences in functional capacities among the oldest-old in China, 1998–2018. (A) Percent of the oldest-old who were active in activities of daily living (ADL). (B) Percent of the oldest-old who could stand-up from a chair without using their hands. (C) Percent of the oldest-old who could pick-up a book on the floor from standing position. (D) Percent of the oldest-old whose cognitive functional capacity is good.
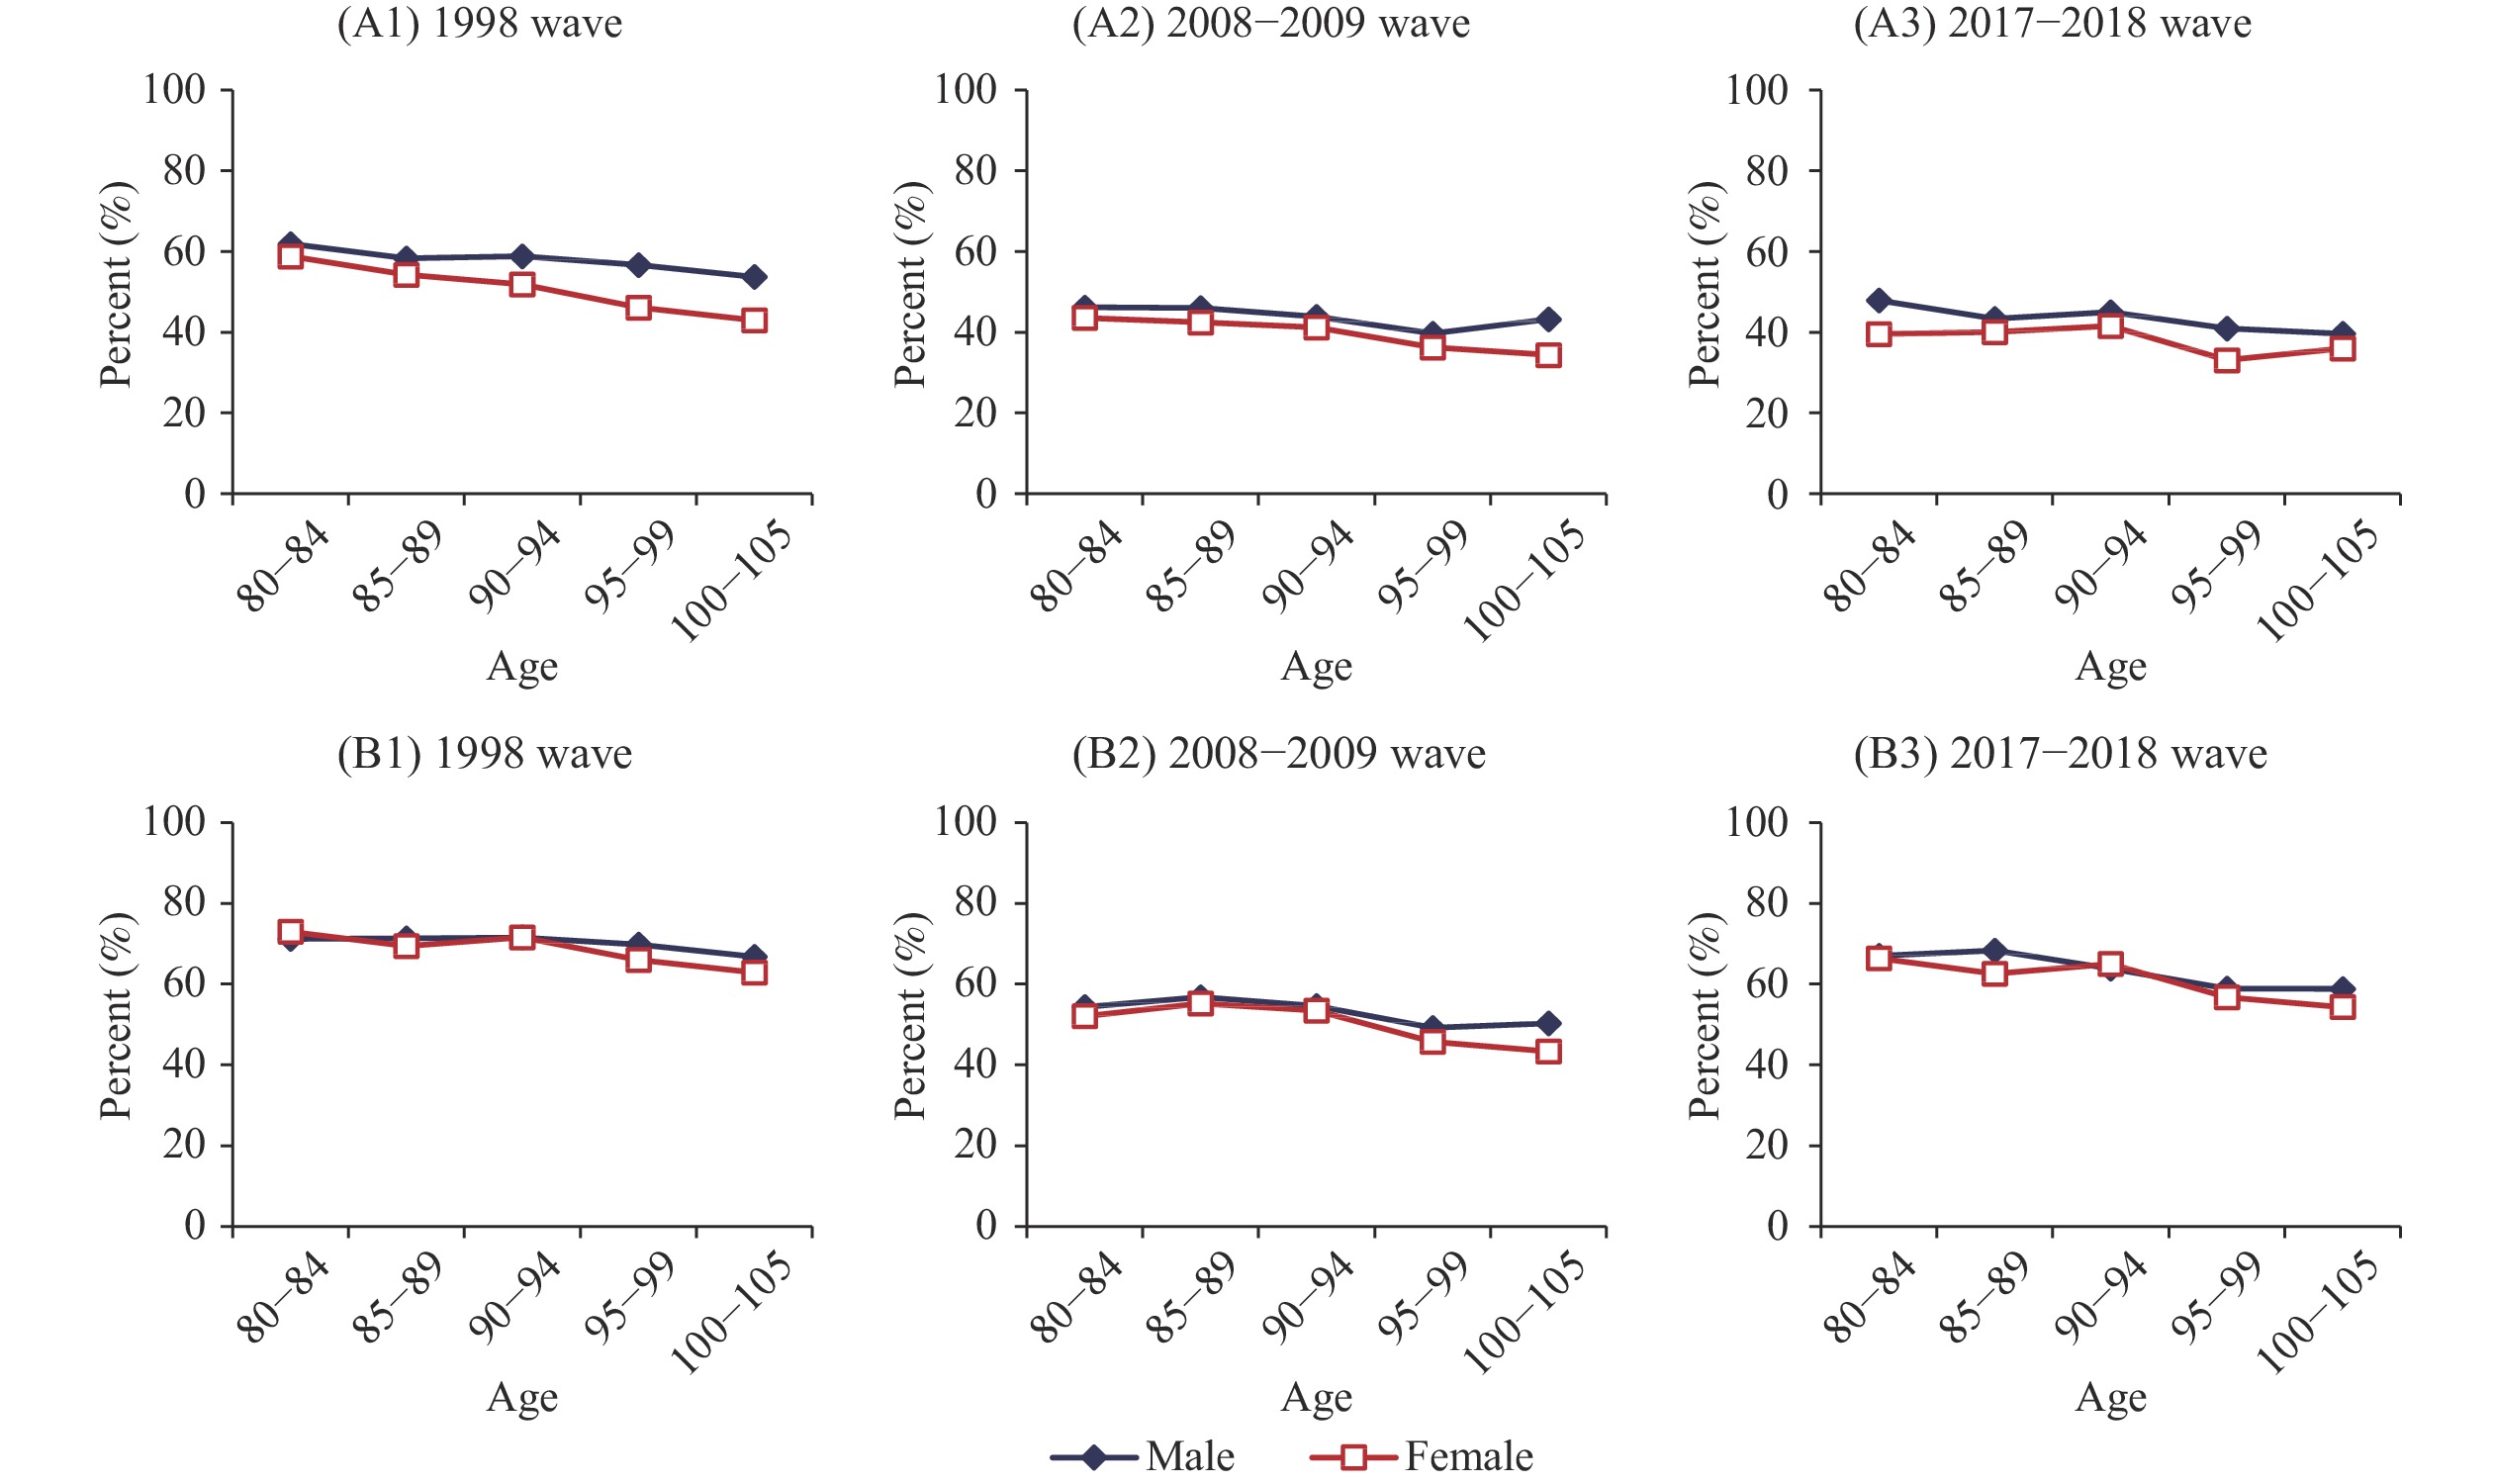 Figure 4.
Gender differences in self-reported health and life satisfaction among the oldest-old in China, 1998–2018. (A) Percent of the oldest-old who self-reported “good health”. (B) Percent of the oldest-old who self-reported “good life satisfaction”.
As shown in Figure 1A, the proportion of female oldest-old who were married was lower than their male counterparts. However, the overwhelming majority were widowed, especially the oldest-old women: 66%–98% of female oldest-old were widows, which was much higher than male oldest-old. The proportions of never-married and divorced male and female oldest-old were extremely low.
Figure 1B presented sex-age-specific percentage distributions of living with spouse and/or children (including children, grandchildren, and other family members), and those living alone. The overwhelming majority of Chinese oldest-old lived with spouses and/or children: 68%–90% for females, 80%–89% for males. Female oldest-old were less likely live with spouse/children up to ages 90–94, and the proportion of oldest-old women who lived alone were higher than the oldest-old men up to ages 90–94.
Figure 2A indicated that about 66%–93% of female oldest-old were illiterate with no schooling, in contrast to 29%–58% of their male counterparts. Many Chinese oldest-old women were found to be illiterate, and females were significantly disadvantaged.
Figure 2B indicated that percent of pension receivers among Chinese female oldest-old were much lower than their male counterparts. The majority of the Chinese oldest-old rely mainly on their children for financial support, and the gender differentials in primary source of financial supports were enormous: oldest-old women rely on their children much more than oldest-old men (Figure 2C).
About 48%–89% of oldest-old men’s primary caregivers were their children, in contrast to 75%–92% of their female counterparts (Figure 2D). The female oldest-old in China relied more on their children as caregivers, as compared to male oldest-old whose primary caregivers were more likely their spouse. This was consistent with a much higher proportion of widowhood existing in female oldest-old than in male oldest-old. Children were often the primary resource of financial support of the oldest-old and also the primary resource of caregiving when the oldest-old were sick.
As shown in Figure 3A, percent of activities of ADL active status declined quickly after age 80, especially after age 85–89. The curve of females who were ADL active was substantially lower than the male curve after age 80–84. The oldest-old women were substantially less active than the oldest-old men in daily living.
Figure 3B indicated that about 80%–88% and 77%–85% of male and female oldest-old aged 80–85, respectively, could stand-up from a chair without using their hands; but the percent decreased quickly after age 85–89. About 38%–53% male centenarians could stand-up from a chair without using their hands, compared to 27%–37% female centenarians. Female oldest-old persons’ capacities to perform picking-up a book on the floor from standing position were significantly worse than their male counterparts (Figure 3C). Male oldest-old physically performed better than female oldest-old did, and the gender gap became larger after age 90–94.
Figure 3D demonstrates that percent of good cognitive function among the Chinese oldest-old declined quickly with increase of age. The Chinese female oldest-old persons’ cognitive capacity was much worse than their male counterparts, and the gender gaps were remarkably large.
As shown in Figure 4A, about 40%–62% of the male oldest-old reported “good health” in contrast to the corresponding percentages of 34%–59% of the female oldest-old. The percentages of self-reported good health among Chinese oldest-old declined slightly from age 80–84 to age 100–105, and even slightly increased from ages 95–99 to ages 100–105 in 2008–2009 and 2017–2018, respectively among females at these very advanced ages. Such pattern of age variations differed from the age patterns of ADL, physical performance, and mini-mental state examination (MMSE). Figure 4D presented the results of self-reported good life satisfaction, which showed that gender differences in self-reporting good life satisfaction among Chinese oldest-old were mostly negligible in 1998, 2008–2009, and 2017–2018.
-
Populations of the oldest-old aged 80 years and over are growing extremely quickly in China and worldwide. Figures 1–4 demonstrated that female oldest-old were disadvantaged as compared to their male counterparts. Oldest-old women were much more likely to live alone as they have higher risk of losing husbands due to higher mortality rates in male oldest-old, while female widows have lower likelihood to remarry. Compared to male oldest-old, the proportion of pension receivers among female oldest-old was much lower, and they were often less educated, economically more dependent, and more reliant on children for financial support and for care when sick.
Oldest-old women were more likely to be disabled in activities of daily living, physical performances, and cognitive function. Other studies in China (2–3) and elsewhere (4–5) also reported that elderly women were more disabled than men. Self-reported good health did not decline significantly with increase in age, which may be due to declining expectations of health with increasing age among the oldest-old in China and elsewhere (6). Furthermore, gender differences in self-reported life satisfaction among the Chinese oldest-old were mostly negligible as demonstrated in all of the datasets of CLHLS 1998, 2008–2009, and 2017–2018 waves (Figure 4B).
At the same time, however, the oldest-old Chinese women were seriously disadvantaged in marital status, living arrangements, education, pensions, financial resource, ADL, physical performance, and cognitive function as compared to their male counterparts (Figures 1–3). Female oldest-old were also disadvantaged (to a less serious degree) in self-reported health, as shown in Figure 4. Chinese oldest-old women may be more positive in facing life’s challenges and their general expectations in life satisfaction may be lower than their male counterparts. The percentages of self-reported good health and life satisfaction among Chinese male and female oldest-old did not decline or declined only slightly across age groups (Figure 4), while their functional capacities declined quickly with increases in age (Figure 3).
Female oldest-old’s life expectancy at ages 80 and 90 were 18.7% and 16.0% higher, respectively, than that of male oldest-old in China in 2020 (article in submission; email Corresponding Author for more information). These contributed to the well-known “male-female health-survival paradox” (7). Similar gender differentials have also been found in other countries. For example, based on the data from the U.S. Long Term Care Surveys (1982–1994), Manton and Land (8) found that, although American oldest-old women have a longer total life expectancy at the age of 80 and 85, they have significantly shorter active life expectancy as compared to American oldest-old men; such female disadvantages continue to the end of the U.S. health life tables.
Three preliminary explanations may shed light on understanding the “male-female health-survival paradox” and the gender differentials of the familial, socioeconomic and health statuses in China and elsewhere. First, the lifestyle of smoking and drinking strong alcohol was much lower among female oldest-old than male oldest-old in China, which contributed to oldest-old women’s longer lifespan. It was generally considered inappropriate for a woman to smoke or to attend a formal dinner (or banquet) at which the male hosts and participants drank a lot of strong alcohol in the traditional Chinese society. Thus, female Chinese oldest-old were subjected to a substantially lower risk of smoking and drinking strong alcohol that reduced lifespan.
Second, as compared to their male counterparts, female oldest-old were less likely to perform outdoor physical activities, such as farming, exercising, and fishing. Oldest-old women were also less likely engaged in reading, writing, meetings, and social and cultural activities, as they have lower levels of education and socioeconomic status. Female oldest-old persons’ lower frequency of performing outdoor activities and lower education levels and socioeconomic status gave them fewer opportunities to maintain their capacities in activities of daily living, physical performance, cognitive function, and to obtain health services when they were sick.
Third, we recently discovered that genetic associations with longevity benefit females significantly more than males through analyzing datasets of genome-wide association study on 2,178 centenarians and 2,299 middle-age controls of CLHLS participants. This novel discovery was replicated across North and South regions of China and was further reconfirmed by analyses of different datasets of Chinese healthy aging candidate genes with 2,972 centenarians and 1,992 middle-age controls of CLHLS participants (article in submission; email Corresponding Author for more information).
In conclusion, the CLHLS 20-years longitudinal survey observations have consistently demonstrated the oldest-old women’s serious disadvantages in familial and socioeconomic statuses, capacities of activities of daily living, physical performance and cognitive function, and self-reported health and life satisfaction. These findings imply that long-term care service programs should take into account the disadvantaged status of the female oldest-old. Government at all levels and society more broadly need to pay attention to enormous gender differentials in pensions and main source of financial support for the oldest-old persons. Very careful attention in policymaking and implementation should be given to ensure that any old age insurance and social service programs be developed or reformed to better prioritize the female oldest-old.
While the present study made significant contributions in providing empirical evidences of gender differences in familial, socioeconomic and health statuses of oldest-old aged 80 years and over in China, it also had limitations. In this paper, we adjusted only for genders and ages to ascertain the factual gender differentials in marital status, living arrangements, socioeconomic status, capacities in activities of daily living, physical performance, cognitive functions, self-reported health, and life satisfaction. However, other possible confounding factors were not controlled for. For example, as demonstrated in Figure 3D, we discovered that the gender differences in cognitive function among the Chinese oldest-old were extremely large. Due to space limits and the policy analyses nature of the present paper, we did not quantitatively explore which of the complicated factors caused such a large gender gap. We will conduct in-depth investigations on the causal determinants and impact factors of the gender differences in our future academic research articles, through employing the multivariate statistical methods such as sophisticated regression analyses.
HTML
| Citation: |

|