

 Download:


-
Introduction: New data has become available on the implementation of tuberculosis/human immunodeficiency virus (TB/HIV) two-way screening and anti-TB treatment for TB/HIV coinfected patients in China from 2015 to 2019, which can be used to propose key strategies for further TB/HIV prevention and treatment.
Methods: The report on TB/HIV coinfection in the mainland of China from 2015 to 2019 was collected to compare the annual trend and the rate of geographical distribution.
Results: From 2015 to 2019, the proportion of TB screening using chest x-ray or sputum examination among HIV-positive people increased from 79.8% to 88.0% (p<0.01). The proportion ranged from 40.7% to 97.1% among various provincial-level administrative divisions (PLADs), with a median of 87.3%. TB prevalence among HIV-positive people decreased from 1.1% to 0.8% (p<0.01) over the 5 years. The proportion of HIV testing among TB patients increased from 46.0% to 64.0% (p<0.01). The prevalence of HIV among TB patients increased from 0.8% to 1.1% (p<0.01). The success rate of anti-TB treatment for TB/HIV patients was 87.6%, and the primary reason for unsuccessful treatment were death (5.3%) and other reason such as availability of only basic treatment options (5.0%).
Conclusions and Implications for Public Health Practice: TB/HIV two-way screening in China improved significantly during the 5-year period, however there were large regional differences and gaps in target HIV-screening rates among TB patients, suggesting that two-way screening in some PLADs and the HIV screening among TB patients should be strengthened. Early diagnosis, early treatment, and treatment management of TB/HIV patients should also be strengthened.
-
Tuberculosis (TB) and human immunodeficiency virus/acquired immunodeficiency syndrome (HIV/AIDS) are both chronic infectious diseases that present major public health challenges globally. Together, TB and HIV can lead to coinfections that promote the severity of symptoms and likelihood of fatality and present an even greater challenge to the global health community. TB is the most common opportunistic infection and the most important cause of death for HIV/AIDS patients. In the absence of effective prevention and control measures, it can account for 1/3 of the total deaths of HIV/AIDS patients. At the same time, the immunosuppressive state of HIV/AIDS patients puts them at greater risk of TB infection, up to 19 times higher than individuals not affected by HIV (1). In 2018, there were 10 million cases of TB in the world, 8.6% of which were comorbid with HIV; 1,451,000 TB patients died, of which 251,000 (17.3%) were HIV positive (2). China is one of the 30 countries with a high burden of TB, ranking third in the world in terms of annual incidence and also one of the 30 countries with a high burden of TB/HIV coinfection. In 2018, an estimated 18,000 new TB/HIV coinfections occurred (2). Earlier detection, earlier diagnosis, and earlier anti-TB and anti-retroviral therapy are effective measures to reduce the number of deaths of TB/HIV patients. Therefore, two-way screening, i.e. routine TB screening for HIV patients and HIV testing for TB patients, should be implemented to find TB/HIV coinfection as early as possible (3).
-
Each year, a formatted report on TB/HIV coinfection is required to be submitted to China CDC by 31 provincial-level administrative divisions (PLADs) in mainland China. Information in the report includes two-way screening and treatment outcomes of TB/HIV patients, of which the data quality is supervised by China CDC. Data in this study were collected from the reports from 2015 to 2019, aggregated in Excel, and verified for logical errors.
The rates were compared using tables and a chi-squared test and further analyzed using a Cochran-Armitage test for trend (α=0.05) using SAS (version 9.4, SAS Institute). Data in various PLADs was presented as a spatial distribution using ArcGIS 10.6 (Esri Institute).
-
During 2015–2019, a total of 3,771,942 HIV/AIDS patients were registered and under supervision, 659,676 of whom were newly diagnosed and 3,112,266 were previously documented (Table 1). Among them, 3,540,831 (93.9%) underwent TB screening using symptom query, including 618,197 (93.7%) among newly diagnosed patients and 2,922,634 (93.9%) among existing patients (χ2=35.89, p<0.01). In the past 5 years, the proportion of patients undergoing TB screening using symptom query decreased from 94.2% to 92.7% (z=–17.94, p<0.01) among newly diagnosed patients and increased from 93.1% to 93.9% (z=15.53, p<0.01) among existing patients. In total, 3,216,466 (85.3%) underwent TB screening using chest x-ray or sputum examination, including 572,544 (86.8%) among newly diagnosed patients and 2,643,922 (85.0%) among existing patients (χ2=1467.49, p<0.01). In the 5 years, the proportion undergoing chest x-ray or sputum examination increased from 82.9% to 89.0% (z=32.40, p<0.01) among newly diagnosed HIV/AIDS patients and increased from 79.0% to 87.8% (z=160.90, p<0.01) among existing patients. Among the HIV/AIDS patients underwent TB screening using any method, 28,694 (0.9%) were diagnosed as TB, including 11,514 (2.0%) among the newly diagnosed patients and 17,180 (0.6%) among existing patients (χ2=9863.31, p<0.01). From 2015 to 2019, TB detection rate among the newly diagnosed HIV/AIDS patients decreased from 2.1% to 1.9% (z=–2.69, p<0.01) and decreased from 0.9% to 0.6% (z=–17.88, p<0.01) among existing patients.
Category Year HIV-positive Symptom screening Chest or sputum testing TB-positive Newly diagnosed 2015 112,264 105,788 (94.2) 93,098 (82.9) 1,981 (2.1) 2016 120,428 113,706 (94.4) 103,073 (85.6) 1,972 (1.9) 2017 133,541 125,106 (93.7) 116,665 (87.4) 2,410 (2.1) 2018 145,122 136,144 (93.8) 127,725 (88.0) 2,706 (2.1) 2019 148,321 137,453 (92.7) 131,983 (89.0) 2,445 (1.9) Subtotal 659,676 618,197 (93.7) 572,544 (86.8) 11,514 (2.0) Follow-up 2015 440,307 409,899 (93.1) 347,645 (79.0) 3,078 (0.9) 2016 524,594 494,264 (94.2) 431,394 (82.2) 2,954 (0.7) 2017 625,097 585,167 (93.6) 521,625 (83.4) 3,192 (0.6) 2018 702,018 663,259 (94.5) 622,815 (88.7) 3,924 (0.6) 2019 820,250 770,045 (93.9) 720,443 (87.8) 4,032 (0.6) Subtotal 3,112,266 2,922,634 (93.9) 2,643,922 (85.0) 17,180 (0.6) Total HIV 2015 552,571 515,687 (93.3) 440,743 (79.8) 5,059 (1.1) 2016 645,022 607,970 (94.3) 534,467 (82.9) 4,926 (0.9) 2017 758,638 710,273 (93.6) 638,290 (84.1) 5,602 (0.9) 2018 847,140 799,403 (94.4) 750,540 (88.6) 6,630 (0.9) 2019 968,571 907,498 (93.7) 852,426 (88.0) 6,477 (0.8) Subtotal 3,771,942 3,540,831 (93.9) 3,216,466 (85.3) 28,694 (0.9) Table 1. TB screening among HIV-positive patients in China, 2015–2019 [n(%)].
Among the 31 PLADs, proportion of TB screening using symptom query ranged 40.7%–99.2%, with a median of 94.2%, and 28 (90.3%) of the PLADs achieved rates ≥90%. Regions with lower proportions of TB screening were mainly in central and western parts of the country (Figure 1A). Prevalence of TB among the HIV/AIDS patients ranged from 0.2%–5.2%, with a median of 0.7%, and 7 (22.6%) of the PLADs had TB prevalence among the HIV/AIDS patients over 1%, including Tibet (5.2%), Qinghai (4.2%), Guangxi (2.2%), Beijing (2.2%), Jiangxi (1.6%), Gansu (1.2%), and Guizhou (1.1%).
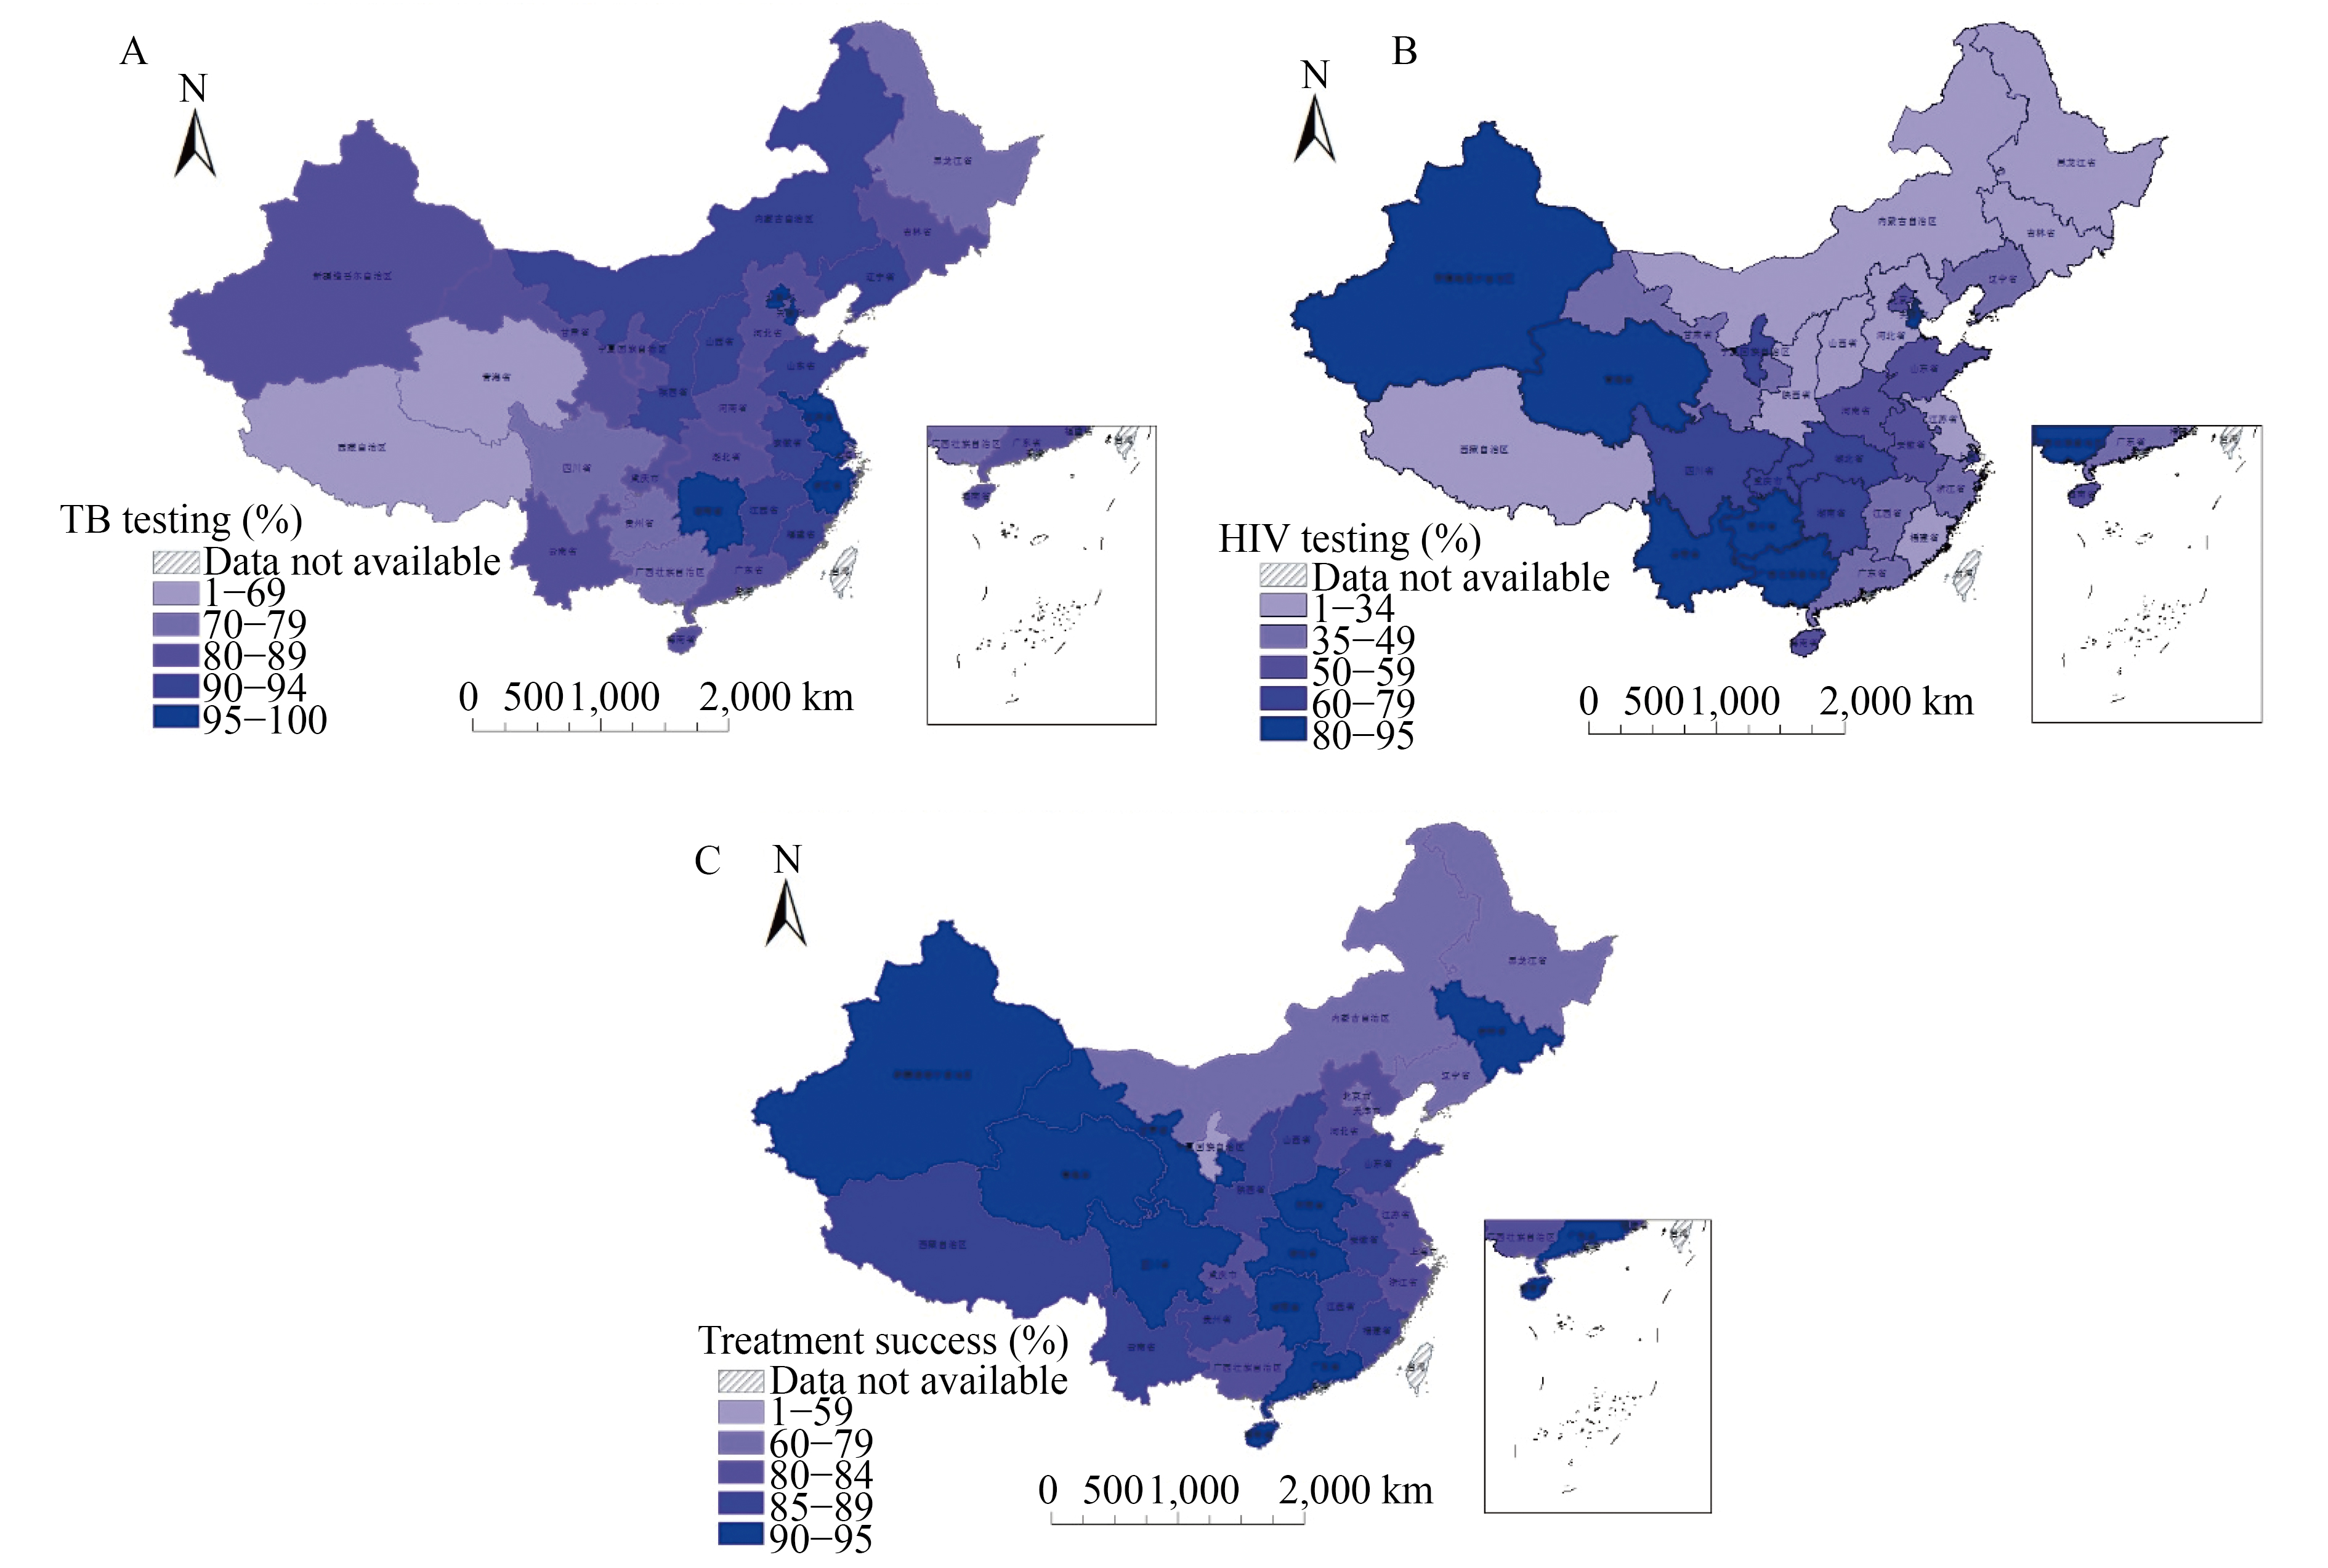 Figure 1.
Geographical distribution of TB/HIV double screening and anti-TB treatment outcomes for TB/HIV patients in China, 2015–2019. (A) TB screening among HIV/AIDS patients. (B) HIV testing among TB patients. (C) Anti-TB treatment for TB/HIV patients.
From 2015 to 2019, a total of 3,865,549 TB patients were registered in mainland China, among whom 13,446 (0.3%) knew their HIV positive status at the time of diagnosis (Table 2). The proportion of knowing their HIV positive status increased from 0.3% to 0.5% (z=30.87, p<0.01) during the 5-year period. During the same period of time, in total, 2,126,518 (55.0%) TB patients underwent HIV testing, with the proportion increasing from 46.0% to 64.0% (z=252.40, p<0.01). Among TB patients that underwent HIV testing at diagnosis, the HIV positive rate was 0.3%, increasing from 0.2% (z=3.09, p<0.01). Overall, 19,023 (0.9%) of TB patients were found to be positive, including those previously who previously knew their status, with the number increasing over 70%, and the proportion increasing from 0.8% to 1.1% (z=16.29, p<0.01) in the 5-year period.
Year TB registered
individualKnown HIV-positive
statusUnderwent
HIV testingNewly detection
HIV-positive statusHIV-positive 2015 798,098 2,041 (0.3) 366,984 (46.0) 894 (2.4) 2,935 (0.8) 2016 771,841 2,081 (0.3) 394,099 (51.1) 1,013 (2.6) 3,094 (0.8) 2017 774,706 2,330 (0.3) 420,875 (54.3) 1,050 (2.5) 3,380 (0.8) 2018 790,182 3,196 (0.4) 477,255 (60.4) 1,372 (2.9) 4,568 (1.0) 2019 730,722 3,798 (0.5) 467,305 (64.0) 1,248 (2.7) 5,046 (1.1) Total 3,865,549 13,446 (0.3) 2,126,518 (55.0) 5,577 (2.6) 19,023 (0.9) Table 2. HIV screening among TB patients in China, 2015–2019 [n(%)].
Among the 31 PLADs, the proportion of HIV testing among TB patients ranged 8.9%–94.8%, with a median of 52.3% (Figure 1B). Among TB patients that underwent HIV screening, the overall HIV positive proportion ranged 0.1%–2.4%, with a median of 0.5%; 5 (16.1%) PLADs had proportions of HIV-positivity of ≥1%, including Sichuan (2.4%), Guangxi (2.4%), Fujian (1.8%), Chongqing (1.5%), and Yunnan (1.2%).
During 2014–2018, 30,849 TB/HIV patients were registered and enrolled in anti-TB treatment program, of whom 27,033 (87.6%) were successfully treated. For patients with different categories of TB (including resistance to various drugs), the success rates of anti-TB treatment were statistically different (χ2=510.96, p<0.01). Patients with smear negative pulmonary TB had the highest success rate (89.6%), and those with extra-pulmonary TB had the lowest success rate (69.1%). Death (5.4%), either from non-TB or TB, accounted for the highest proportion unsuccessfully treated patients, followed by other reasons (5.0% including response refusal), lost to follow-up (1.2%), and treatment failure (0.8%).
In the 31 PLADs, rates of anti-TB treatment success among TB/HIV patients ranged 53.3%–95.1% with a median of 86.4%; 10 (32.3%) PLADs achieved success rates of ≥90%, but 7 (22.6%) had rates of <80%.
-
This study examined the trends of TB/HIV coinfections in China from 2015 to 2019 and found that significant challenges still remained. The burden posed by TB/HIV coinfections increased by nearly 75% during this period. While the proportion of HIV patients receiving TB screening via chest x-ray or sputum examination increased from 79.8% to 88.0% during this period, this proportion still remains below the strategic requirements and are especially prominent in central and western China, suggesting a suboptimal allocation of resources in active TB case finding among people living with HIV. Furthermore, HIV screening amongst TB patients improved from 46% to 64%, which still does not meet the 100% target proposed by the End TB Strategy. TB prevalence among newly-diagnosed HIV patients was 2.0%, which was higher than 0.6% prevalence among existing HIV patients, indicating that earlier TB screening is crucial for HIV/AIDS. Outcomes of anti-TB therapy for TB/HIV patients also showed no improvements in this period.
Due to the implementation of a modern TB control strategy, the global TB pandemic is declining (2). The World Health Organization (WHO) put forward the ambitious goal of ending TB by 2035, and the management of TB/HIV coinfected patients is a major component of this effort (4). The results of this analysis showed that from 2015 to 2019, the number of TB patients registered in China decreased at a rate of 2.2% per year but the total number of HIV/TB patients were increasing. As HIV-positive people are at higher-risk of TB infection, the continuous rise of the HIV epidemic is posing a severe challenge for TB control in China.
Implementing two-way screening is an important strategy for the early active detection of TB/HIV coinfected patients. China has set forth a target of 90% TB screening rate among HIV/AIDS patients (3). The results of this analysis showed that the proportion of HIV positive people undergoing TB screening based on symptoms, chest x-ray, or sputum has increased in the five year period, indicating that the cooperation between TB and HIV control institutions has gradually strengthened. In addition, areas with low TB screening rates were mainly concentrated in the central and western PLADs, which were also areas with comparatively high TB incidence. The next step should be to optimize the allocation of resources and promote active case finding of TB among HIV-positive individuals in central and western China.
Recording HIV status for all TB patients is key component of the WHO’s End TB Strategy (2). In terms of geographical distribution, the proportion of TB patients having underwent HIV screening was higher in most areas of the southwest, but lower in some north PLADs. However, voluntary HIV counseling and testing carried out among TB patients may meet more resistance due to lack of HIV awareness, fear of HIV, a sense shame, and other reasons (5-7). In a cross-sectional study of Peru, the HIV screening rate among TB patients was 61.8% in routine procedures, and this rate increased to 76.1% after extra interventions by researchers (5). From 2011 to 2013, the HIV screening rate among TB patients in Hefei Province increased from 40.2% to 53.5%, which was likely due to the extensive mobilization of TB patients to TB designated hospital (7). Our study suggested that in the areas with low HIV screening rates, it was necessary to fully integrate local TB control facilities, improve the awareness of patients on HIV, and include HIV testing into routine TB testing projects.
Compared with the TB detection rate among HIV positive patients, the HIV positive rate among TB patients was lower with only 0.3% of TB patients testing positive for. In addition, the HIV positive rate of all TB patients was 0.9% overall. According to a systematic review conducted in mainland China before 2010, this proportion was close to the result of HIV infection rate of TB patients, 0.9% (0.6%–1.4%) (8). A meta-analysis of foreign studies shows that the prevalence of TB/HIV coinfection was 2.9%–72.3%, of which 25.2% were HIV positive from TB screening, and the highest rate among African countries is 31.3% (9). A meta-analysis of studies in sub Saharan Africa showed that the overall HIV prevalence among TB patients was 31.8% (95% CI: 27.8–36.1) (10). Globally, prevalence of HIV among TB patients was 11% (2).
Although the overall HIV prevalence among TB patients in China was lower than that of some other countries, the HIV positive rate increased from 0.8% to 1.1% during the study period, and the prevalence in some areas was far higher than that of the whole country. For example, Urumqi City in Xinjiang reported that the HIV positive rate among TB patients in 2007–2015 was 8.3% (11). The results indicate that the HIV prevalence among TB patients is increasing in China, and it is necessary to pay more attention to HIV screening among TB patients.
Overall success rate of anti-TB treatment for TB/HIV patients in 2014–2018 cohort was 87.6%, which was higher than the global level of 75% in 2018 (2). However, in some areas with a high burden of TB/HIV, the success rate of treatment was far lower than the national level. Delays in the diagnosis of TB/HIV patients was an important risk factor in the failure of treatment, which was mainly due to the imperfect linkage mechanism between the disease control institution and the treatment institutions (12). At a country scale, however, more research is needed to uncover the main reasons for unfavorable outcomes of anti-TB treatment among TB/HIV patients. From this current study, the rising rates of mortality and unsuccessful basic treatment among TB/HIV patients is a major concern and should be targeted. The next step should be to enhance the cooperation and linkage mechanisms between TB and HIV prevention and control institutions to ensure earlier detection of TB/HIV patients and earlier treatment.
HTML
| Citation: |

|