-
Along with the announcement of COVID-19 as a global pandemic by the World Health Organization (WHO) on March 12, 2020, COVID-19 appeared to be spreading rapidly around the world. By 10:00 CET on April 1, 2020, a total of 740,995 confirmed cases and 37,277 deaths were reported from 204 foreign countries and regions on 6 continents plus the Diamond Princess international cruise ship; among them, 161 countries and regions had local transmission. Cumulatively, the WHO website reported 23,791 confirmed COVID-19 cases from 18 countries and regions in the Western Pacific (excluding China), 464,212 cases from 60 countries and regions in Europe, 5,175 cases from 10 countries and regions in South-East Asia, 54,281 cases from 21 countries and regions in the Eastern Mediterranean, 188,751 cases from 51 countries and regions in the Americas, and 4,785 cases from 44 countries and regions in Africa (1).
In this report, using publicly issued COIVD-19 data on the internet, particularly the data from March 26 to April 1, 2020, the pandemic trends globally, regionally, and by country were evaluated. The risk of case importation into China was also analyzed.
-
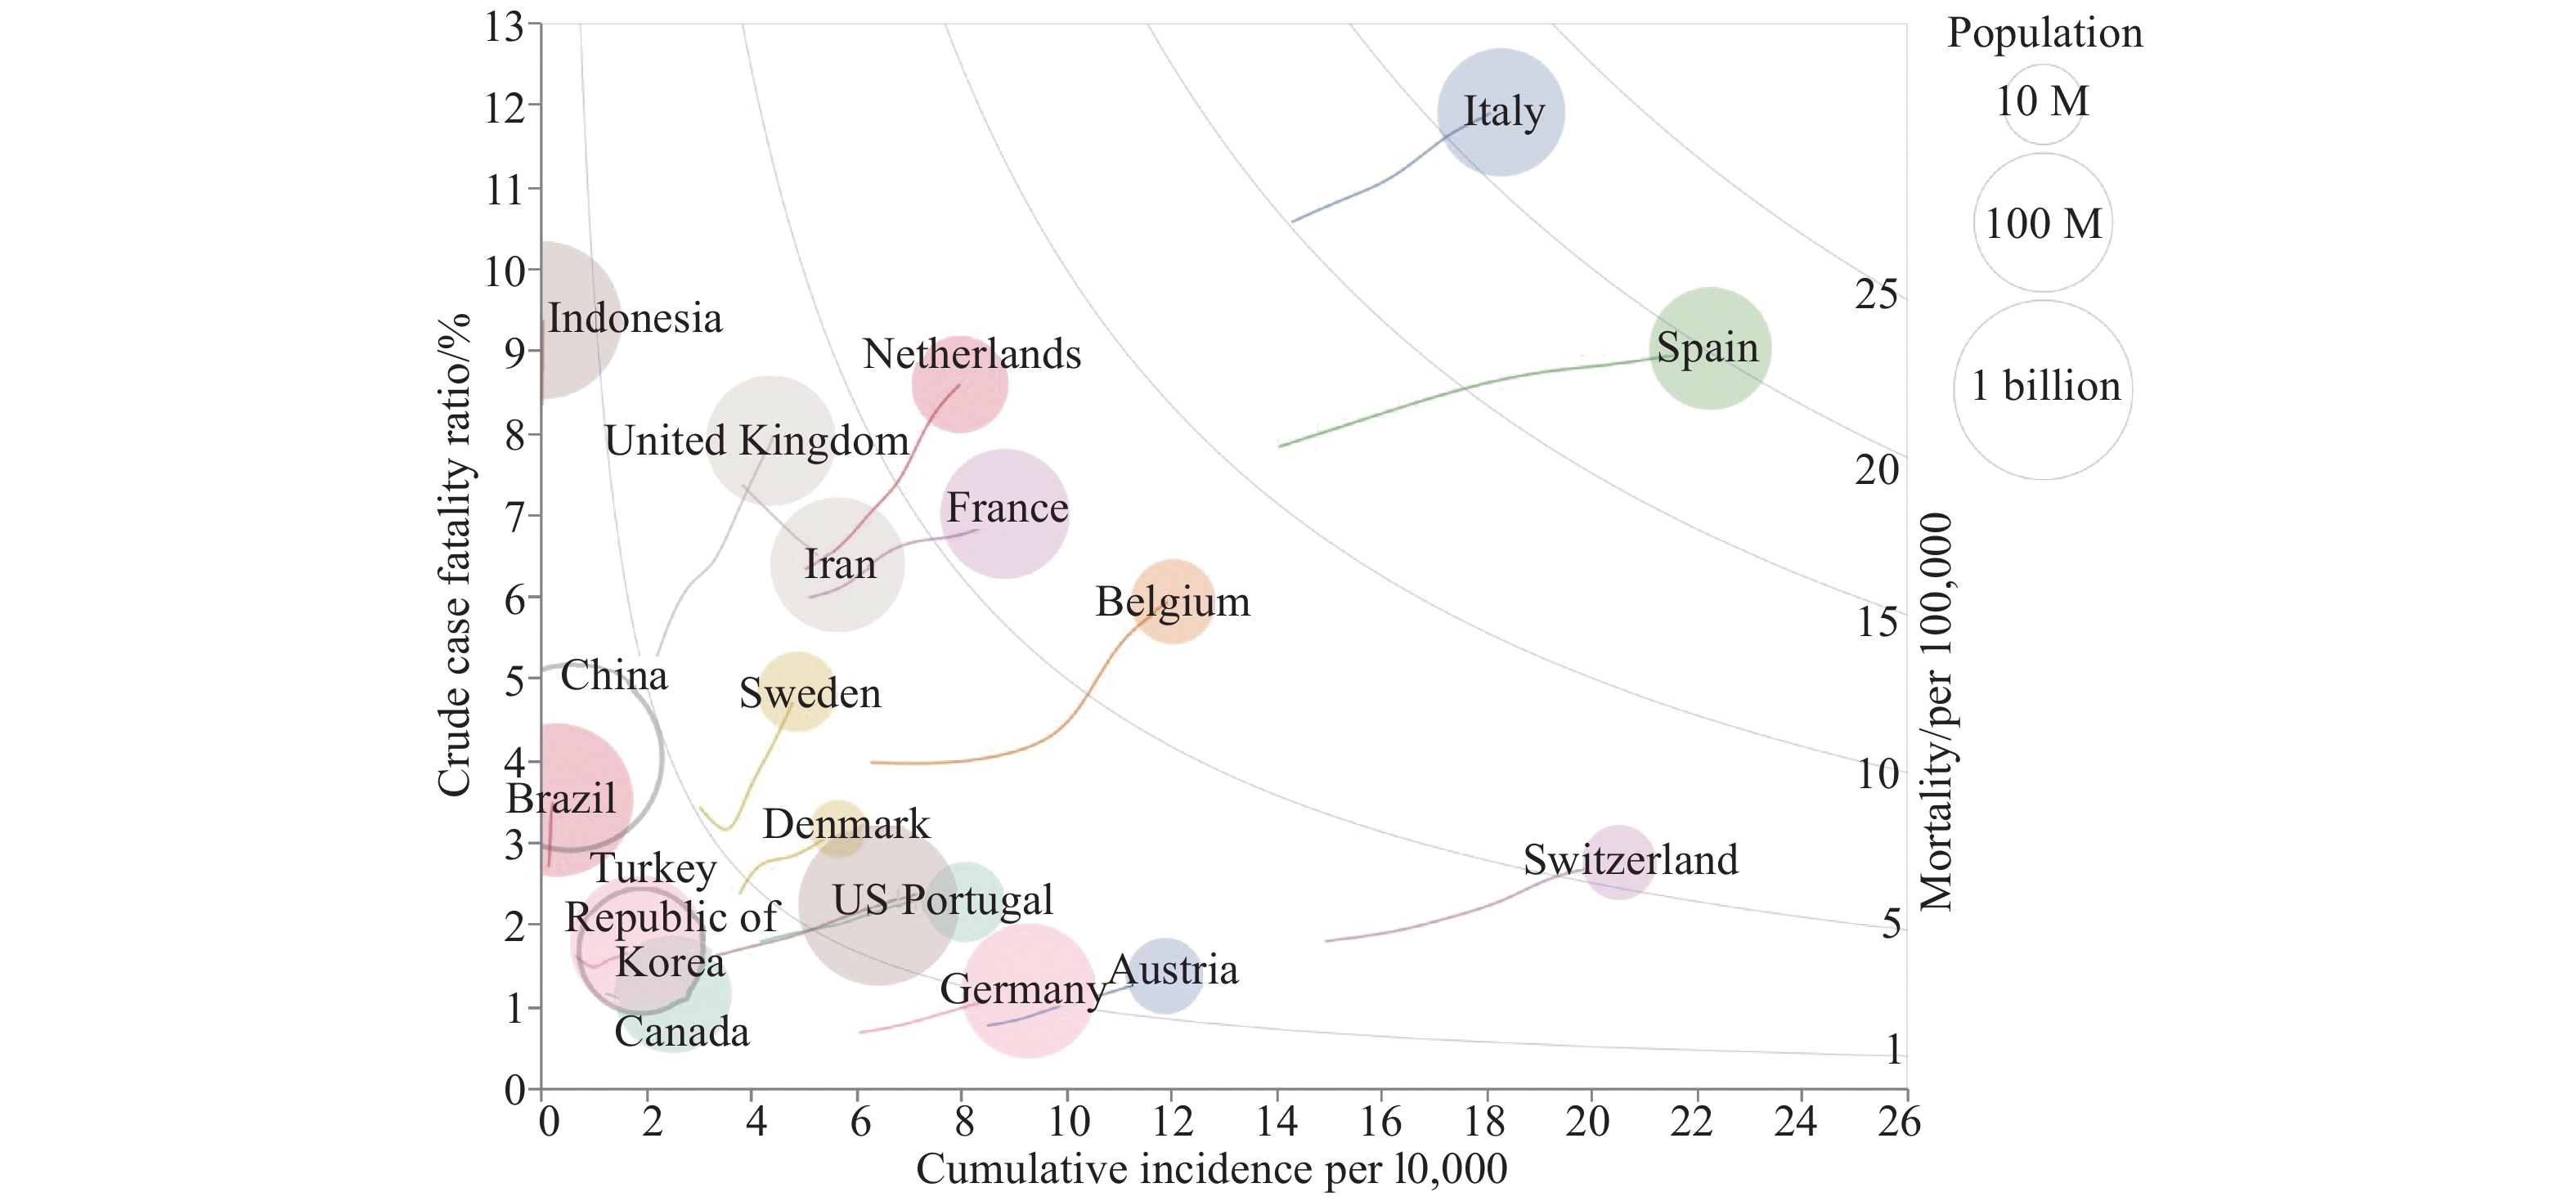
To evaluate the severity and spread of COVID-19 in one special country in one framework, 19 countries with the fatal confirmed cases over 100 by April 1 were selected. The crude case fatality ratio (CFR, total deaths/total cases) and the cumulative incidence (CI, total cases/total population) of each country were calculated and showed on the Y-axis and the X-axis, respectively (Figure 1). The blue isolines of the mortality rate were obtained as the product of CI and CFR. The balloon size was proportional to the population size and the small rope of the balloon traced the history of changes related to the CI and CFR in each country in the past 7 days. As shown in Figure 1, Italy and Spain were located at the zone of mortality between 20 and 25 deaths per 100,000. Both the CI and CFR of Italy rose continually, whereas the CI of Spain increased more noticeably when compared to the data of the past 7 days. The Netherlands, France, Belgium, and Switzerland were in the mortality zone between 5 and 10 deaths per 100,000, with a higher CFR in the Netherlands and a higher CI in Switzerland. The rapidly increasing CI in Switzerland may be closely linked to the high percentage of people tested among the general population.
 Figure 1.
Comparison of the COVID-19 crude case fatality ratio (Y axis = total deaths/total cases), cumulative incidence (X axis = total cases/total population), and mortality (the isoline = total deaths/total population) of 19 countries with more than 100 fatal cases by April 1, 2020. The size of balloon was proportional to the country's population size. The small rope of the balloon traced the history of changes related to CI and CFR in the past 7 days. M=million.
Eight countries were located at the mortality zone of 1–5 deaths per 100,000, including the UK, Iran, Sweden, Denmark, USA, Portugal, Austria, and Germany. Compared with the data of the past 7 days, the UK increased rapidly both in CFR and CI, while Iran seemed to decrease its CFR accompanying an increase in CI. USA and Germany moved from the lowest zone of mortality (0–1/100,000) to the next level in the past 7 days. Indonesia, China, Brazil, Republic of Korea, Turkey, and Canada were at the lowest zone, in which Indonesia revealed much higher CFR and low CI. Due to its large population size, more attention should be paid to potential changes in Indonesia in the coming week.
-
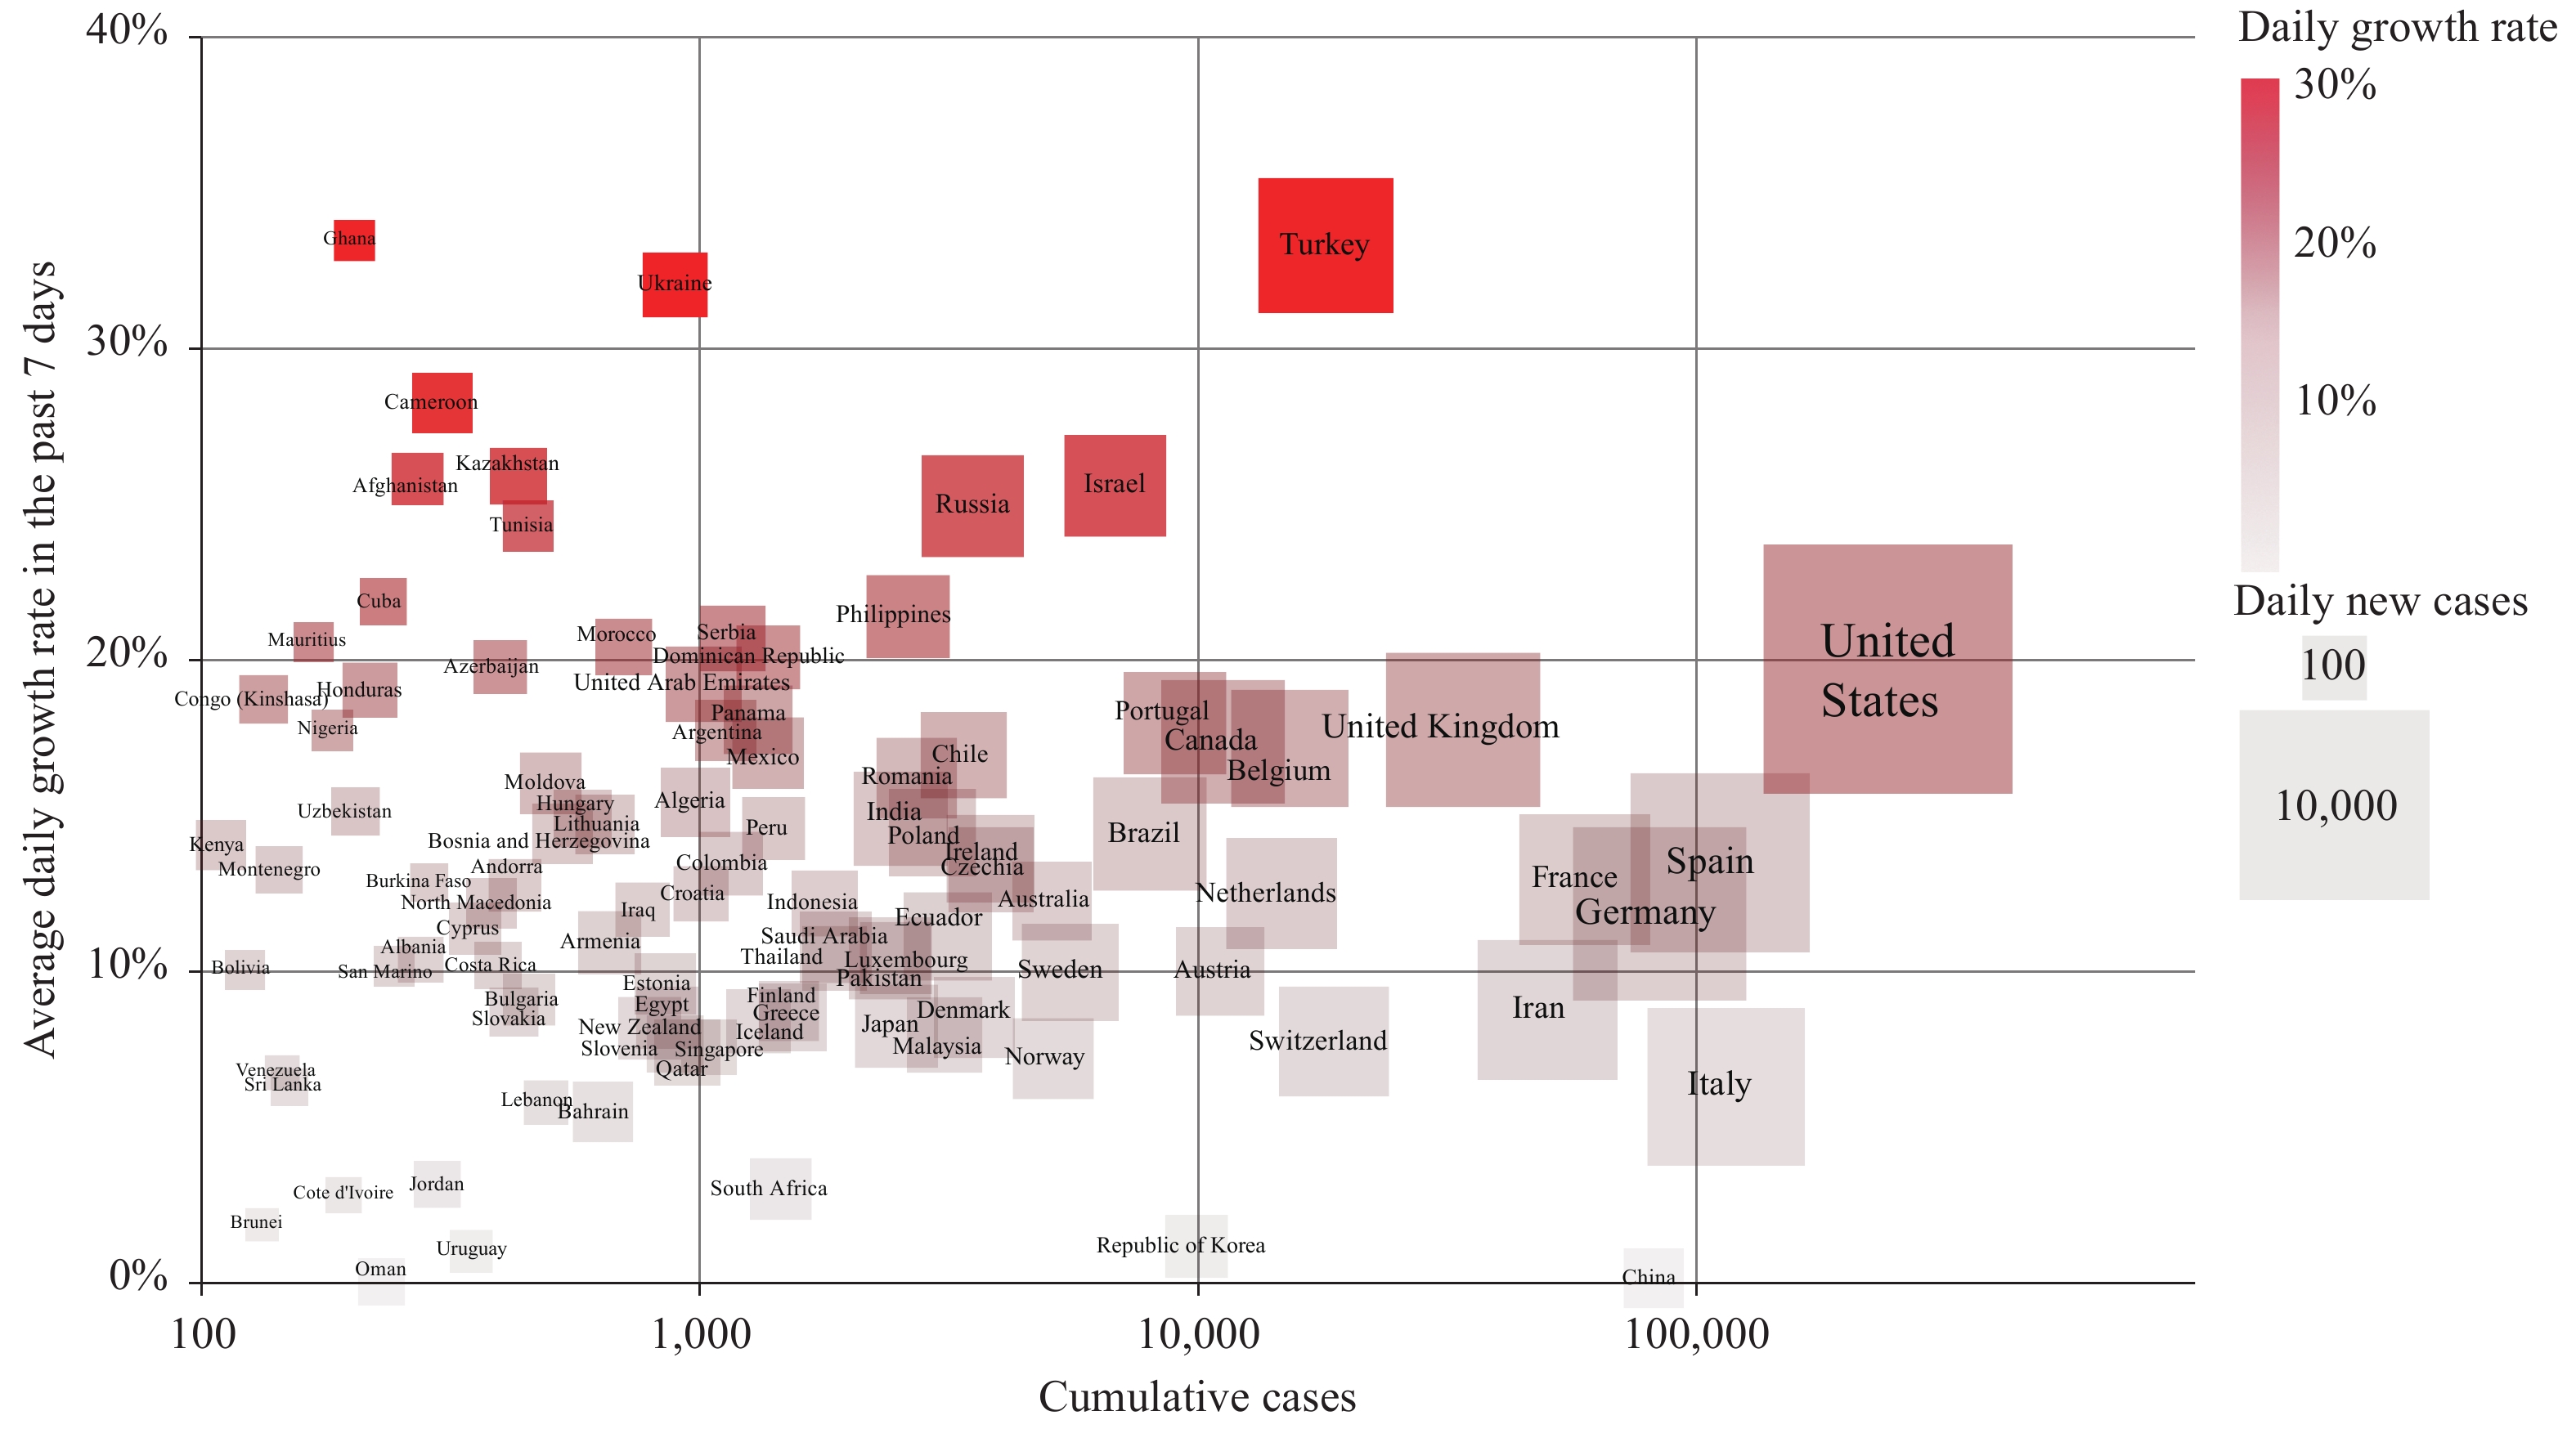
In order to compare the COVID-19 growth rate in the past week, we calculated the average daily rate of increase in cumulative cases for each affected country with more than 100 total confirmed cases by April 1. The daily rate of increase was calculated by (cumulative cases of today-cumulative cases of yesterday)/(cumulative cases of yesterday), and the 7-day average values of affected countries were shown on the Y-axis in Figure 2 corresponding to the numbers of cumulative cases on the X-axis. Turkey possessed the highest daily rate of increase of 33% with cumulative cases over 10,000. Other two countries, the daily rates of increase of Ghana and Ukraine were also higher than 30%, but the cumulative cases were still obviously less than 1,000, possibly due to their position in the early stages of rapid increases.
 Figure 2.
The average daily growth rate of the reported cumulative cases in the past 7 days for each affected country with more than 100 total confirmed cases by April 1. The color transparency represented the growth rate. The size of the square was proportional to the number of new cases on April 1.
Israel, Russia, the Philippines, and several other countries were located in the range between 20%–30% rate of increase. Besides Israel, the rest of the countries had relatively small numbers of confirmed cases. The USA had not only the largest number of cumulative cases but also a relatively high rate of increase of 20%, showing fast spread of COVID-19. Many European counties showed moderate rates of increase between 10%–20% but had large amounts of cumulative cases, such as the UK, Germany, France, Belgium, the Netherlands, Portugal, etc. Many other countries in Eastern Europe, South America, Southeast Asia, and South Asia were also in this region of 10%–20% rate of increase, including highly populous countries like India, Indonesia and Brazil. It is notable that the rates of increase of Italy and Iran, whose surges of COVID-19 cases emerged relatively earlier (at the beginning of March), were below 10% in the past 7 days, possibly indicating a stage of plateau. Many countries were located at the region of the graph below 10% increasing rate, among which China was at the lowest position with the Republic of Korea. Japan, Malaysia, as well as several European countries were also in this region of the graph. It is worth mentioning that the rate of increase of South Africa, having the largest number of confirmed cases in Africa, noticeably slowed down in the past 7 days.
-
Transmission rates in the global climatic zones. Using data collected from websites of WHO and governments, we continually calculated the effective reproduction numbers (Rt) in the context of climatic zones globally (excluding China) using SEIR mathematic modeling of infectious diseases. In general, the obtained Rt curves were gradually declining in the past two weeks (Figure 3A). The Rt values for each region on March 30 were 2.35 (subfrigid), 1.96 (temperate), 1.58 (tropical) and 1.30 (subtropical), respectively.
 Figure 3.
Rt trends and values. (A) Rt trend of COVID-19 by hemisphere (excluding China) by Mar 31, 2020. (B) Rt trend of COVID-19 in four climatic zones (excluding China) by Mar 31, 2020.
Transmission rates in the northern and southern hemispheres. The Rt values of COVID-19 globally and in the Northern and Southern Hemispheres (excluding China) were evaluated. Based on the issued data of the confirmed cases, the morbidity and the CFR in the Northern and Southern Hemispheres until March 31 were estimated as 14.38/100,000 and 5.08% and 1.99/100,000 and 2.27%, respectively. Rt curves showed a declining trend globally and in the Northern and Southern Hemispheres, and those of global and Northern Hemisphere almost overlapped (Figure 3B). The Rt values on March 30 were 1.74 (Northern Hemisphere), 1.72 (global), and 1.27 (Southern Hemisphere).
-
As described in our report last week (2), the numbers of reported confirmed cases in countries would be greatly influenced by their national testing criteria. The laboratory capacity and the supply of virus testing kits also determined the national scale of testing. Using data from Wikipedia by April 3 (3), the total testing numbers, the number of positive test results, and the tests per million population of the affected countries with over 1,000 tests were collected separately and calculated. In Figure 4, the positive rate was showed on the Y-axis and the testing number per million population was indicated in log scale on the X-axis with labeling by different continent by color and national population by size. From the perspective of continents, most countries in Europe (light blue), North America (green), and Oceania (pink) revealed relatively high testing coverage, followed by South America (yellow), while South Asia (purple) seemed to have low overall coverage. The testing data of the most African countries were either inaccessible or less than 1,000.
 Figure 4.
2019-nCoV laboratory testing coverage and positive rate by country up to April 3, 2020. Coverage was measured by the number of tests per million population. The size of the circle was proportional to population size, and the color represented the continent. M=million.
Regarding individual countries, Iceland had the highest testing coverage (57,459 per million), followed by the UAE and Bahrain (both over 21,500 per million), and Norway and Switzerland (both over 16,000 per million). On the contrary, the testing coverage of Bangladesh, Indonesia, India, and Nepal were markedly lower. Ecuador had the highest positive test result rate at 33% and a testing coverage rate of 562 per million. The positive test result rate of Iran was also high (27%) and a testing coverage rate of 962 per million. Indonesia had a high (25%) positive test result rate, but its testing coverage rate was low at 27 per million.
-
The number of the critical care (ICU and IMCU) beds in a country is one of the indices reflecting the national medical service capacity. Considering that critical care beds are not only for COVID-19 cases but also for patients with other diseases, we assumed that a shortage in critical medical service may occur, especially when the COVID-19 occupancy of critical care beds in a special region, e.g., a city or a country, exceeds 50% (4). The numbers of critical care beds in 67 countries were obtained from literature (31 in Europe, 24 in Asia, 11 in Africa and the USA) (5–7), as well as the numbers of serious and critical COVID-19 cases on April 1 in the corresponding countries (8). After calculating the ratio of the numbers of serious/critical cases to critical care beds in the individual countries, 9 countries currently had ratios over 50% (Figure 5). Spain (131%), Iran (102%), Andorra (100%), and the Netherlands (99%) seemed to be beyond or very close to complete occupation. France (74%) and Sweden (71%) were probably facing severe shortages of critical care resources. Belgium (62%), Italy (53%), and Portugal (51%) are close behind. It should be noted that circumstances in some severely affected areas inside a country were likely even worse, such as the Lombardy region in Italy. Quickly expanding the available number of critical care beds and qualified medical staff in those countries will help solve such problem.
 Figure 5.
Countries in shortage of critical care resources. The ratio of the number of COVID-19 active serious and critical cases (April 1) to the total number of critical care beds was labeled besides the bars.
We also compared the numbers of critical care beds per 100,000 people in 67 countries. The capacities of Africa and Asia were noticeably less complete, with an average value of 0.2 (maximum value 1.2) and 6.3 (maximum value 21.6), which were much lower than that of Europe (average 11.3, maximum 28.8 in Germany) and the USA (34.7). On the other hand, a shortage of qualified medical workers in most African and Asian countries is much more critical than the shortage of ICU beds and equipment such as ventilators.
-
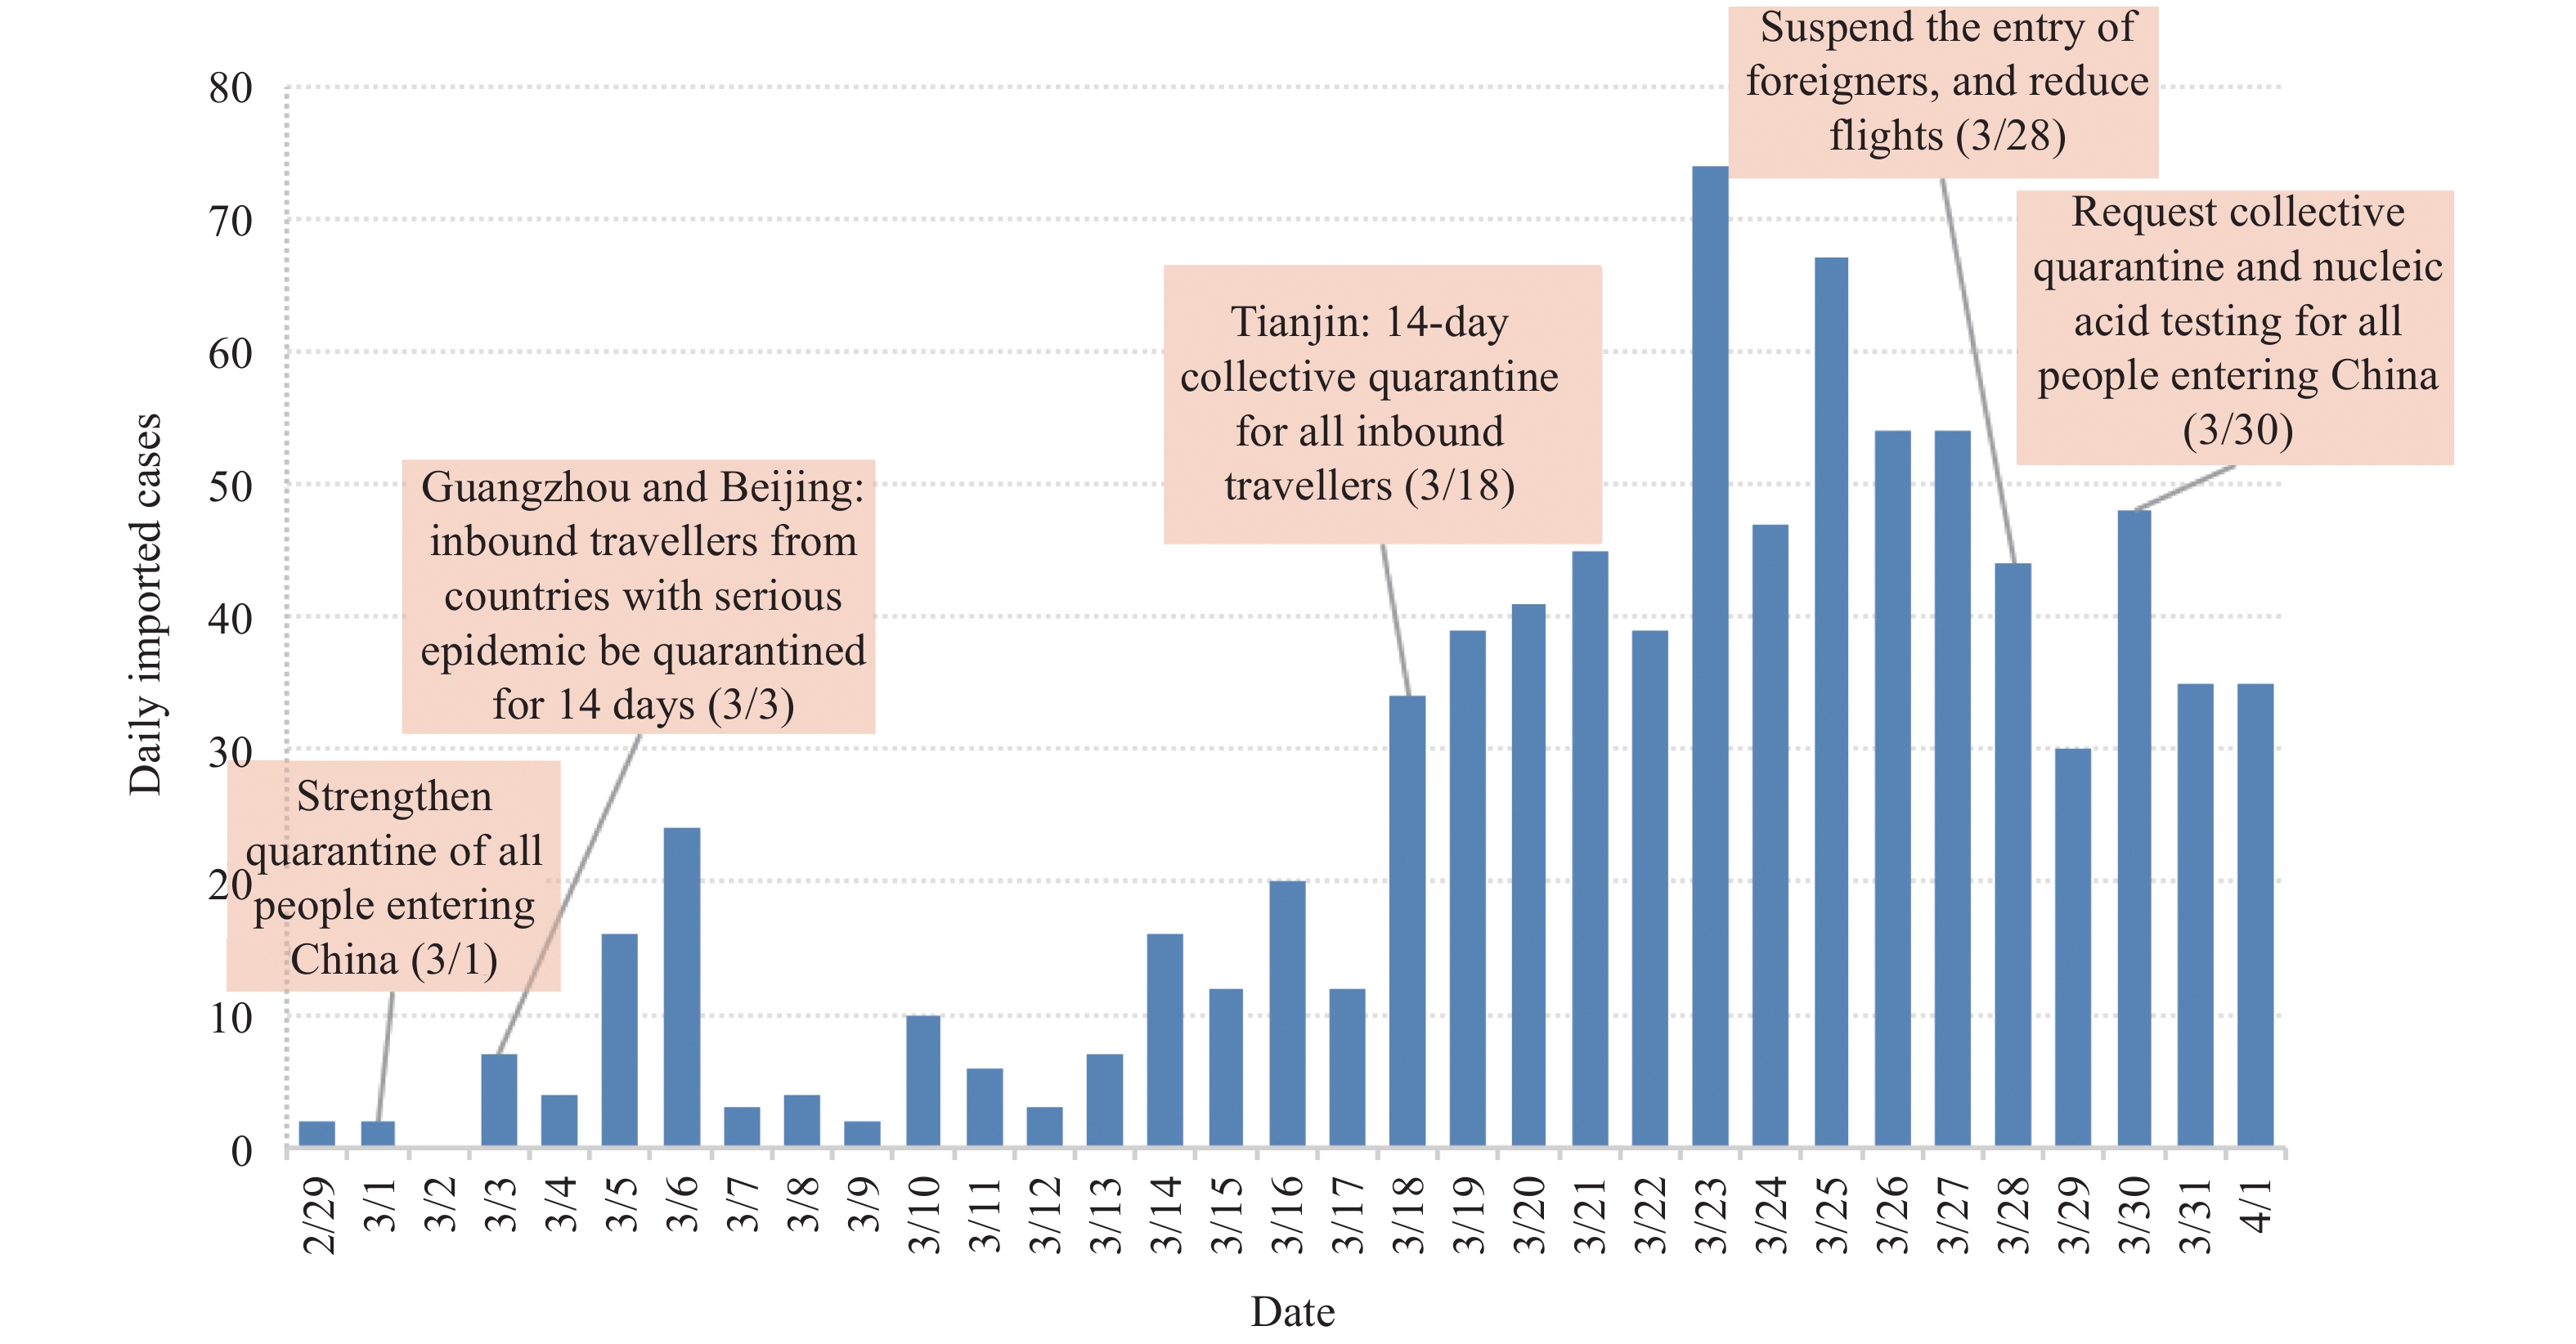
According to data issued by the National Health Commission, 300 confirmed COVID-19 cases were identified in the past 7 days in Mainland China as imported cases. March 26 and 27 were the days with the most imported cases last week with 54 new cases each day. The numbers of newly imported cases in the last 5 days of past week displayed a fluctuating but declining trend. Cumulatively until now, the top 5 source countries were the UK, USA, Spain, France, and Italy, and the top 5 destinations were Shanghai, Beijing, Guangdong, Fujian, and Gansu.
Since February 29, there have been continuously imported cases reported in Mainland China. A series of measures have been implemented, such as reducing the number of flights, quarantining at designed places for passengers from high-risk country for 14 days, and medical observation at home for the passengers from moderate- and low-risk countries for 14 days. At the end of March, stricter strategies and measures were implemented to further reduce the impact of imported cases from abroad, including suspending the entry of foreigners with valid visas, further reducing flight operations, testing all entry personnel, quarantine at designed place for all passengers from all foreign countries after entering for 14 days, etc. As illustrated in Figure 6, the peak day with largest increase in the imported cases was March 23. Afterwards, the daily number of imported cases declined, while in the same period the global (excluding China) daily number of confirmed cases dramatically increased. Such a scenario may somehow reflect significance on preventing imported cases and protecting further local transmission, although the exact impact of the comprehensive control measures is still under investigation.
-
In the past week (March 26 to April 1), the rapid increases of COVID-19 in most European countries and the USA did not show any slowdown, making Europe and the USA as the two major epicenters. The daily new confirmed cases in the USA were close to 20,000 in the first two days and over 20,000 in the last 5 days. The situations in Europe showed slight variation, in which the UK and Turkey seem to maintain continually increasing trend, while many countries with large populations, such as Spain, Italy, Germany, the Netherlands, Belgium, and Norway appeared to reach a plateau. Italy even began revealing declines. Such situations may persist in next week.
This week, the Rt curves and values of the four climatic zones and the two hemispheres seem to slightly decline when compared with those of the previous week, but they still remained higher than one. This indicates that the transmissibility of COVID-19 regarding large continents or regions worldwide is still high. Although the case numbers in Africa rose significantly and more countries were affected in last few weeks, large portions of African countries are still at the stage of importing case. It is notable that three countries with large populations in the tropical zone, i.e., Brazil, India, and Indonesia reveal rapid increases in the past week, despite the absolute case numbers in India and Indonesia remaining small. Much more attention should be paid to the changes in those three countries as these may provide useful information for containment of COIVD-19 in Africa.
In this report, we have analyzed data of national laboratory testing and critical care beds, which are two important factors for control of COVID-19 pandemic, together with other epi-statistics. The total testing numbers worldwide increased remarkably in the last week, particularly in the developed countries, which is beneficial for timely identification of infected cases and implementation of control measures. However, the laboratory testing capacities in many developing counties are still insufficient and requires joint efforts from different international communities. Although the shortage of critical care beds in some severely affected European countries seems to be critical, the strong economic and technical capacities and human medical resources in European countries may rapidly expand their medical service capacities in order to fulfill this gap. We have also noticed that the most critical shortage of critical care beds seems not to involve the developing countries yet in this study. We believe that this is largely due to the lack of updated information. Review of the publications has already proposed a weakness in critical care beds in most African and Asian countries. Such a gap is almost impossible to be improved in a short time due to economic constraints and lack of human resources. Therefore, enhancing implementation of non-pharmaceutical containment interventions is more important in developing countries.
Our data here indicates that air travel restrictions and other corresponding comprehensive control measures started to show positive effects in the decline of imported cases in the past few days. However, we have to notice, on the other hand, that the transmission of COVID-19 abroad rapidly increased last week and will probably remain increasing in the next few weeks. As virus circulation and possibility of infection increases, more and more overseas Chinese people, particularly those in European countries and the USA, might develop a strong desire to come back to China. Despite of the decreasing number of flights in next few weeks, the possibility of infected overseas passengers might still increase. Travel restrictions and related control measures still need to be held for a while.
Similar to our last report, the relevant data here was collected from the websites of governments, mainstream media, relevant professional websites, and published literature, which may affect the accuracy and real-time performance. The deviation of the prediction from the reality is probably inevitable.
Acknowledgements: The authors would like to thank Fu Gao, Zunyou Wu, Jiaqi Ma, Jingjing Xi, Jie Li, Xiang Ren, Qiulan Chen, and Wei Chen from China CDC and Yidu Cloud (Beijing) Technology Co. Ltd. for their contributions to the article.
HTML
Equivalent-Mortality Lines of 19 Severely Affected Countries
Rates of Increase of Confirmed Cases in Various Affected Countries in the Past 7 Days
Transmission Rate Prediction
Laboratory Testing for 2019-nCoV in Various Countries
The Ratio of Serious and Critical cases vs. Critical Care Beds
COIVD-19 Imported Cases into China
| Citation: |


 Download:


