-
Along with the announcement of COVID-19 as a global pandemic by the World Health Organization (WHO) on March 12, 2020, COVID-19 appeared to be spreading rapidly around the world. By 10:00 CET on March 25, 2020, a total of 331,619 confirmed cases and 15,146 deaths were reported from 195 foreign countries and regions on 6 continents plus the Diamond Princess international cruise ship, and among them, 124 countries and regions had local transmission. Cumulatively, the WHO website reported 15,918 confirmed COVID-19 cases from 16 countries and regions in the Western Pacific excluding China, 220,516 cases from 60 countries and regions in Europe, 2,344 cases from 10 countries and regions in South-East Asia, 29,631 cases from 21 countries and regions in the Eastern Mediterranean, 60,834 cases from 48 countries and regions in the Americas, and 1,664 cases from 39 countries and regions in Africa (1).
In this report, using data and information on the websites of governmental agencies, international organizations, professional platforms and mainstream media, the COVID-19 trend in the context of the world was predicted and the risk of case importation into China was analyzed with the help of mathematic modeling.
-
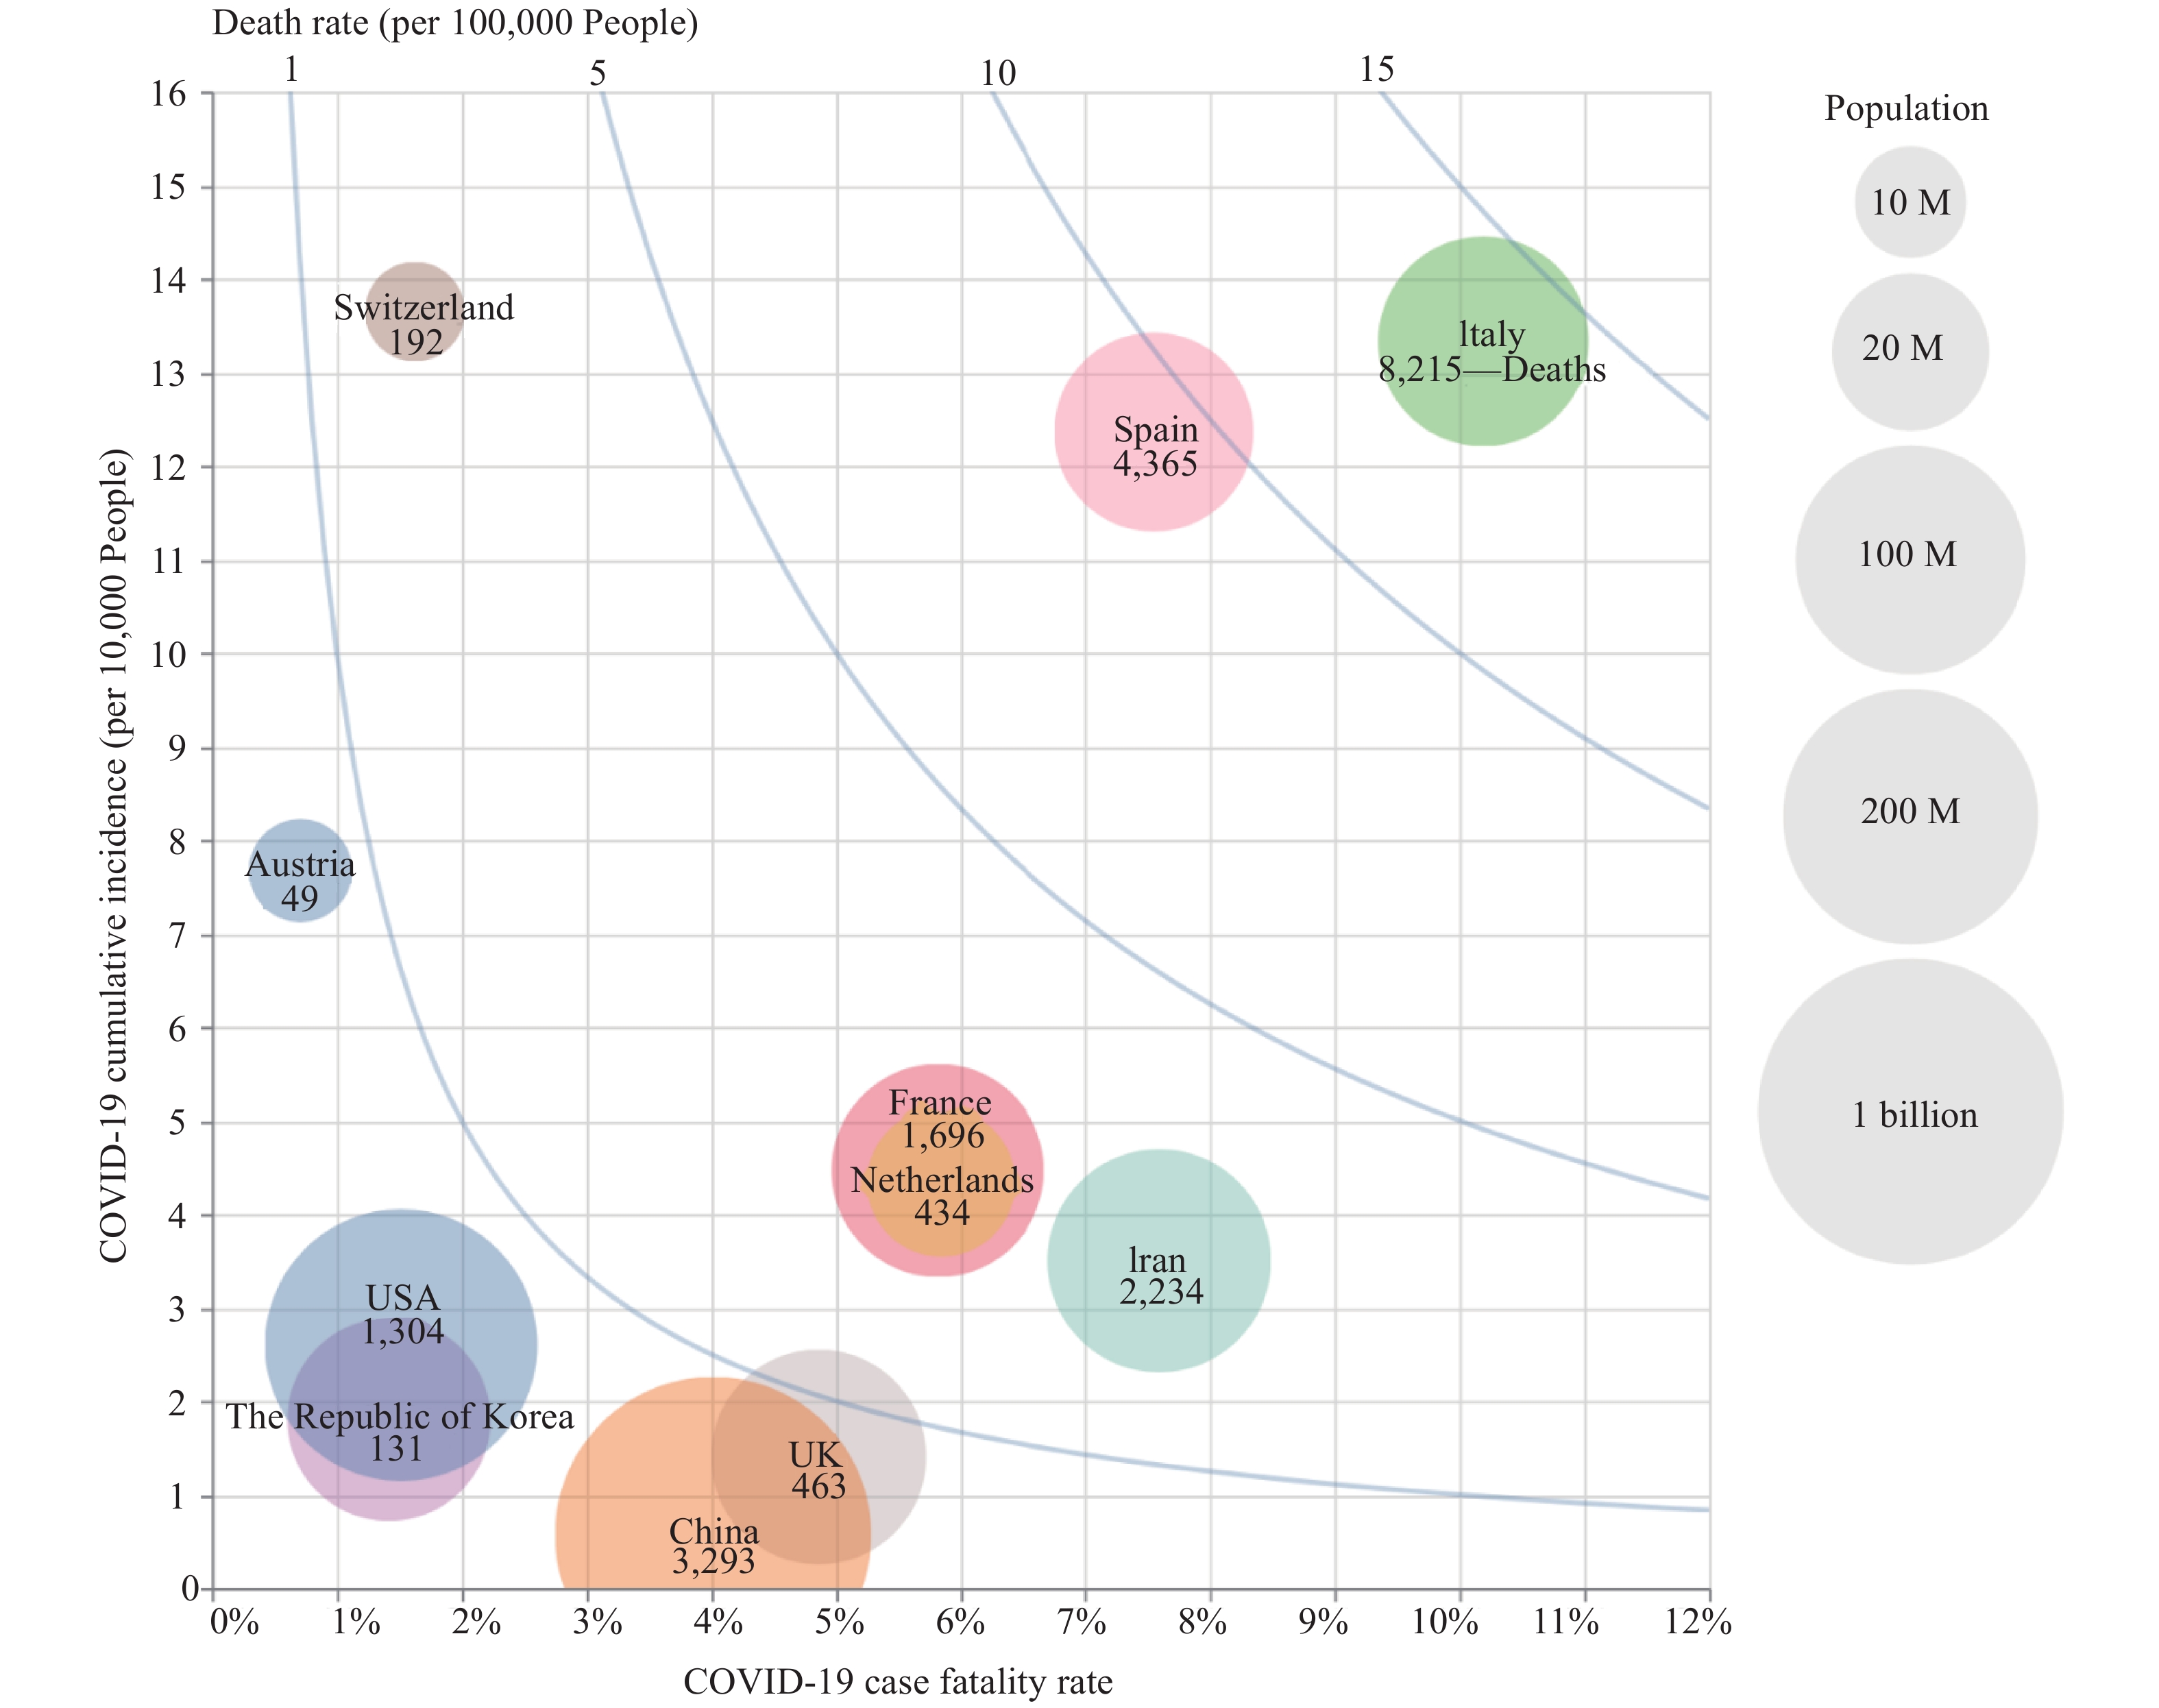
According to the total number of confirmed COVID-19 cases and deaths, the cumulative incidence and crude case fatality ratio (CFR) of the top 11 countries with the most cases including China were calculated, and the equivalent-mortality lines were plotted based on population size. As shown in Figure 1, Italy had the highest cumulative incidence rate and crude CFR and was located in Zone 4 (10–15 deaths/100,000), and Spain was located in Zone 3 (5–10 deaths/100,000). Iran, France, and the Netherlands were located in Zone 2 (1–5 deaths/100,000) due to high CFR, while Switzerland located at the same zone due to high incidence. China and USA were located in Zone 1 (0–1 deaths/100,000) as a result of large populations and low crude CFRs, and the UK, the Republic of Korea, and Austria were also at this zone.
 Figure 1.
Comparison of the crude case fatality ratio (CFR), cumulative incidence (CI), and mortality of COVID-19 among the top 11 countries according to the real-time reported cases and deaths up to March 25, 2020. The crude CFR is displayed on the X-axis and the CI (1/10,000) on the Y-axis. The population mortality (1/100,000) is shown by the blue lines. The size of solid circle represents the population size of each country with legends on the right. The number of deaths in each country is labeled inside the circle. M=million.
-
Transmission rates in severely affected countries over the next week. Based on the numbers of case issued on the official websites of WHO and/or individual governments on March 24, 2020, the countries with cumulative case numbers exceeding 5,000 were selected, and their effective reproduction numbers (Rt) were calculated using SEIR mathematic modeling of infectious diseases. Germany, France, the Netherlands, the USA, Switzerland, Spain, Italy, the UK, the Republic of Korea, and Iran were included. The Rt values of all 10 selected countries were predicted to be between 0.8 and 5.0 over the next week. Among them, the Rt value of the USA is projected be the highest (4.63), followed by the UK (3.08), Spain (2.78) and Netherlands (2.54) (Figure 2A). Combined with the large numbers of existing cases in those countries, more new cases will be expected over the next week, particularly in the USA.
 Figure 2.
Calculation of the Rt trends and values of different countries and climatic zones. (A) The Rt trends and values of 10 countries with more than 5,000 total confirmed cases up to March 25, 2020. (B) The Rt trends and values of 4 climatic zones globally up to March 23, 2020.
Transmission rates in the global climatic zones. Based on latitude and type of climate, the world can be roughly divided into five zones that are tropical, subtropical, temperate, subfrigid, and frigid. Until now, there were no COVID-19 cases reported in the frigid zone. According to geographical location, the numbers of COVID-19 cases worldwide, excluding China, were correlated with the climatic zones by country. If the country spans more than one climatic zone, the climatic zone occupying the most area was selected. The reported cumulative incidence and crude fatality rate of each zone were calculated and showed that subtropical zone had higher rates than other climatic zones recently. Furthermore, the Rt values of those four climatic zones from January 7 to March 23 were calculated by SEIR mathematic modeling. As shown in Figure 2B, the Rt value of tropical zone was the highest (2.96), followed by temperate (2.68), subfrigid (1.84), and subtropical (2.14) zones. Due to the relatively fewer numbers of COVID-19 cases and lower morbidity currently in the tropical zone, the exact impact of climate on the spreading of disease still remains unclear and deserves further observation.
-
Comparison of the recommendations and criteria for performing viral laboratory testing. To understand the laboratory testing performance for 2019-nCoV, the national recommendations and criteria for performing viral testing in four countries, including the USA, the UK, Italy, and the Republic of Korea, were reviewed and summarized in Table 1. Currently, the criteria for COVID-19 testing in Italy seemed to be the most accessible, followed by the Republic of Korea and the USA. The UK appeared to have relatively strict standards mainly focusing on patients with relatively severe respiratory symptoms.
Country Key points of COVID-19 testing criteria USA 1. Hospitalized patients or healthcare facility workers with symptoms;
2. Patients with mild symptoms in communities experiencing high numbers of COVID-19 hospitalization;
3. Patients 65 years of age and older with symptoms or patients with underlying conditions with symptoms;
4. Patients with severe clinical symptoms who require hospitalization.UK 1. A person who has either clinical or radiological evidence of pneumonia;
2. Who has acute respiratory distress syndrome;
3. Who has influenza-like illness of acute onsetItaly 1. Close contact with confirmed patients;
2. Or has travel history to high-risk epidemic areas or visits to hospitals or other high-risk areas;
3. Or is developing clinical symptoms.The Republic of Korea 1. Suspected Case: A person who develops clinical symptoms within 14 days of coming into contact with a confirmed patient while the patient was showing symptoms;
2. A person who is suspected of having the COVID-19 virus as per doctor’s diagnosis due to pneumonia of unknown causes;
3. A person who develops clinical symptoms within 14 days of travelling to a country with local transmission of COVID-19;
4. A person with an epidemiologic link to the local COVID-19 outbreak and develops clinical symptoms within 14 days.Table 1. COVID-19 testing criteria in four severely affected countries.
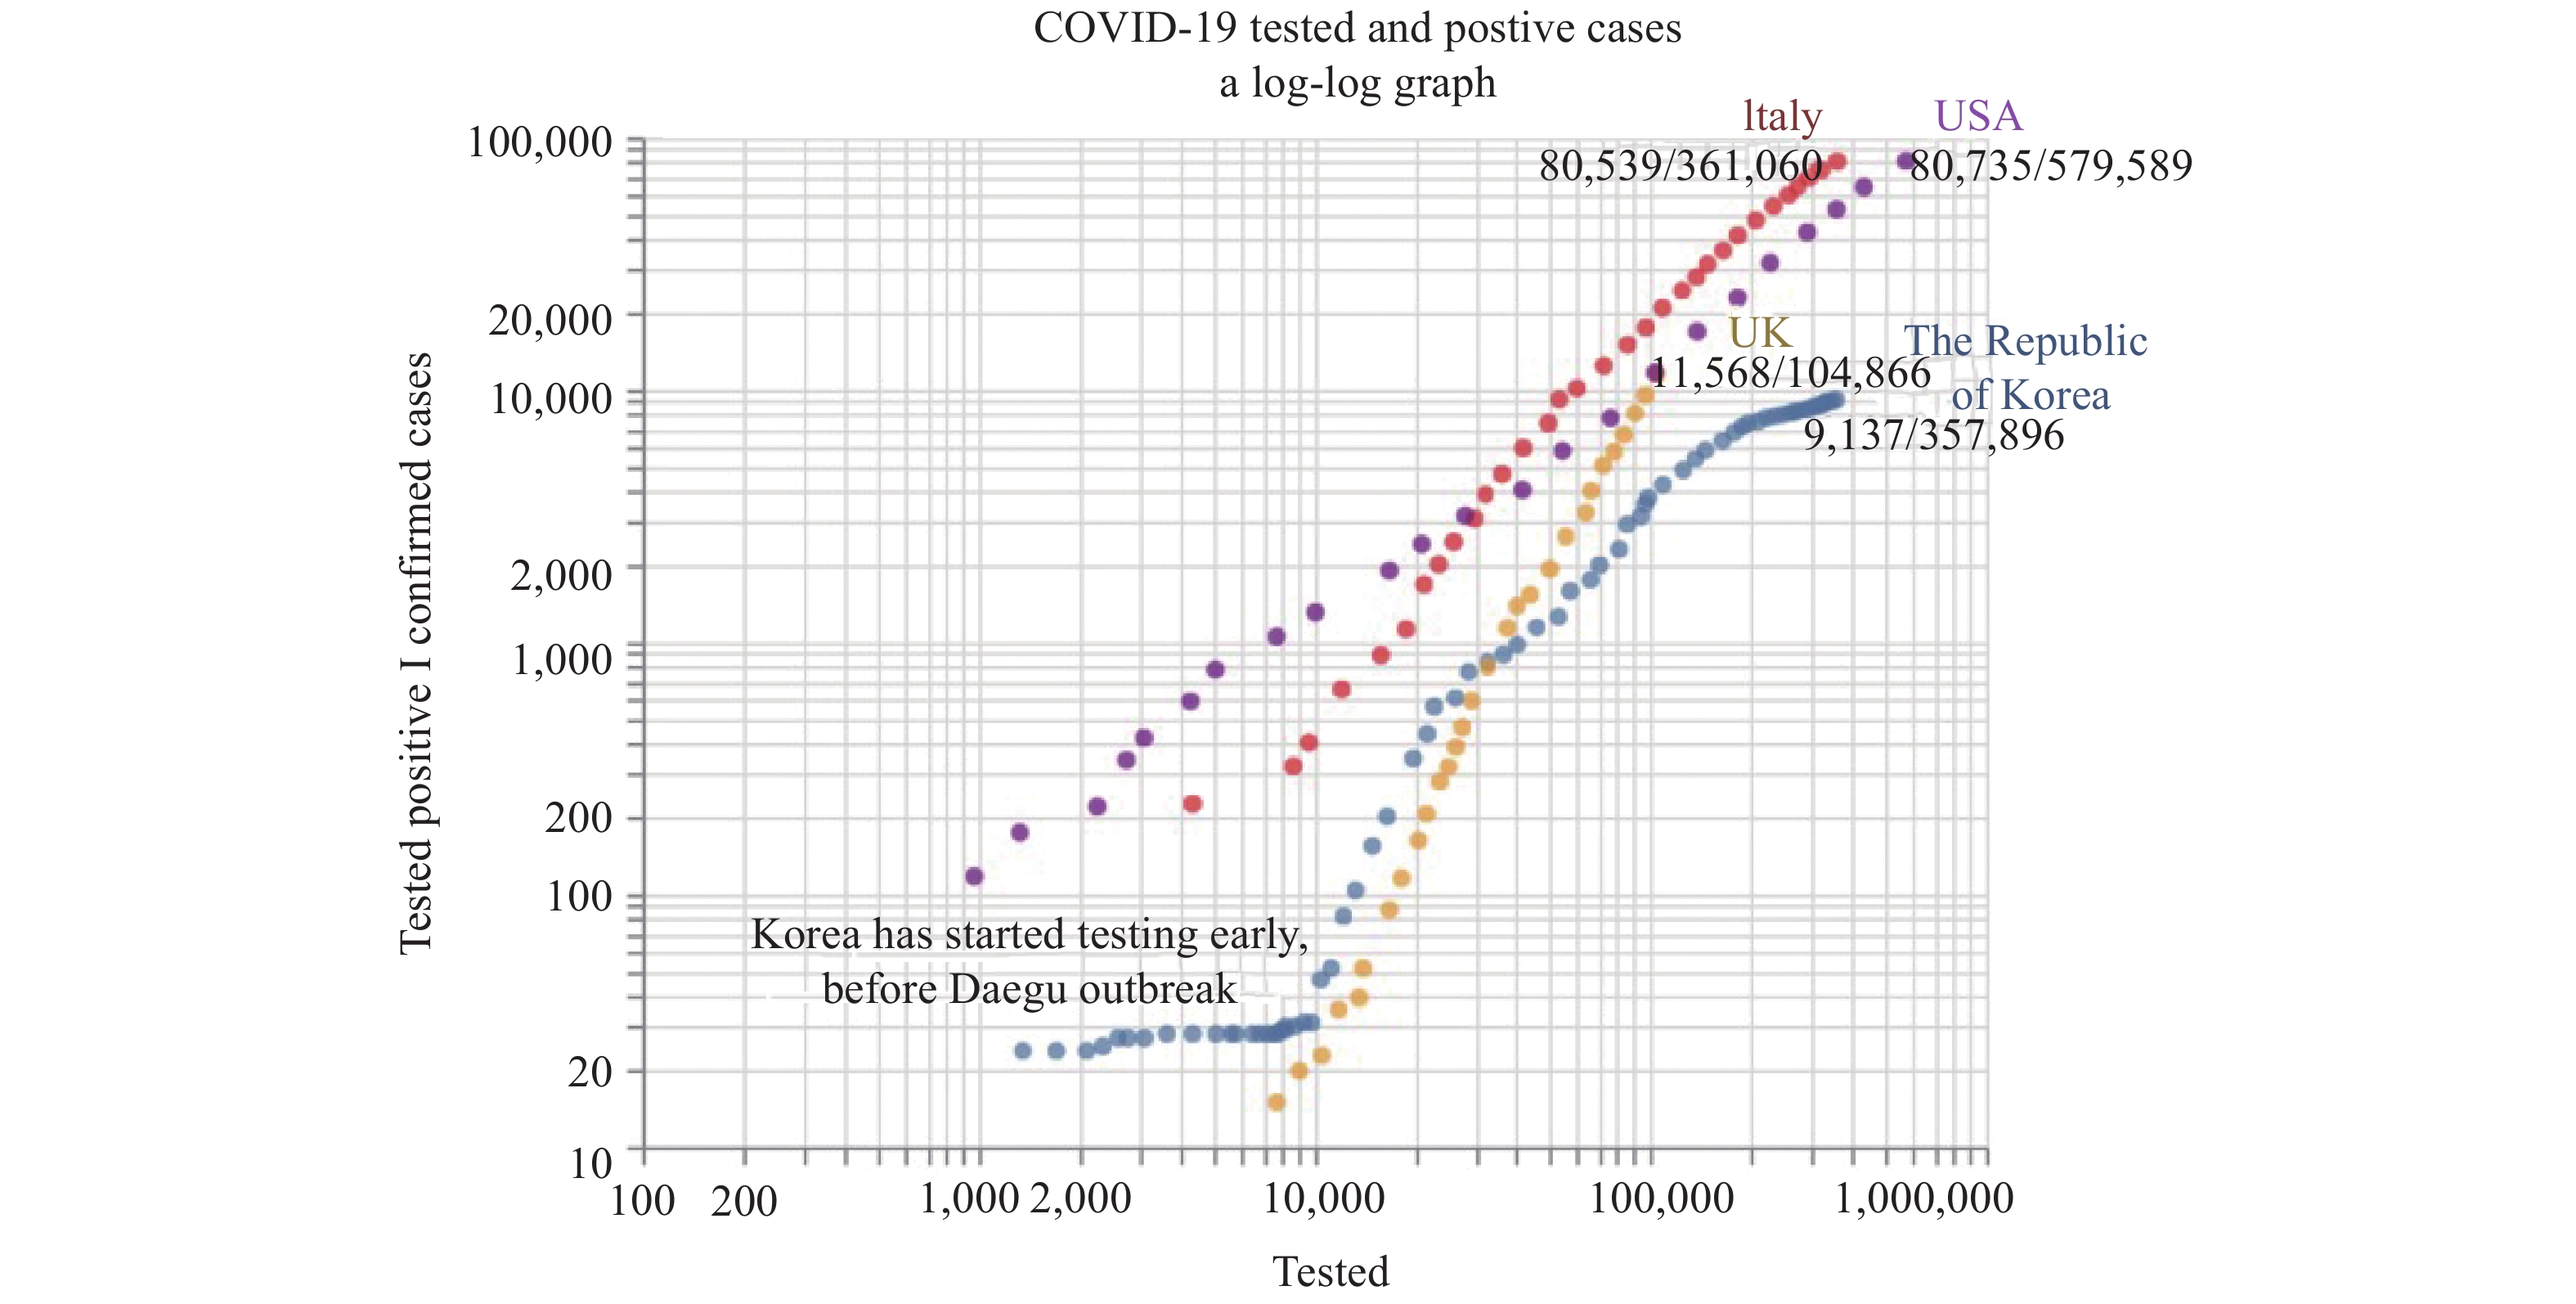
Comparison of the numbers of the confirmed cases and the tested people. The cumulative numbers of confirmed cases and tested people at different times in those four countries were collected from relevant websites until March 24, 2020. The cumulative number of confirmed cases at each point in time for each country was illustrated according to the cumulative number of the tested people in a double logarithmic (log-log) chart, generating curves for those four countries (Figure 3). The curve of Korea was quite flat at early stages before the outbreak of a cluster at a church in Daegu. Despite the cumulative case numbers remaining less than 30 for dozens of days, the amount tested expanded from roughly 1,500 to more than 10,000 individuals. The curve became more steep in the following 9 points in time after the outbreak in Daegu, which coincided well with the number of cases rapidly increasing from roughly 30 to 600 (roughly a 20-fold increase) but the number of people tested expanding only from 10,000 to about 22,000 (2.2-fold increase). The steep curve turned to be slightly flat in the following 15 points in time, in which the case numbers increased to approximately 4,000 (6.7-fold increase) along with the increase of testing numbers to 100,000 (4.5-fold increase). The curve was obviously flat in the latest dozen points in time and the cumulative positive rate was 2.55% (9,137/357,896).
 Figure 3.
Comparison of the increase of the confirmed cases and the tested population in Republic of Korea, Italy, the USA, and the UK. The cumulative number of confirmed case in log scale are indicated on the Y-axis and the cumulative number of population tested in log scale are showed on the X-axis. The latest number of total confirmed cases and population tested are labeled at the end of each curve.
On the contrary, the curves of Italy, the UK, and the USA maintained steep increases since the beginning, especially the UK (Figure 3). The population testing in these three countries expanded with the spread of the epidemic, but the curves still showed steeply rising trends. According to the latest issued data, the cumulative rates of the identified positive cases among the population tested in the Republic of Korea, Italy, the USA, and the UK were 2.55%, 22.3%, 13.9%, and 11.0%, respectively, highlighting a much higher testing ratio among the Korean population. Furthermore, we calculated the levels of increase in confirmed cases starting from 200 to the latest ones and the levels of increase of the number tested from the point in time of reaching 200 confirmed cases to the newest count. The levels of increase of confirmed cases and that of the population tested in Korea, Italy, the USA, and the UK were approximately 45- and 27-fold, 366- and 16-fold, 367- and 263-fold, 53- and 9-fold, respectively. The capacity to expand virus testing in Italy and the UK lag behind the increases in confirmed cases.
-
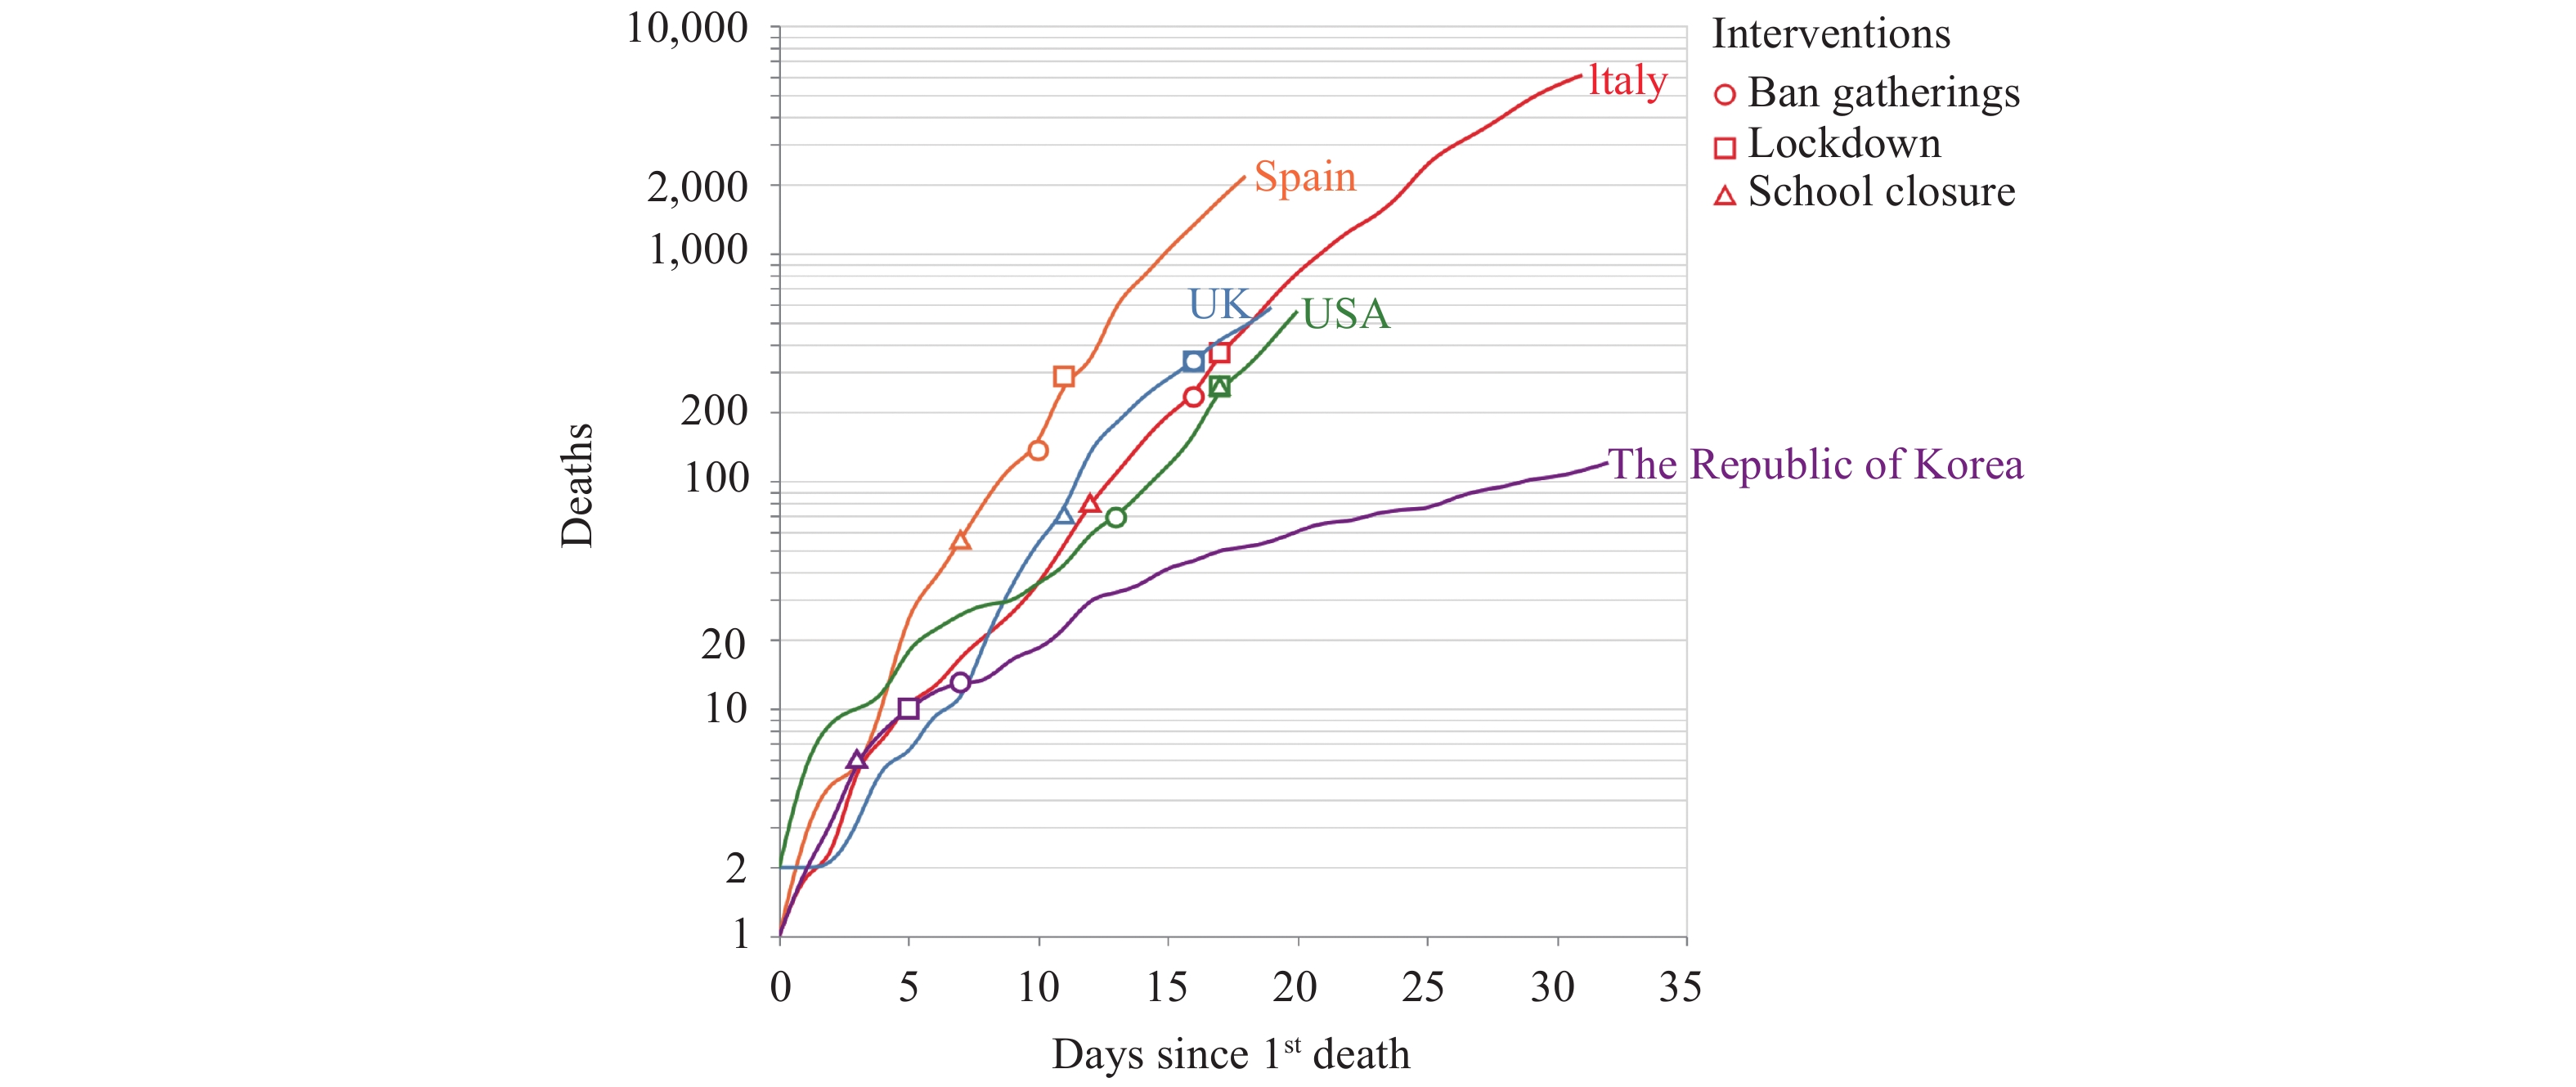
Although the strategies and methods of implementation varied among the countries, three major measures were conducted including school closures, city lockdowns, and gathering bans (Table 2). The cumulative deaths of the USA, the UK, Italy, Spain, and the Republic of Korea were correlated with the time (days) from the date of the first fatal case emerging and the implementation time of the three measures were indicated. As shown in Figure 4, the Republic of Korea conducted the interventions at a relatively early stage (within 7 days after the 1st fatal case reported) with about 10 cumulative deaths, which seemed to be associated with the relatively slow increasing curve. On the contrary, the other four countries implemented those measure relatively slowly, particularly the city lockdown that was conducted on the 10th (Spain) to 15th (USA, UK, and Italy) day after the 1st fatal cases reported with 250 to 350 cumulative deaths. The exact association of the time of the measure implementation with the increase of death needs further evaluation.
Country School closure Ban gatherings Lockdown USA March 20th, schools announced to be closed nationwide. March 16th, numerous theater chains temporarily closed across the country, and most professional sports leagues announced the suspension of their events. March 20th, the New York States, where has the worst pandemic situation, announced “lockdown”. Italy March 4th, the government announced to close all the schools across the country. March 8th, gatherings were banned across the country. March 9th, the government announced to extend the “lockdown” area across the country. UK March 18th, most schools across the country announced to be closed March 23rd, Gatherings are banned across the country March 23rd, the government announced “lockdown”, people were restricted from going out randomly. The Republic
of KoreaFebruary 23rd, suspension for classes were implemented. February 25th, Daegu and Gyeongbuk, where have the serious outbreak situation, lockdown. February 27th, a wide range of gatherings were banned. Spain March 12th, schools across all the autonomous communities closed. March 15th, gatherings were banned nationwide. March 16th, the government announced “lockdown” nationwide. Table 2. Interventions in five severely affected countries.
 Figure 4.
The increasing trends of deaths after the first fatal case reported in the Republic of Korea, Italy, Spain, the USA, and the UK. The implementation time of three major control measures are indicated on the curves. The cumulative numbers of deaths are shown in log scale on the Y-Axis and the time (days) after the first fatal case reported are shown on the X-axis.
-
According to civil flight information, the average daily number of entry flights from abroad to Mainland China was 165 in the week of March 19 to 25. Among these, flights from Asian countries accounted for 73%, Europe 9%, North America 7%, Oceania 4%, and Africa 2%.
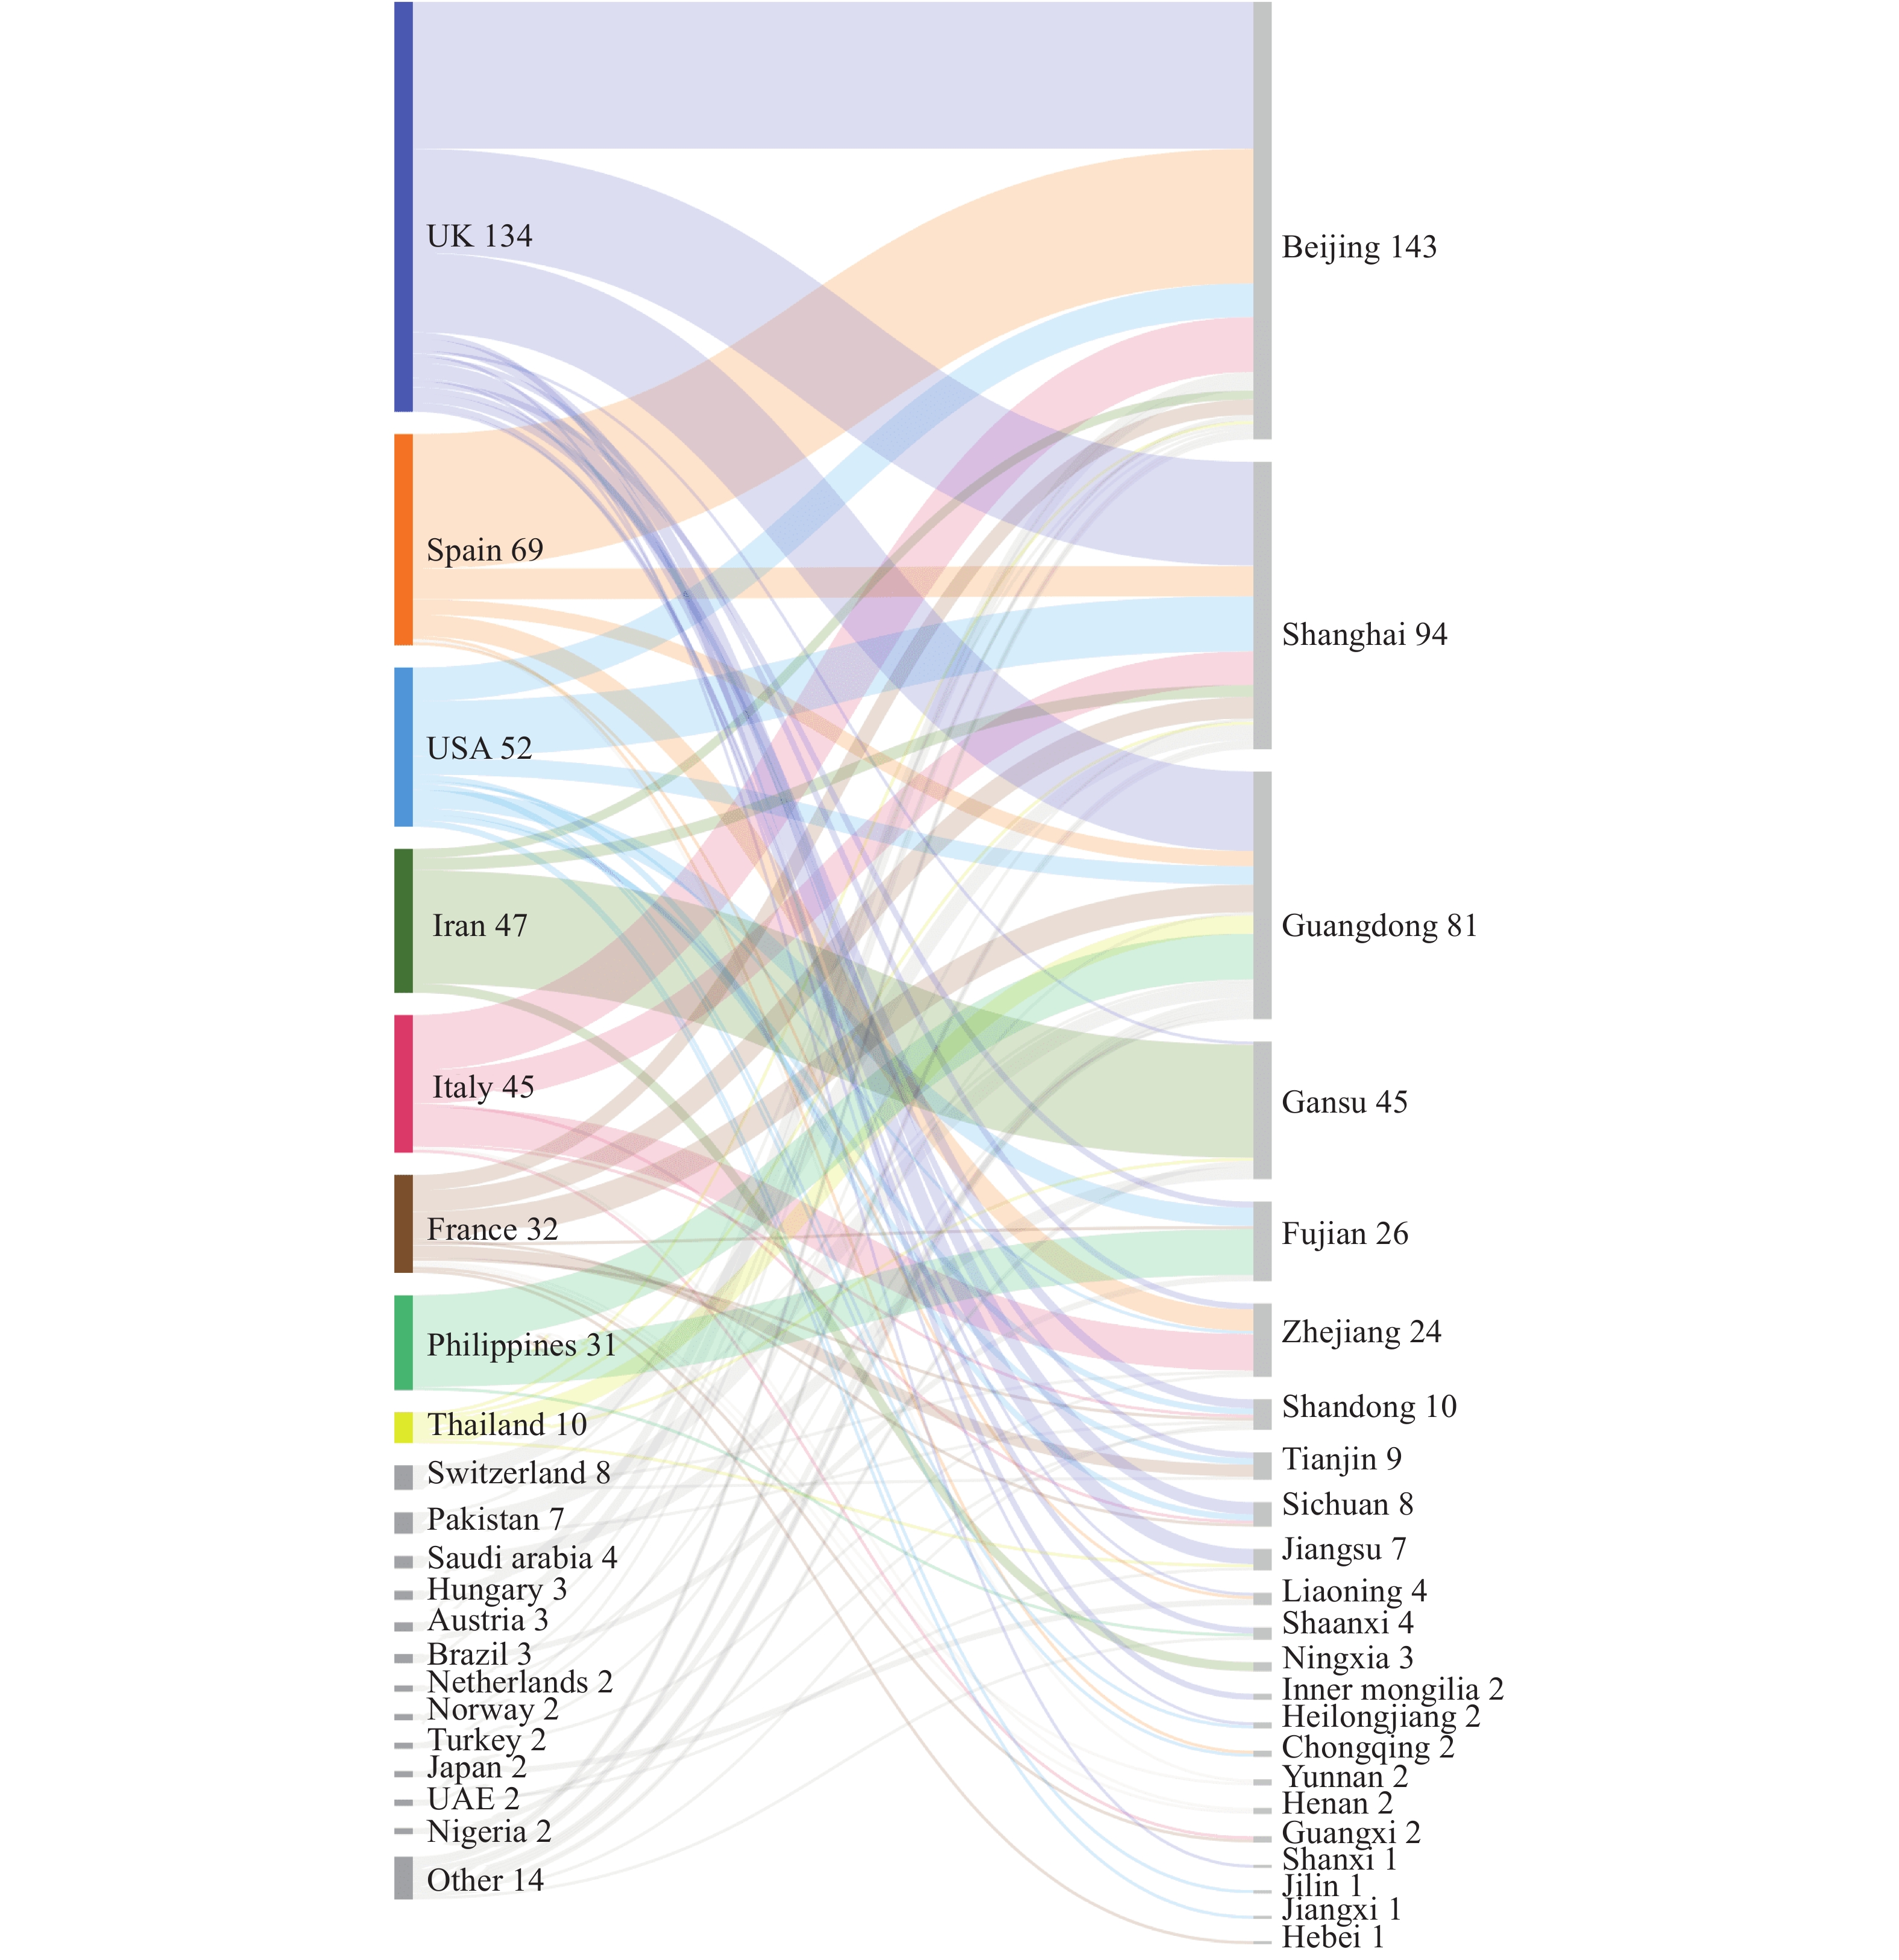
Up to March 24, 2020, imported COVID-19 confirmed cases came from 34 different countries and were distributed in 16 provincial-level administrative divisions (PLADs) (Figure 5). The top eight countries were the UK, Spain, the USA, Iran, Italy, the Philippines, France, and Pakistan, accounting for 76.7% imported cases. The main terminal locations of imported cases were Beijing, Guangdong, Shanghai, Gansu, Fujian, and Zhejiang. Imported cases from the UK mainly arrived in Beijing, Guangdong, and Shanghai. Most cases from Spain arrived in Beijing and relatively small portions went to Shanghai and Zhejiang. Cases from the USA had markedly more destinations, but Beijing and Shanghai still had a higher proportion.
 Figure 5.
The sources and destinations of the imported confirmed cases in China up to March 24, 2020. The sources (countries) are illustrated on the left sorted by the imported case numbers. The destinations (provincial-level administrative divisions) are illustrated on the right and sorted by case numbers. The width of curve represents the proportion of the cases.
-
From March 19 to 25, Europe was still the epicenter of the COVID-19 pandemic. The rapid increase of confirmed cases in the USA has made it the second epicenter. More importantly, the increasing trends of new cases in European countries and the USA do not show any sign of slowing. The number of newly diagnosed cases per day in the USA exceeded 10,000 in the past two days. Large quantities of COVID-19 cases in those epicenters will definitely produce great impact on the disease spreading not only for China but also for the rest of the world.
Our data here illustrate that the current Rt values of COVID-19 in all four climatic zones are still higher than or close to 2.0 despite declines compared with that of previous weeks, highlighting that the transmissibility of COVID-19 worldwide is still very strong. The Rt value in the temperate zone has fluctuated between 2.0 to 4.0 since January 20, indicating a fairly stable transmissibility in this region that includes most of the severely affected countries such as China, Western European countries and the USA. It should be pointed out that although the current Rt value in the tropical zone is high, it may not exactly reflect the real situation as case numbers of the most countries are still very limited, especially in a majority of African countries that contain a small number of imported cases. The influence of weather on the transmission of COVID-19 needs long-term observation.
Prompt and strict containment measures implemented in other PLADs of China besides Hubei Province have successfully interrupted disease transmission and ensured a lower morbidity and mortality. Our analysis here has also revealed that earlier implementation of control measures seems to help reduce the fatality rate, as evidenced in the Republic of Korea. Virus testing does not directly influence disease transmission. However, large-scale virus testing definitely benefits early detection and reporting, which subsequently increases early isolation and treatment and can lead to the eventual control and even elimination of the disease.
Our assessment here indicates that the COVID-19 pandemic is still rising and rapidly spreading worldwide, and such rising trends will probably persist in the next few weeks. Therefore, the impact of having more imported cases in China is still huge. Tailored control measures at varied risk levels and persistent and timely assessments of the COVID-19 pandemic trends and for the risk of imported cases to China are necessary.
The data collected and presented in this report are mainly extracted from public information on the websites of governments, mainstream media, relevant professional websites, and official published research literature. The accuracy and real-time performance are limited not only by the data providers but also our search capacity. Because the number of cases by climatic zone is counted by country, partial misclassification still exists. The results of mathematic modeling are affected by unknown numbers of the actual infected population in a special region, the authenticity of reported data, the governmental efforts for control measure implementation, etc. Thus, deviations of the prediction from reality are likely inevitable.
Acknowledgements: The authors would like to thank Zunyou Wu, Jiaqi Ma, Jingjing Xi, Dapeng Yin, Luzhao Feng, and Lei Zhou from China CDC for their contributions to the article.
HTML
Equivalent-Mortality Lines of Countries Most Severely Affected
Transmission Rate Prediction
Laboratory Testing for 2019-nCoV in Four Severely Affected Countries
Control Measures for COVID-19 in Five Severely Affected Countries
Sources and Destinations of Imported Cases
| Citation: |


 Download:


