

 Download:


-
Background The prevalence of schistosomiasis in China is at the lowest level in history, and sentinel surveillance sites of schistosomiasis have fully covered all epidemic areas of China. This article has analyzed the surveillance data for the last four years and can help guide the next stage of surveillance work at the national level, including the scope of surveillance, surveillance content, and surveillance methods, etc.
Methods Data from the National Schistosomiasis Surveillance System were collected. The infection rate of schistosomiasis among the human population, livestock, snails, and the change of the breeding area of snails in sentinel surveillance sites for four consecutive years were analyzed, and the trends in schistosomiasis prevalence in surveillance sites were determined.
Results The prevalence of schistosomiasis in all sentinel surveillance sites of China showed downward trends from 2015 to 2018 with infection rates decreasing in this time period for local human population (0.05% to 0.00%), the floating population (0.020% to 0.003%), and cattle (0.037% to 0.000%). No infected snails were found during the period. From 2015 to 2018, the total area of newly found habitats of snails (Oncomelania hupensis, O. hupensis) were 34,730 m2, 1,367,694 m2, 18,944 m2, and 50,420 m2, and the total area of re-emergent habitats of snails (O. hupensis) were 822,194 m2, 1,391,779 m2, 1,516,292 m2, and 1,750,558 m2, respectively.
Conclusions and Implications for Public Health Practice The prevalence of schistosomiasis in human and livestock is going down and is sustained at a very low level, but new and re-emerging habitats of O. hupensis are new challenges regardless of the achievement of schistosomiasis control. Therefore, two actions are necessary to effectively further reduce the transmission risk of schistosomiasis: 1) taking effective measures to control the source of infection of schistosomiasis; and 2) reducing the breeding areas of
O. hupensis. -
Schistosomiasis is one of the most serious parasitic diseases in China, which has a history of more than 2,100 years. In the mid-1950s, when China’s population was about 600 million, an estimated 11.6 million people were infected with Schistosoma japonicum (S. japonicum). Control strategies were developed and adapted over time to align with epidemiological insights, technological advances, and the political environment, and this progress can be divided into three stages. The first was a mass campaign focused on snail control, which was based on understanding the epidemiology, the second was a morbidity control stage boosted by international cooperation, and the third stage was implementing strategies to block schistosomiasis transmission (1-2).
In 2000, the number of infected people was estimated to have been reduced to 694,778, Oncomelania hupensis (O. hupensis) breeding areas have been reduced by more than 75.0%, and 5 of the 12 previously prevalent provinces have eliminated the disease (1). Between the mid-1980s and 2003, the criteria of transmission interruption have been reached in 260 counties (60.0%) and transmission control has been achieved in 63 counties (14.5%), but the disease was still epidemic in the remaining 110 counties (25.4%) (1). Since 2005, China has implemented a comprehensive strategy of schistosomiasis control focusing on source control, which preliminary studies have indicated as effective in reducing the prevalence of schistosomiasis in both humans and bovines (3). Passive chemotherapy and health education still have had a significant impact on schistosomiasis control during the maintenance and consolidation phase (4).
By the end of 2014, the Chinese government has successfully interrupted the transmission of schistosomiasis in 313 of 457 epidemic counties and controlled the transmission of schistosomiasis in 135 counties; only 5 counties remain uncontrolled (2). According to China’s Medium-and Long-term Plan for Schistosomiasis Prevention and Control (2004−2015), China will accomplish the goal of schistosomiasis transmission control in 2015 with an infection rate of human and animal schistosomiasis of less than 1%, and schistosomiasis control’s classification will be transitioned from epidemic control to transmission control accordingly (5). China CDC set up 457 national surveillance sites for schistosomiasis in 2014 to meet the needs of epidemic prevention, control, and surveillance, and have covered the whole schistosomiasis epidemic area (6).
The national surveillance system of schistosomiasis has become important to the prompt control and even elimination of the incidence and transmission of schistosomiasis in China (7). The epidemic situational analysis of schistosomiasis surveillance sites is essential to understanding the epidemic situational changes in surveillance sites and guiding the optimization and implementation of the surveillance program’s next stage. These developments can make the monitoring system more comprehensive by providing an important basis for scientific surveillance of schistosomiasis and enhance a data-driven approach for the elimination of schistosomiasis of China in the future.
-
Schistosomiasis surveillance sites cover all epidemic counties including 142 transmission control counties, 311 transmission blocking counties (150 counties with snails, 161 counties without snails), and 4 Three Gorges Reservoir area counties (only with snail surveillance, including 2 non epidemic counties). The main work of the surveillance sites is to monitor the local and floating human populations, the livestock, and the snails by testing human blood, human feces, livestock feces, and Oncomelania infections in the epidemic area. The indirect hemagglutination assay (IHA) method is used to detect anti-Schistosoma antibody of blood samples from the local population and floating population. The nylon silk bag incubation method (one sample of fecal matter for three tests) and the Kato-Katz method (one sample of fecal matter for three tests) are used to detect the pathogens of feces of serum positive populations. For the surveillance of domestic animals, the plastic cup top tube incubation method (one sample of fecal matter for three tests) was used to detect infections of Schistosoma in domestic animals with. For the surveillance of O. hupensis, systematic sampling combined with environmental sampling were used to investigate the existing and suspected environments of O. hupensis, and the O. hupensis samples used will be registered as living or dead. Infections of living samples were detected by anatomical microscopy, and if infections were found, the nucleic acids of Schistosoma in the snails would be detected by loop-mediated isothermal amplification (LAMP).
Data from schistosomiasis surveillance sites from 2015 to 2018 were obtained from the National Schistosomiasis Surveillance System, which includes basic information from schistosomiasis surveillance sites and surveillance data of the local and floating populations, livestock, snails, and wild feces and other floating materials in the Three Gorges Reservoir Area. Factors surrounding S. japonicum infection were analyzed for the local and floating human population, livestock, and O. hupensis, and habitat changes of O. hupensis were also monitored. Trends of the epidemic were then observed and used to predict future changes of the schistosomiasis epidemic based on four-year continuous monitoring data.
-
The overall prevalence of schistosomiasis in 457 surveillance sites across China showed a downward trend from 2015 to 2018. The sero-prevalence in the local population decreased 40.9% by declining from 3.35% in 2015 to 1.98% in 2018, which match sero-prevalence trends in the local populations of lake and marsh regions, water-network regions, and mountainous regions. The sero-positive rate of the floating population decreased by 24.35% from 1.15% in 2015 to 0.87% in 2018 (Figure 1). The prevalence of schistosomiasis in the local population decreased from 0.05% in 2015 to 0.00% in 2018, all of which belong to the lake and marshland epidemic areas. Only 96 parasitologically-diagnosed cases were found from 524,093 individuals in the four years, leading to an overall prevalence of 0.018%. The prevalence of schistosomiasis in the floating population decreased from 0.020% in 2015 to 0.003% in 2018. A total of 34 infected cases were found from 377,088 floating individuals from 2015 to 2018.
 Figure 1.
Sero-prevalence and estimated prevalence* of the local population and floating population in national schistosomiasis surveillance sites in China from 2015 to 2018.
*Data include results of serological and fecal tests of local and floating populations in all surveillance sites throughout the country from 2015 to 2018 and all tests are standardized according to the requirements of the surveillance scheme.SLL: sero-prevalence of the local population in lake and marsh regions; SLW: sero-prevalence of the local population in water-network regions; SLM: sero-prevalence of the local population in mountainous regions; SPL: sero-prevalence of the local population; SPF: sero-prevalence of the floating population; EPL: estimated prevalence of the local population; EPF: estimated prevalence of the floating population.The estimated prevalence is equal to the fecal positive rate, which is the infection rate of Schistosoma in the population.The prevalence of schistosomiasis in livestock decreased from 0.037% (5/13,406) in 2015 to 0.000% (0/8,669) in 2018 (Table 1). No snails were found to be infected with S. japonicum for four consecutive years. For each year from 2015 to 2018, the total area of newly found habitats of snails was 34,730 m2, 1,367,694 m2, 18,944 m2, and 50,420 m2, respectively, and the total area of re-emergent habitats of snails was 822,194 m2, 1,391,779 m2, 1,516,292 m2, and 1,750,558 m2, respectively. The newly found habitats of O. hupensis have been minimally changing every year outside of the explosive growth in habitats found in lake and marsh regions in 2016 (Table 2). But the re-emergent of O. hupensis habitats have been increasing year by year from 2015 to 2018, mainly in lake and marsh regions or water-network regions (Figure 2).
PLADs 2015 2016 2017 2018 No. of examined cattle No. of infected cattle Infection rate (%) No. of examined cattle No. of infected cattle Infection rate (%) No. of examined cattle No. of infected cattle Infection rate (%) No. of examined cattle No. of infected cattle Infection rate (%) Shanghai 854 0 0.000 0 0 0.000 369 0 0.000 0 0 0.000 Jiangsu 162 0 0.000 448 0 0.000 138 0 0.000 63 0 0.000 Zhejiang 152 0 0.000 242 0 0.000 243 0 0.000 120 0 0.000 Anhui 2,072 0 0.000 1,753 0 0.000 1,620 0 0.000 1,161 0 0.000 Fujian 712 0 0.000 761 0 0.000 552 0 0.000 958 0 0.000 Jiangxi 1,013 0 0.000 1,862 0 0.000 669 0 0.000 584 0 0.000 Hubei 1,857 0 0.000 1,492 0 0.000 1,778 0 0.000 969 0 0.000 Hunan 2,389 5 0.209 2,367 1 0.042 3,051 0 0.000 1,158 0 0.000 Guangdong 187 0 0.000 0 0 0.000 195 0 0.000 0 0 0.000 Guangxi 739 0 0.000 936 0 0.000 1,158 0 0.000 580 0 0.000 Sichuan 1,434 0 0.000 1,635 0 0.000 4,026 0 0.000 1,081 0 0.000 Yunnan 1,835 0 0.000 1,693 0 0.000 1,778 0 0.000 1,988 0 0.000 Chongqing 0 0 0.000 0 0 0.000 22 0 0.000 7 0 0.000 Total 13,406 5 0.037 13,189 1 0.008 15,599 0 0.000 8,669 0 0.000 Abbreviations: PLADs=provincial-level administrative divisions. Table 1. Schistosoma infection rate in cattle in national schistosomiasis surveillance sites in China from 2015 to 2018.
Items 2015 2016 2017 2018 Surveillance area (m2) 222,951,328 219,179,774 246,797,869 236,951,253 Area infested by snail (m2) 74,266,296 69,977,767 69,406,026 65,456,951 Number of sampling frames (0.11 m2) 1,691,779 1,155,680 1,447,609 1,366,937 Number of samples infested 68,721 70,061 93,479 66,102 Number of live snails 211,545 222,921 272,273 151,968 Number of infected snails 0 0 0 0 Density of live snail (per 0.11 m2) 0.13 0.19 0.19 0.11 Area of new habitats (m2) 34,730 1,367,694 18,944 50,420 Area of re-emergent habitats (m2) 822,194 1,391,779 1,516,292 1,750,558 Table 2. Monitoring results of O. hupensis in national schistosomiasis surveillance sites in China from 2015 to 2018.
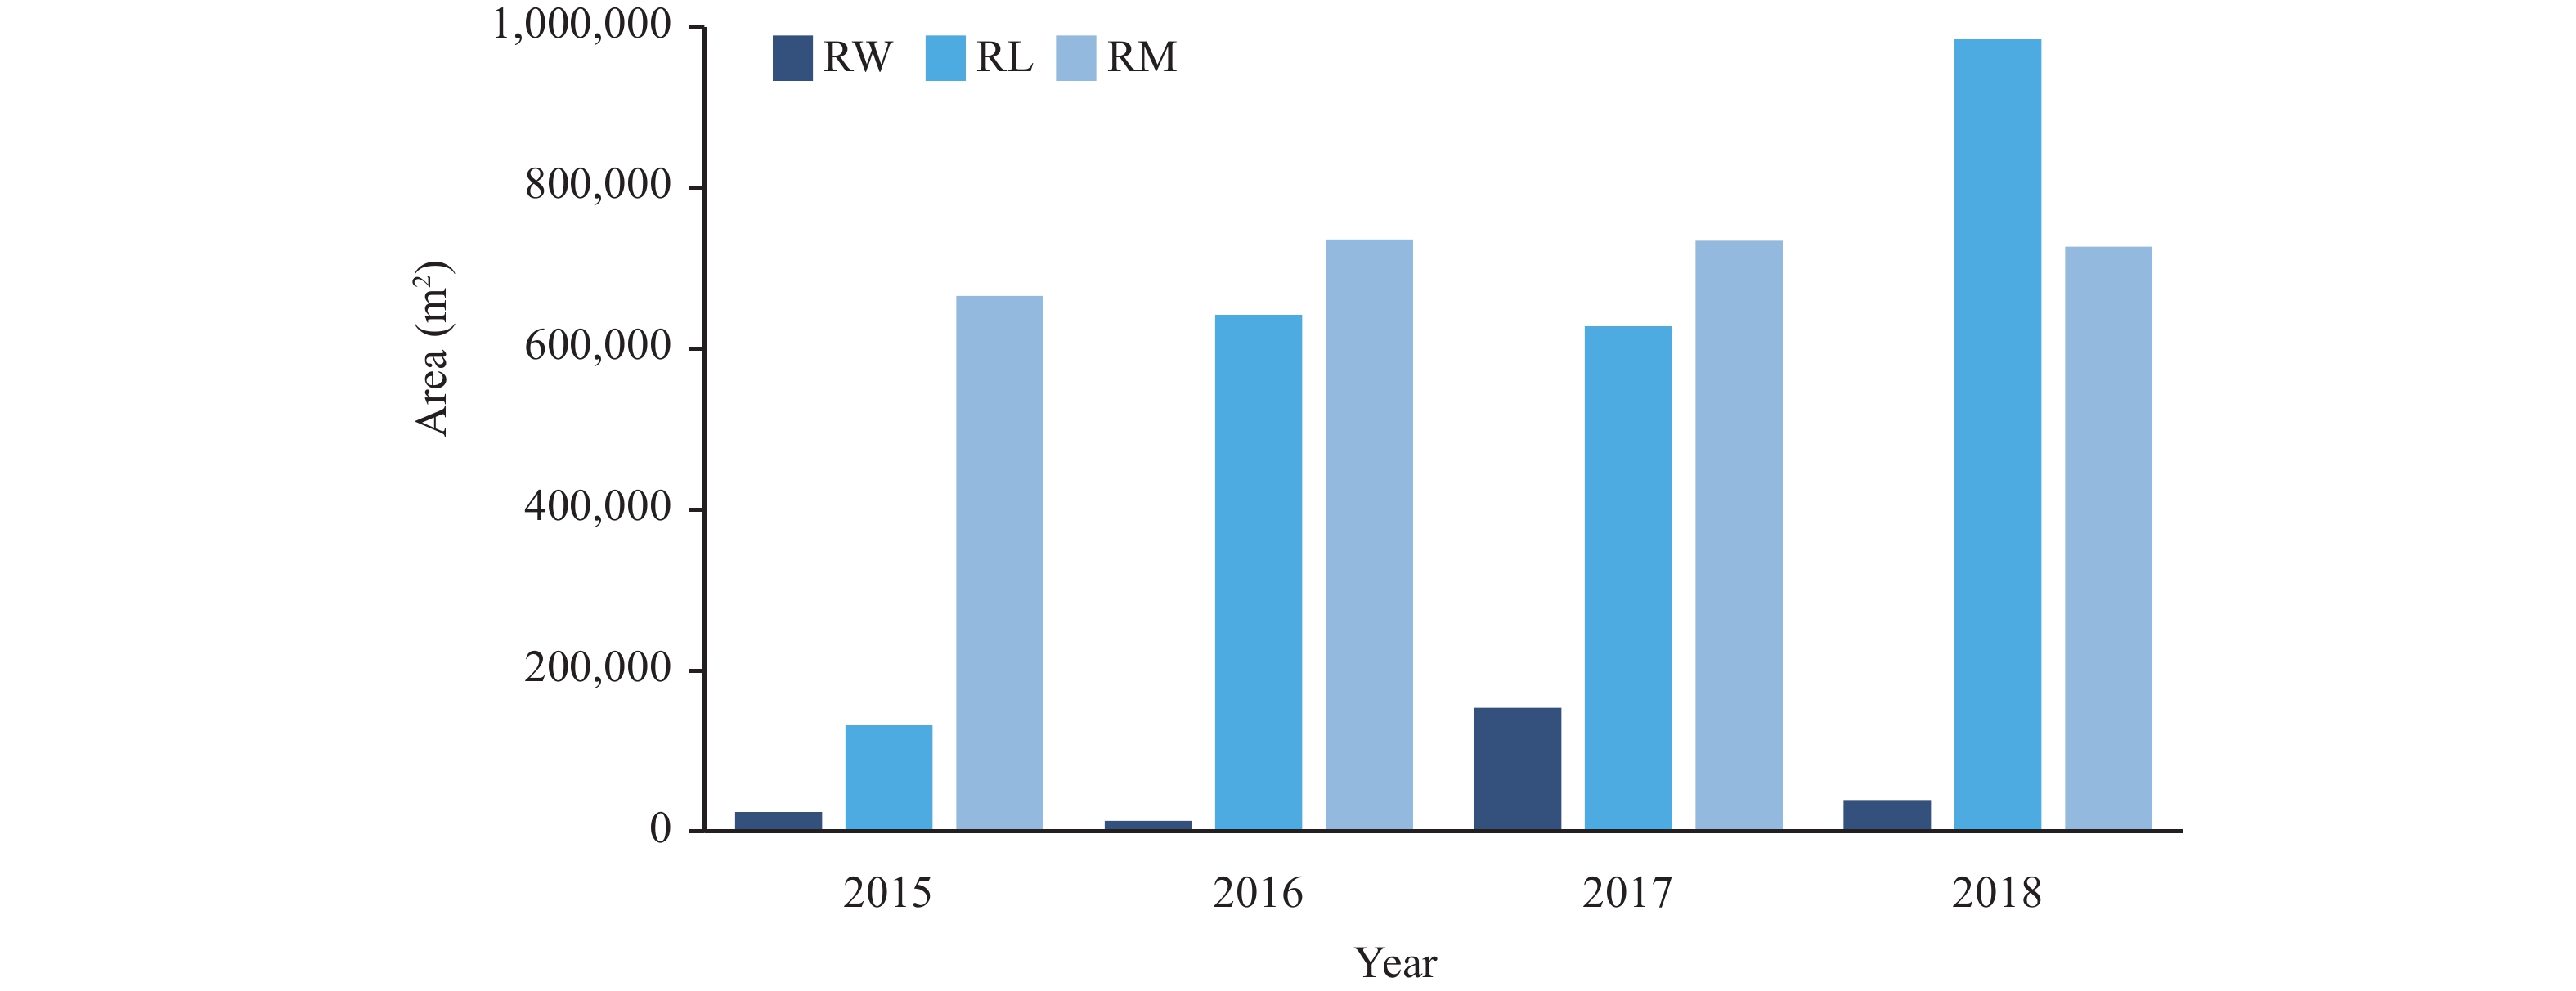 Figure 2.
Re-emergent habitats change of O. hupensis by different epidemic types in national schistosomiasis surveillance sites in China from 2015 to 2018.
Abreviation: RL: Re-emergent habitats of O. hupensis in lake and marsh regions; RW: Re-emergent habitats of O. hupensis in water-network regions; RM: Re-emergent habitats of O. hupensis in mountainous regions. -
The infection rate of local and floating populations in surveillance sites is decreasing year by year, which is mostly consistent with the downward trend of the schistosomiasis epidemic in China and closely related to the formulation of policies for schistosomiasis control and the implementation of relevant measures (8). For another source of infection, the cattle infection rate has shown decreases every year like that of the population and has eventually dropped to zero in both 2017 and 2018. Previous reports have shown that comprehensive control measures, mainly replacing cattle with machines, can effectively control the transmission of S. japonicum and significantly reduce the infection rates of humans and other cattle (9). Although the infection rates of population and cattle have been decreasing year by year, a lack of effective methods makes the supervision of the floating population of humans inconvenient and brings more severe challenges to infectious sources control (10). At the same time, a large base of cattle in the epidemic area with no long-term mechanism for forbidding depasturing of livestock on marshland and for replacing cattle with the machine have made controlling cattle populations difficult (11). The above conditions indicated that the infection source control is still facing tremendous challenges.
As shown in Table 2, the infection rate of O. hupensis at surveillance sites has been zero for four consecutive years, but the total area of the breeding area of O. hupensis has not shown much change even though O. hupensis control is carried out every year. This demonstrates that existing strategies have limitations on the control of the breeding area of O. hupensis, possibly due to environmental factors such as precipitation and change of temperature (12). The newly found habitats of O. hupensis showed explosive growth in area in 2016, which may be related to the flood disasters caused by too much rainfall in the previous year which allowed O. hupensis to spread widely.
The epidemic situational analysis reports of national surveillance sites in 2015 and 2016, without continuity analysis of epidemic situation, are limited to analysis of data for that year (13-14). This is the first continuity analysis of the epidemic situation since all surveillance sites in epidemic counties have been fully covered. The 457 surveillance sites cover every epidemic county, and almost all aspects of schistosomiasis transmission are involved in the surveillance contents. The results of each surveillance site may only reflect the local epidemic situation or, to some extent, the epidemic situation of the whole county where the surveillance site is located.
The results indicated that the habitats of O. hupensis reemerged and were increasing every year. In addition, people and livestock that are frequently mobile may become sources of infection for schistosomiasis, and the areas with epidemic O. hupensis may become areas with high risk of transmission of imported schistosomiasis. Therefore, monitoring of infectious sources of schistosomiasis needs to be strengthened, especially in human populations, and effective control and reduction of snail breeding areas may be an effective method for reducing the risk of schistosomiasis transmission.
HTML
| Citation: |

|