

 Download:


-
Adverse pregnancy outcomes (APOs) are important public health issues. Shanxi Province in northern China has been identified as a region with the highest prevalence of birth defects nationwide and also the highest prevalence of neural tube defects in the world (1). Since over 30 years ago, large amounts of financial support have been devoted for the prevention of birth defects and related intervention, and huge progress has been made as a 60% decrease in its prevalence was observed from 2009 to 2014 (2). With socioeconomic and nutritional improvements, the prevalence of other APOs might also have changed in recent years, yet indexes in that region were less reported. Our study aimed to investigate the trends of prevalence of APOs at birth and to provide evidence for new strategies for APO prevention and intervention in rural areas in northern China.
This study was a population-based descriptive study of APOs in Pingding and Xiyang County in Shanxi Province of China from 2007 to 2019. Data was derived from two birth surveillance systems: the Perinatal Health Care Surveillance System, which monitors the course and outcome of all births of resident women and their fetuses/infants from the onset of pregnancy to Day 42 after delivery, and the Birth Defects Surveillance System that specifically records live-born or stillborn infants with birth defects (3). To better understand the current situation of APOs, data was extracted from the National Free Pre-Pregnancy Checkups Project (NFPCP) in Pingding County that provided free physical examinations and counselling for local couples who planned to get pregnant and recorded the course and outcome of their pregnancies from 2017–2019 (4).
APOs were defined as neonatal deaths, stillbirths, birth defects, low birth weight, macrosomia, preterm births and spontaneous abortion. Livebirths or stillbirths were defined as birth defects if fulfilling the following conditions: 1) being of at least of 20 weeks’ gestational age or having a birthweight of at least 500 g; 2) having an external structural birth defect that could be determined by physical examination at birth; and 3) having that birth defect diagnosed or its signs and symptoms recognized by 6 weeks of age. Stillbirths in the Perinatal Healthcare Surveillance System were defined as fetal losses in pregnancies beyond 20 weeks of gestation and defined in the NFPCP as fetal losses beyond 28 weeks of gestation. Neonatal deaths were the deaths of newborns between zero and seven days after birth. Preterm births were livebirths before 37 gestational weeks. Low birth weight (LBW) were livebirths ≥37 gestational weeks and weighing <2,500 g. Macrosomia was defined as livebirths of birth weight ≥4,000 g and ≥37 gestational weeks. The prevalence of APOs was calculated by using the total number of APOs as the numerators and all births or pregnancies as the denominators and was described as the number of APOs per 1,000 births or per 1,000 pregnancies. The Cochran-Armitage trend test was adopted to examine the trends of incidence across years (denoted as
$ {\chi }_{trend}^{2} $ ) (5). R software 3.6.1 (R Development Core Team, Vienna, Austria) was used for the analysis.From 2007 to 2012, there were 31,394 births in total, among whom were 4,858 cases of APOs. Table 1 showed that the total birth prevalence of APOs was 154.7 per 1,000 births. The birth prevalence of macrosomia, LBW, preterm births, stillbirths, birth defects, and neonatal deaths were 64.5 per 1,000 births, 40.5 per 1,000, 21.9 per 1,000, 12.3 per 1,000, 12.2 per 1,000, and 3.4 per 1,000, respectively.
Year Births Macrosomia Low birth weight Preterm births Stillbirths Birth defects Neonatal deaths (≤7 d) n n Prevalence n Prevalence n Prevalence n Prevalence n Prevalence n Prevalence 2007* 4,497 268 59.6 197 43.8 86 19.1 44 9.8 59 13.1 10 2.2 2008 6,459 410 63.5 317 49.1 158 24.5 88 13.6 66 10.2 24 3.7 2009 5,658 377 66.6 232 41.0 175 30.9 64 11.3 87 15.4 26 4.6 2010 5,371 348 64.8 207 38.5 133 24.8 75 14.0 69 12.8 25 4.7 2011 4,895 286 58.4 183 37.4 83 17.0 56 11.4 59 12.1 18 3.7 2012† 4,490 334 74.4 135 30.1 53 11.8 56 12.5 42 9.4 4 0.9 Total 31,394 2,024 64.5 1,272 40.5 688 21.9 385 12.3 382 12.2 107 3.4 * The 2007 data of Xiyang County were from October to December.
† The 2012 data of Xiyang County were from January to September.Table 1. Prevalence of adverse pregnancy outcomes in Pingding and Xiyang Counties from 2007–2012 (1/1,000 births).
Figure 1 showed that the birth prevalence of macrosomia increased significantly from 59.6 to 74.4 per 1,000 births from 2007–2012 (
$ {\chi }_{trend}^{2} $ =20.314, P<0.001). Birth prevalence of LBW and preterm births declined significantly, from 43.8 per 1,000 births and 19.1 per 1,000 births in 2007 to 30.1 per 1,000 births and 11.8 per 1,000 births in 2012, respectively ($ {\chi }_{trend}^{2} $ =21.748, P<0.001;$ {\chi }_{trend}^{2} $ =14.342, P<0.001). The birth prevalence of neonatal deaths, stillbirths, and birth defects stayed at a relatively low level of 3.3 per 1,000 births, 12.1 per 1,000, and 12.2 per 1,000 (P>0.05), respectively.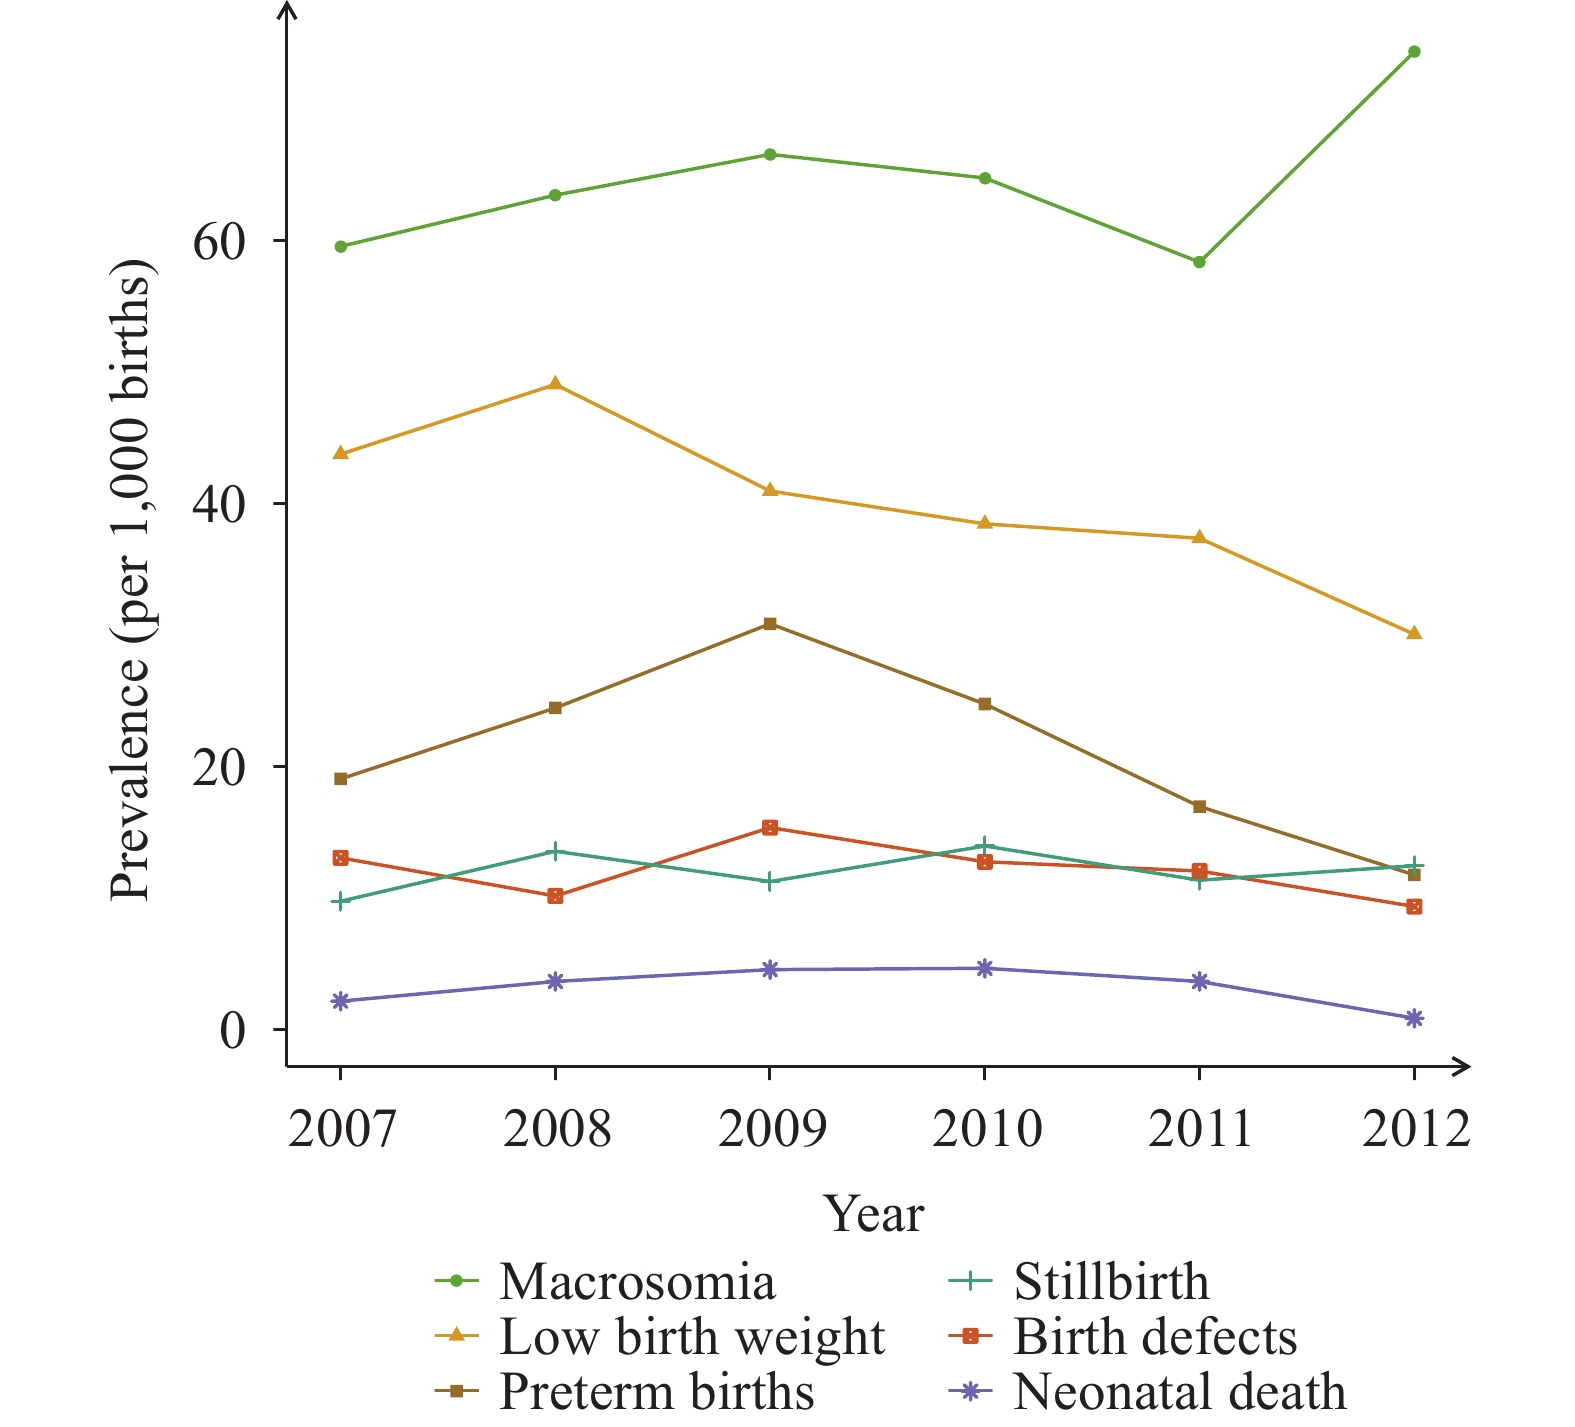 Figure 1.
Prevalences of adverse pregnancy outcomes in Pingding County and Xiyang County from 2007–2012.
Table 2 showed from 2017–2019 that the prevalence of LBW, preterm births, spontaneous abortion, birth defects, and stillbirths were 46.1 per 1,000 pregnancies, 36.2 per 1,000, 28.8 per 1,000, 6.6 per 1,000, and 2.7 per 1,000, respectively.
Year Pregnancies Low birth weight Preterm births Spontaneous abortion Birth defects Stillbirths n n Prevalence n Prevalence n Prevalence n Prevalence n Prevalence 2017 849 42 49.5 27 31.8 12 14.1 6 7.1 4 4.7 2018 788 37 47 29 36.8 29 36.8 7 8.9 1 1.3 2019 795 33 41.5 32 40.3 29 36.5 3 3.8 1 1.3 Total 2,432 112 46.1 88 36.2 70 28.8 16 6.6 6 2.7 Note: The data came from the National Free Pre-Pregnancy Checkups Project and was a cluster sampling of Pingding County. Table 2. Prevalence of adverse pregnancy outcomes in Pingding County from 2017–2019 (1/1,000 pregnancies).
Figure 2 presented that the prevalence of LBW dropped from 49.5 to 41.5 per 1,000 pregnancies from 2017–2019, while preterm births rose from 31.8 per 1,000 to 40.3 per 1,000 pregnancies during the same time period. The prevalence of spontaneous abortion rose sharply from 14.1 per 1,000 in 2017 to 36.8 per 1,000 in 2018 and then dropped slightly to 36.5 per 1,000 pregnancies in 2019. Though with fluctuations, prevalence of stillbirths and birth defects both stayed at a relatively low level.
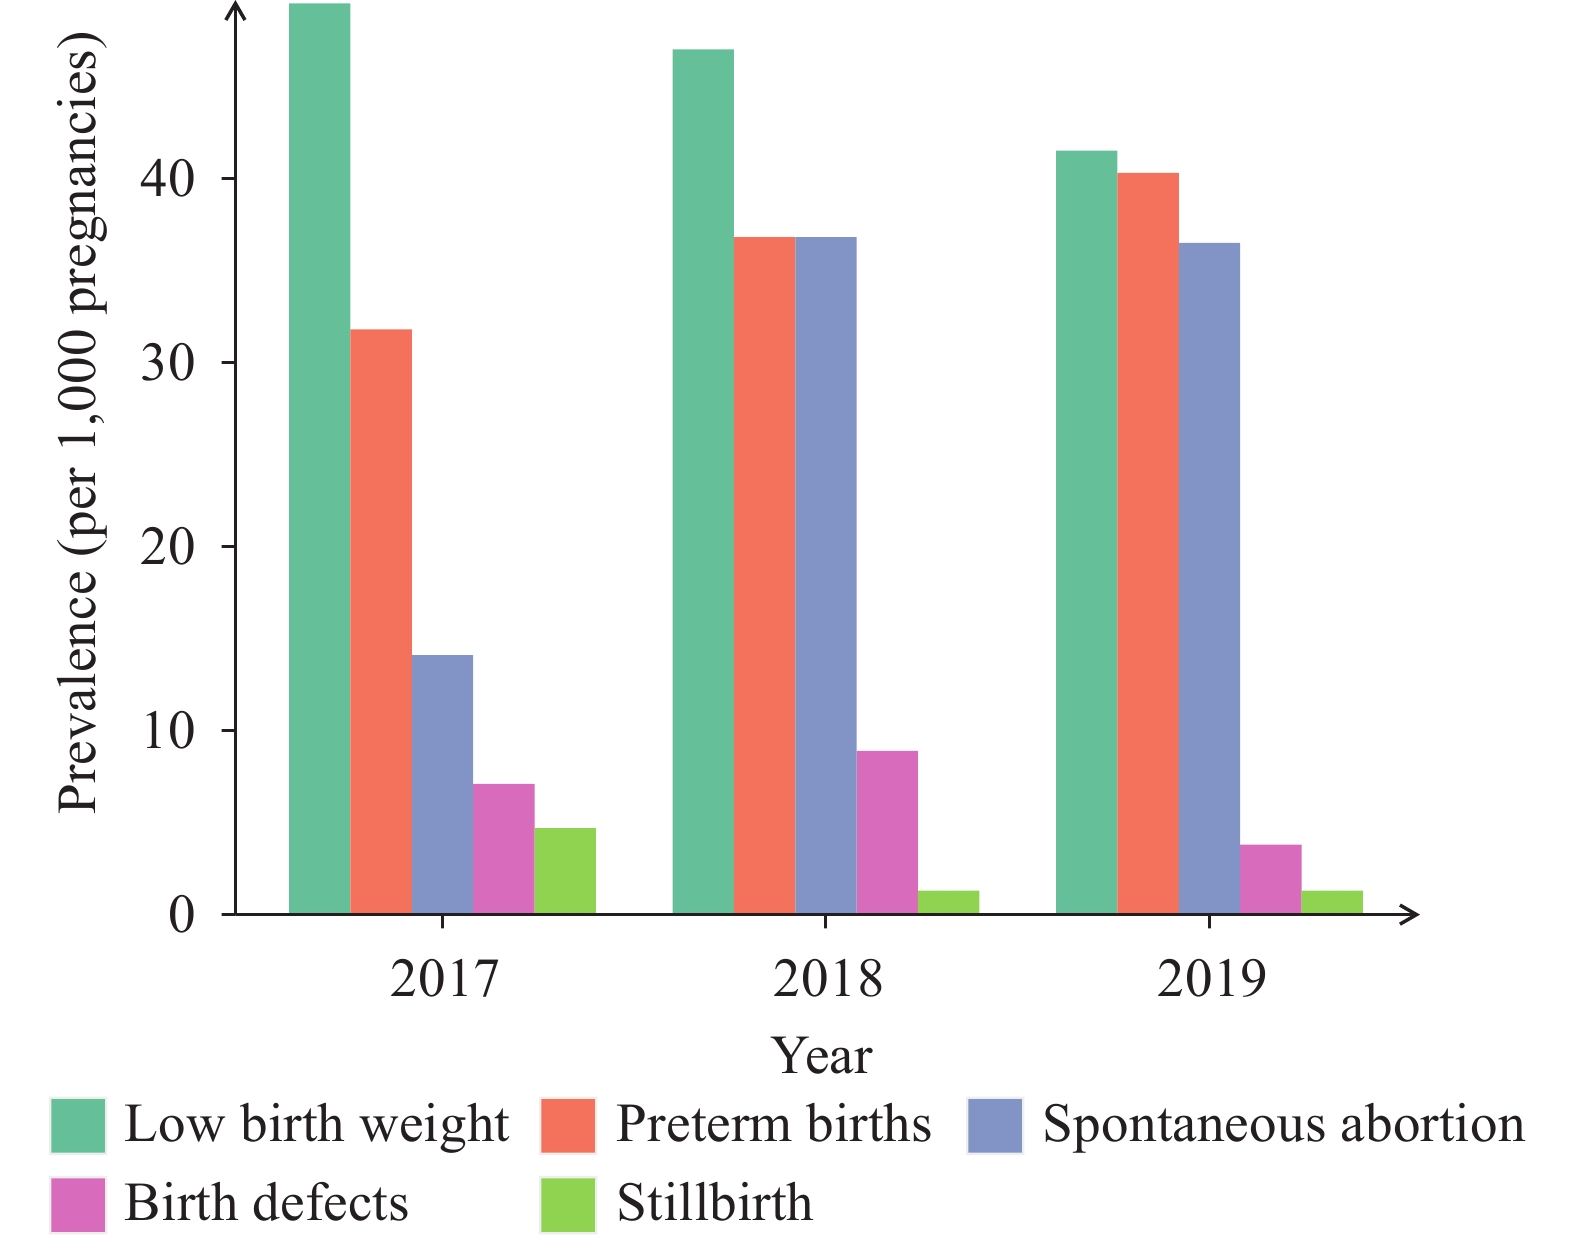 Figure 2.
Prevalences of adverse pregnancy outcomes in Pingding County from 2017 to 2019.
Figure 3 displayed that from 2007–2012, macrosomia, LBW, and preterm births were most severe in newborn babies, accounting for 91.4% of the 6 adverse birth outcomes (macrosomia, LBW, preterm births, birth defects, stillbirth, and neonatal death) with macrosomia comprising 41.7%.
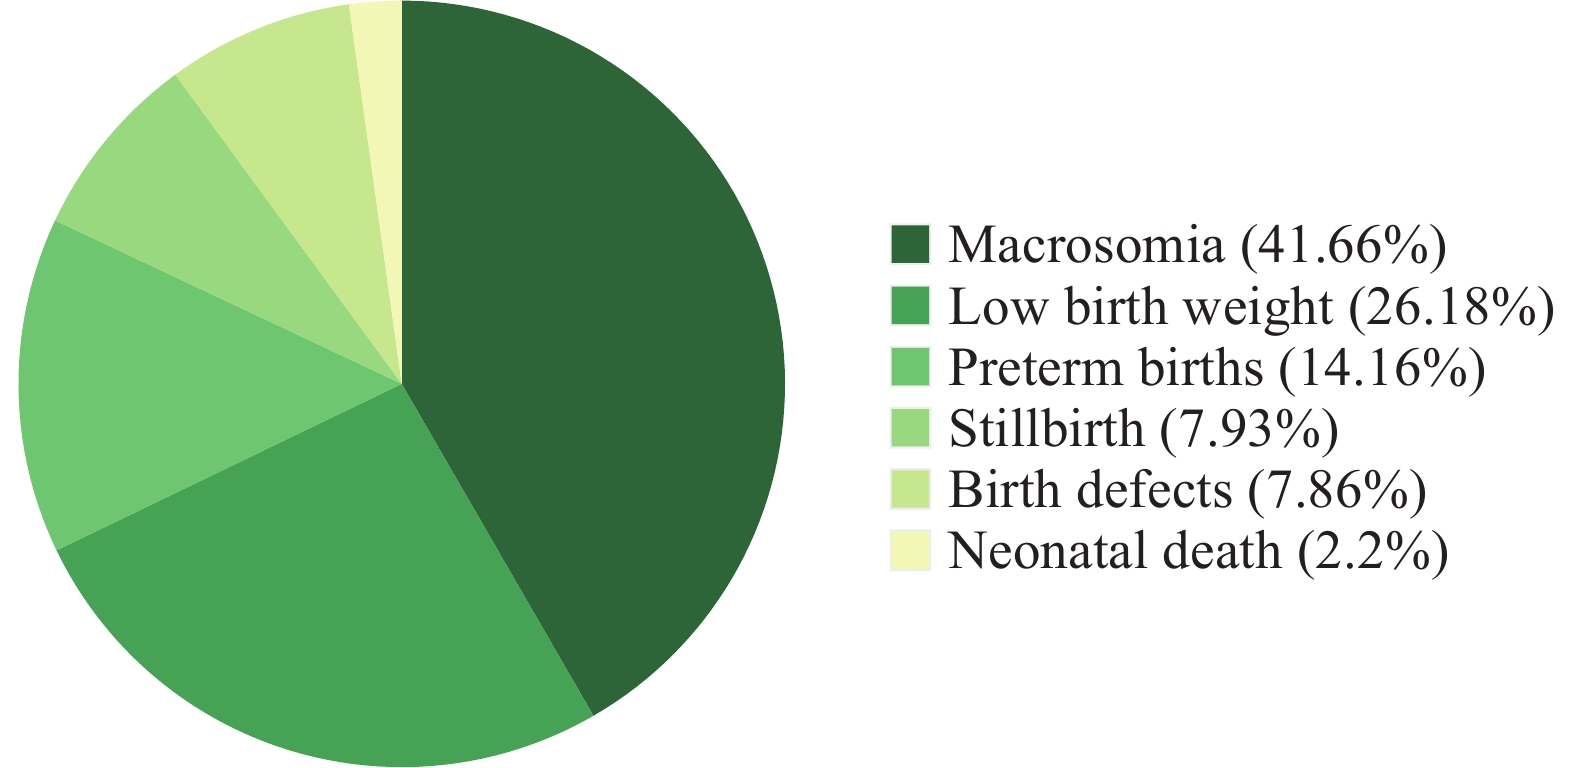 Figure 3.
Proportions of 6 adverse pregnancy outcomes between 2007 and 2012 in Pingding County and Xiyang County.
HTML


-
In this study, the prevalence of LBW (40.5 per 1,000 births) and macrosomia (64.5 per 1,000 births) from 2007–2012 were similar to those reported in Shanxi in 2010 (44 per 1,000 births for LBW and 63 per 1,000 births for macrosomia) (6). The prevalence of preterm births (21.9 per 1,000 births) from 2007–2012 was a much lower than that reported by a survey covering 132 cities in China from 2010–2013 [72 per 1,000 births (7)]. The prevalence of LBW (46.1 per 1,000 births) and preterm births (36.2 per 1,000 births) from 2017–2019 was higher than that from 2007–2012. Considering participants from 2017–2019 were couples who had plans for pregnancy and that planned pregnancies were normally observed to have lower risks of APOs (8), the prevalence of LBW and preterm births in general populations from 2017–2019 could have been even higher. This study called for attention on the rising prevalence of the three APOs, namely, macrosomia, preterm births and LBW.
It is worth noting that the total annual pregnancies from 2017–2019 were much lower compared to the total annual births from 2007–2012, mainly because the former only covered couples planning for pregnancy and participating in the NFPCP while the latter was based on population-based birth data. For a similar reason, the prevalence of stillbirths and birth defects from 2007–2012 was much higher compared to that from 2017–2019. In addition, stillbirth data from 2007–2012 covered fetal deaths at ≥20 weeks of gestation while data from 2017 to 2019 only included fetal deaths at ≥28 gestational weeks. A 2012–2014 national survey in 441 hospitals estimated the prevalence of stillbirths to be 8.8 per 1,000 births (9) and another more recent survey from 2015–2016 in 96 hospitals in 24 provinces estimated the prevalence of stillbirth to be 13.2 per 1,000 births (10).
This research found that the prevalence of macrosomia, LBW, preterm births, and spontaneous abortion was high among all APOs, with macrosomia increasing from 2007 to 2012 while prevalence of birth defects, neonatal deaths, and stillbirths staying at relatively low levels. China has been prioritizing the reduction of birth defects, stillbirths, and neonatal deaths; however, though infant mortality caused by these elements has declined, the prevalence of chronic diseases in children related to prematurity, LBW, and macrosomia have increased. Attention and investment in prevention and community coverage of preterm births, LBW, and macrosomia are still far from enough. Yet the short-term and long-term consequences, including neurodevelopmental impairments, cardiovascular diseases, and metabolic diseases, are significant and non-negligible (11-12). In addition, complications associated with preterm births are proven to be closely related to neonatal deaths, and both fetal growth restriction and preterm births are strongly associated with placental dysfunction and subsequent poor fetal health, carrying increased risks of stillbirths (9,12). In other words, China cannot effectively reduce the infant mortality and incidence of chronic diseases without preventing preterm births, LBW, and macrosomia. Therefore, beyond infant mortality, these three APOs need to be addressed with adequate attention, proper investment, and strategic public health measures.
This study was subject to at least some limitations. As a local descriptive study covering only two counties, these results are likely not representative of the whole province or the country. In addition, because more detailed demographic data including socioeconomic factors and other exposure factors during pregnancy were not collected in the current study, the distribution of APOs was only described in terms of maternal age and offspring sex instead of exploring the risk factors for APOs. Due to data unavailability, continuous trends for all APOs from 2007–2019 could not be extracted using the same data source, creating difficulties in comparing results year by year and with results in other research. For the same reason, we could not report the prevalence of spontaneous abortion from 2007–2012 and macrosomia from 2017–2019. Furthermore, the APOs in the NFPCP were self-reported and thus the prevalence of APOs could be underestimated from 2017–2019. A major strength of this study was that the population-based surveillance system and its design ensured coverage of over 95% of the study population (13).
In conclusion, this population-based study described APO trends in a region with high prevalence of birth defects in China. The prevalence of serious APOs including birth defects, stillbirths, and neonatal deaths remained at a relatively low level, yet macrosomia, LBW, preterm births, and spontaneous abortion comprised a majority of all APOs, with macrosomia showing an obvious upward trend from 2007 to 2012. These findings provide new evidence that prevention and intervention strategies of APOs should be comprehensive with regard to multiple APOs, especially macrosomia, LBW, preterm births, and spontaneous abortion.
| Citation: |

|