
 Download:


-
Tuberculosis (TB) is a chronic respiratory infectious disease caused by Mycobacterium tuberculosis (MTB) infection (1), which can be airborne and poses a serious threat to human health. MTB can invade all organs of the human body but mainly affects the lungs with a typical manifestation of pulmonary tuberculosis (PTB) (2). TB is one of the major infectious diseases affecting the health of public in both China and around the world. The TB epidemic in China is still severe. China is one of the 30 high TB burden countries and ranks second for the number of new estimated TB cases after India (1,3). In 2019, the number of new TB cases worldwide was about 9.96 million, with TB incidence of 130/100,000 (4). A total of 775,764 PTB cases were reported in the National Notifiable Disease Reporting System (NNDRS) in China, and the rate of reported PTB was 55.6/100,000, ranking second among Class A and Class B notifiable communicable diseases in the country (5). In 2020, the reported TB incidence in Kashgar, a prefecture in Xinjiang Uygur Autonomous Region with 12 counties/cities, was 250.4/100,000, which was 4.3 times that of the national average for the same time period. TB remained one of the major public health concerns in Kashgar. This study reviewed and analyzed the epidemiological characteristics of TB in Kashgar in the past decade to provide scientific evidence to inform the development of TB prevention and control strategies in Kashgar.
-
The information on geographic distribution, age, sex, occupation, and pathogenic classification of TB patients reported in Kashgar Prefecture during 2011–2020 was collected from the National Notifiable Disease Reporting System (NNDRS), and the demographic data were obtained from Kashgar Prefecture Bureau of Statistics.
We processed the data using Microsoft Excel (version 2016, Microsoft, USA). The data were analyzed using SPSS 22.0 (IBM, Chicago, IL, USA). The trend chi-squared test or chi-squared test was conducted to compare the rate of reported PTB in groups with different characteristics, and P<0.05 was considered statistically significant.
-
In 2011–2020, a total of 189,416 cases of PTB were reported in Kashgar, with the rate of reported cases increased from 402.18/100,000 in 2011 to 524.64/100,000 in 2017 (χ2trend=26.09, P<0.01) and remarkably declined from 806.75/100,000 in 2018 to 250.74/100,000 in 2020 (χ2trend=314.44, P<0.01). The mean annual rate of reported PTB from 2011 to 2020 was 450.91/100,000, and the mean annual rate of reported bacteriological confirmed (Bac+) PTB was 89.17/100,000. The rate of reported Bac+ PTB increased from 64.76/100,000 in 2011 to 139.12/100,000 in 2020 (χ2trend=74.44, P<0.01). The Bac+ cases accounted for 19.76% (37,425/5.48% (6,336/11,420) in 2020 (Figure 1).
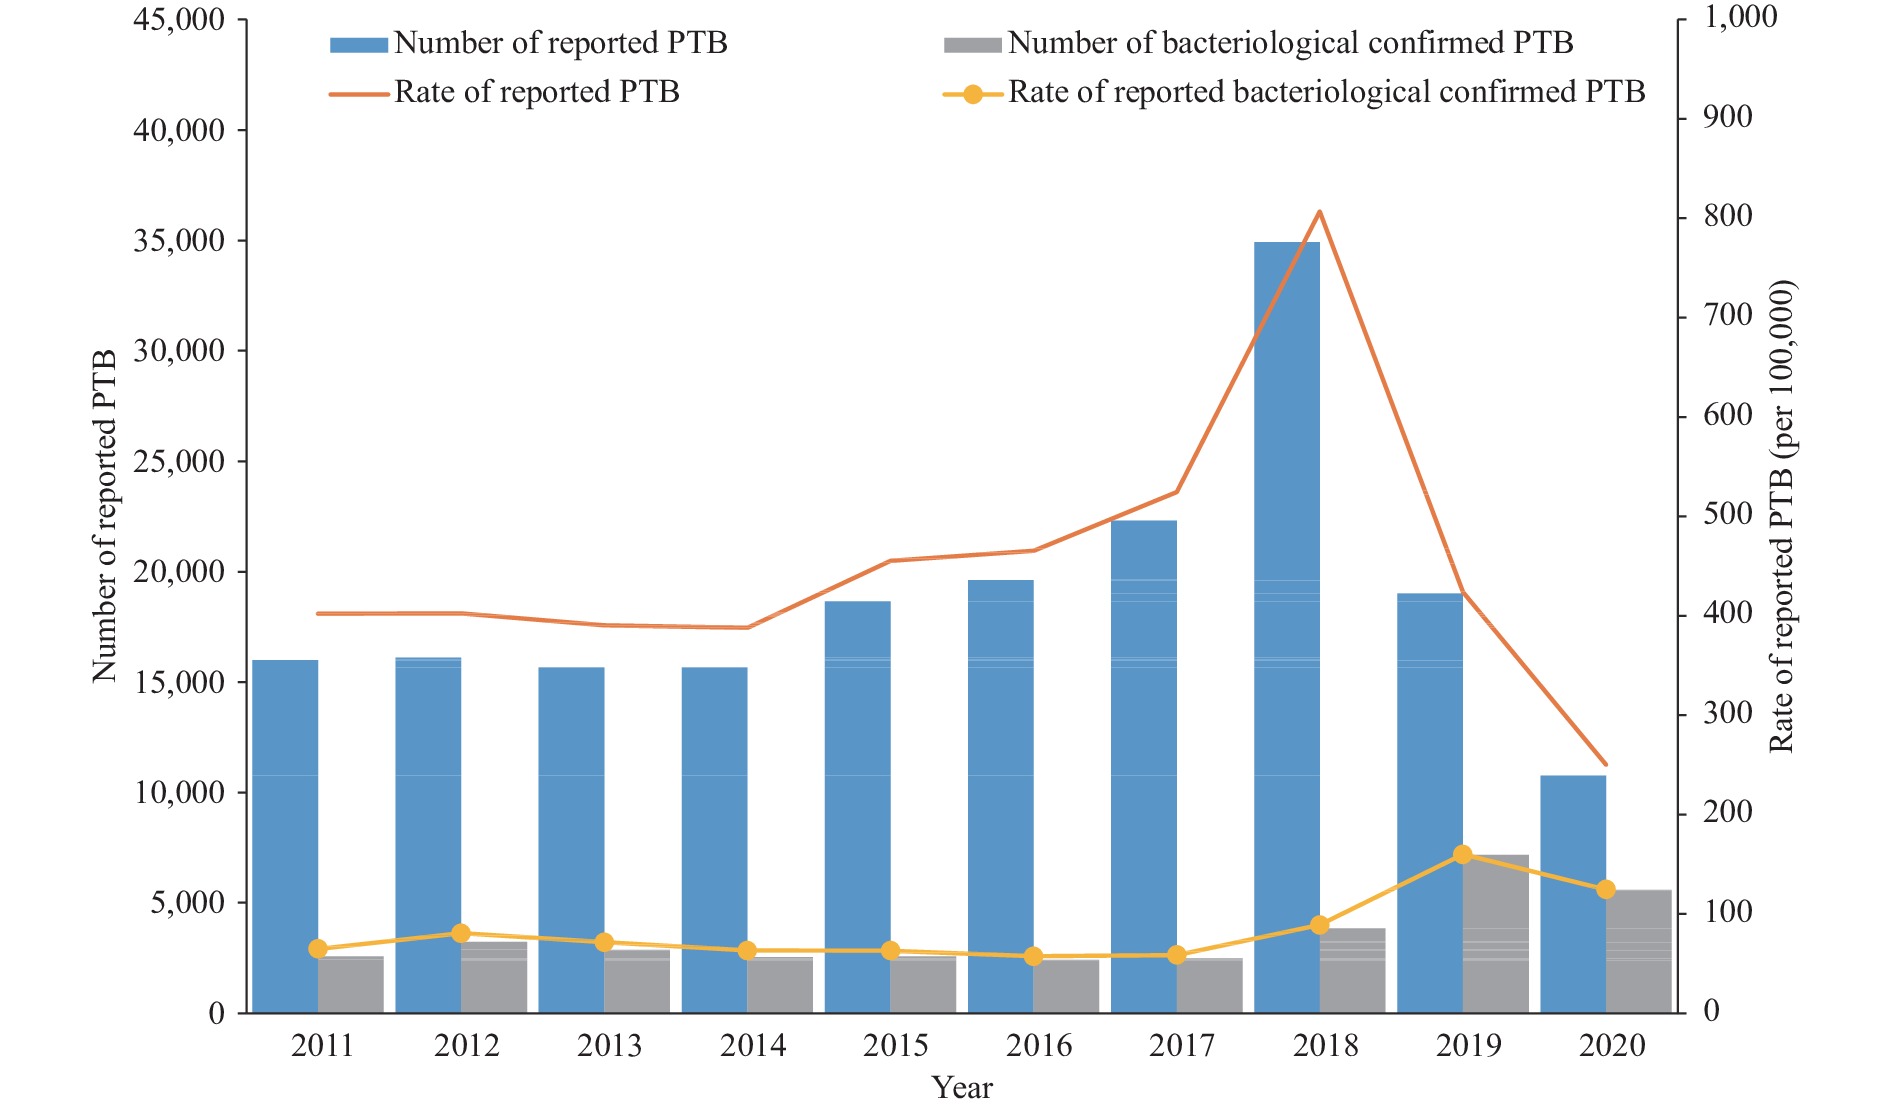 Figure 1.
The number and case notification rate of reported pulmonary tuberculosis (PTB) in Kashgar, 2011–2020.
During 2011–2017, there were mainly 2 peaks in the reported cases of PTBs observed in December and in May of each year, accounting for 10.13% (19,632/189,416) and 10% (19,374/189,416), respectively. The lowest reported PTB cases was reported in September, accounting for 6.52% of all reported PTB cases (12,638/189,416), and the highest reported PTB cases occurred in the second half of 2018, June of 2019, and May of 2020 (Figure 2).
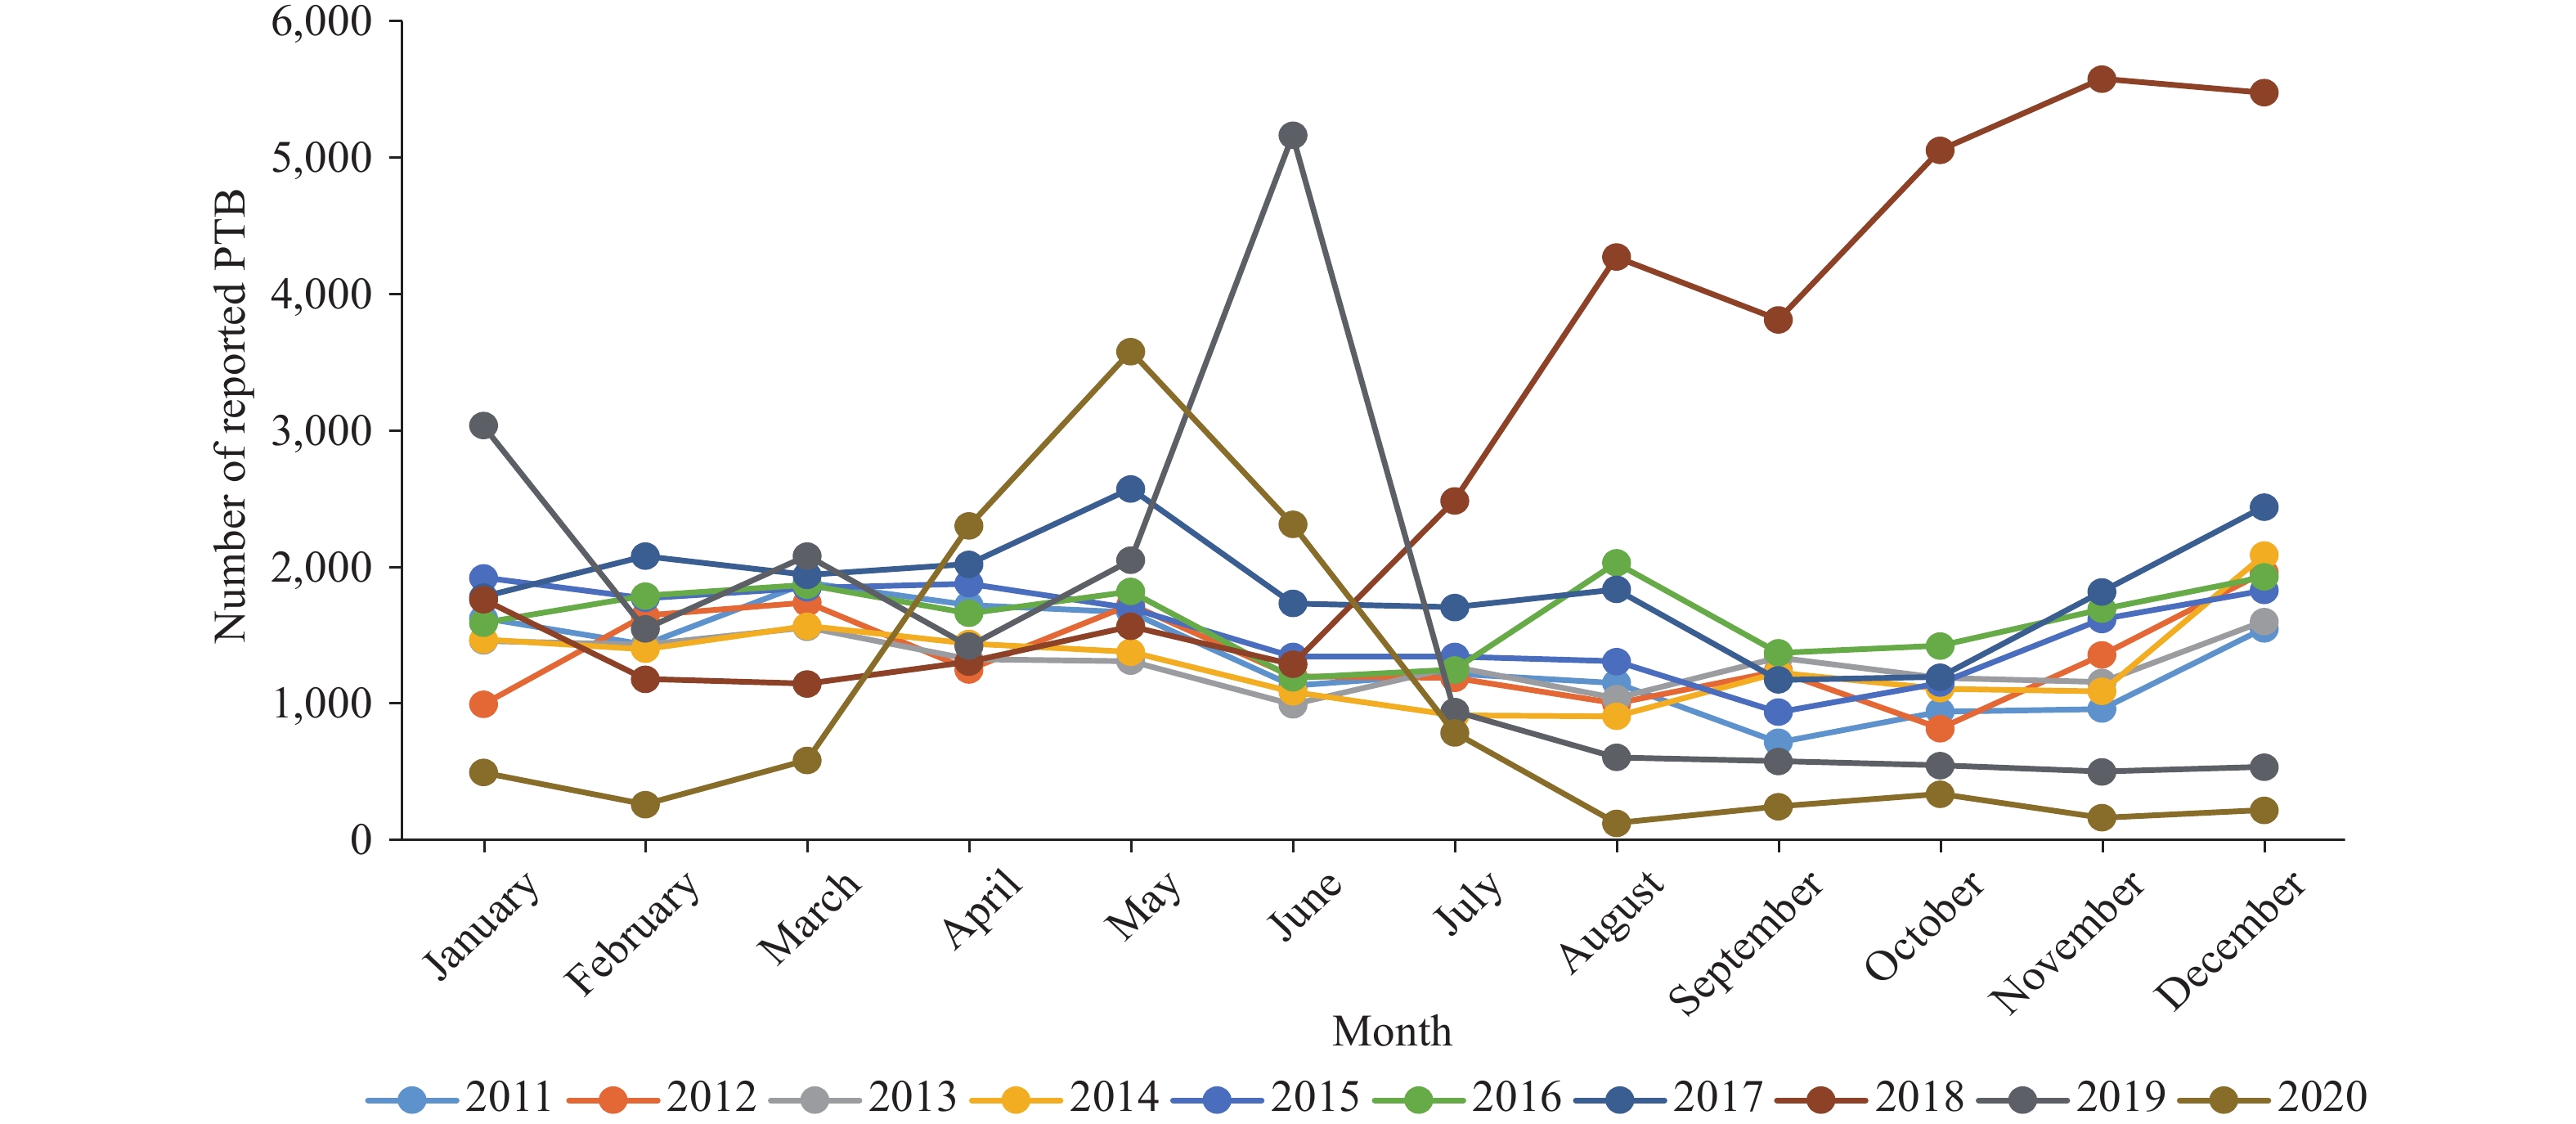 Figure 2.
Monthly distribution of reported pulmonary tuberculosis (PTB) cases in Kashgar, 2011–2020.
In 2011–2020, PTB cases were reported in all age groups, with the group of 50–79 years of age accounting for 70.95% (134,399/189,416), but the age group only accounted for 15.46% (6,490,776/41,972,493) of the whole population. The top 3 age groups with the highest rate of reported PTB were 75–79 (402.18/100,000), 85+ (4,864.42/100,000), and 70–74 (4,219.59/100,000) (Table 1).
Age (years) Number of reported cases (n) Total population Average reported incidence (1/100,000) 0–4 207 4,198,100 4.93 5–9 161 4,021,820 4.00 10–14 619 3,204,956 19.31 15–19 3,265 3,725,311 87.64 20–24 5,293 4,5641,71 115.97 25–29 6,097 4,132,047 147.55 30–34 5,755 3,249,461 177.11 35–39 5,624 3,104,012 181.18 40–44 6,590 2,706,171 243.52 45–49 8,918 2,299,515 387.82 50–54 12,244 1,740,359 703.53 55–59 18,392 1,435,042 1,281.63 60–64 27,393 1,381,596 1,982.71 65–69 32,820 963,946 3,404.76 70–74 26,498 627,976 4,219.59 75–79 17,052 341,857 4,988.05 80–84 7,910 182,041 4,345.17 85+ 4,578 94,112 4,864.42 Total (average) 189,416 41,972,493 451.29 Table 1. Age distribution of reported pulmonary tuberculosis cases in Kashgar, 2011–2020.
During 2011–2020, the mean annual rate of reported PTB of males was 451.88/100,000, and that of females was 450.67/100,000. Among all patients, males accounted for 50.13% (95,123/189,416) and females accounted for 49.87% (94,289/189,416). However, as the percentage of male patients increased over the years, there was a statistically significant difference in the ratio of male and female patients (χ2trend=204.85, P<0.01) (Table 2).
Year Male Female Number of cases Population Incidence (1/100,000) Number of cases Population Incidence (1/100,000) 2011 7,929 2,034,894 389.65 8,073 1,944,510 415.17 2012 7,800 2,005,603 388.91 8,311 1,998,390 415.88 2013 7,717 2,010,057 383.92 7,955 2,002,272 397.30 2014 7,525 2,036,026 369.59 8,153 2,003,363 406.97 2015 8,884 2,053,422 432.64 9,777 2,044,954 478.10 2016 9,522 2,133,707 446.27 10,098 2,080,940 485.26 2017 11,180 2,121,851 526.90 11,126 2,129,834 522.39 2018 17,981 2,149,467 836.53 16,950 2,180,376 777.39 2019 10,539 2,234,589 471.63 8,476 2,253,754 376.08 2020 6,046 2,270,730 266.26 5,370 2,283,754 235.14 Total 95,123 21,050,346 451.88 94,289 20,922,147 450.67 Table 2. Gender distribution of reported pulmonary tuberculosis cases in Kashgar, 2011–2020.
In 2011–2020, the top 3 occupations of PTB patients reported were farmers (83.81%, 158,741/189,416), housework & unemployed (6.54%, 12,383/189,416), and retirees (4.51%, 8,544/189,416), which accounted for 94.86% of all cases (179,67/189,416). The reported average annual PTB rates in Kashgar Prefecture were from Yengisar County (828.09/100,000), Zepu County (656.56/100,000), Yopurga County (556.22/100,000), Shule County (505.57/100,000), Yecheng County (477.00/100,000), Shache County (447.24/100,000), Shuhu County (396.88/100,000), Makit County (377.93/100,000), Bachu County (349.90/100,000), Kashgar City (341.33/100,000), Payzawat County (339.82/100,000), and Tashkurghan County (126.68/100,000). The 4 counties in southern Kashgar (Yecheng, Zepu, Shache, and Yengisar) accounted for 50.33% of all cases (95,335/189,416).
-
The results showed that the rate of reported PTB in Kashgar increased from 402.18/100,000 in 2011 to 524.64/100,000 in 2017 and declined from 806.75/100,000 in 2018 to 250.74/100,000 in 2020, with a significant downward trend in the last three years, declining to the lowest level in 2020. This is mainly due to the launch of TB screening as part of universal health check-up in Kashgar in 2018, in which TB screening test and treatment were provided to people over 15 years old, and about 2700,000 persons were screened each year. The early detection of large numbers of TB patients has been the primary cause for the significant rise in the CNR of PTB in 2018, and the secondary cause was the launch of the “New TB Prevention and Treatment Service System”. Since the launch of the system, referrals within the designated hospitals enhanced patient compliance, reduced patient loss to follow-up, and ensured timely reporting of PTB cases. Meanwhile, Kashgar has implemented a policy of 100% reimbursement of outpatient care cost for suspected TB patients and over 90% reimbursement of inpatient care cost for TB patients from 2018, which has raised the awareness of voluntary health care seeking of the public.
This study found that the proportion of Bac+ PTB cases in Kashgar increased from 16.10% (2,577) in 2011 to 55.48% (6,336) in 2020. The New TB Prevention and Treatment Service System was launched in 2013. In the early stage of the system operation, the quality of sputum collection and laboratory testing declined due to short of TB professionals at designated hospitals and lack of technical capacity. Thus, a downward trend in the rate of reported Bac+ patients was observed. Since 2018, the proportion of Bac+ PTB cases has increased significantly, which was related to the combination of smear, culture and molecular biological testing for TB suspects detected by universal health checkups, as well as the improvement in diagnosis (6).
In terms of temporal distribution, the highest number of PTB cases were reported in December and January each year, suggesting that winter was the peak season for PTB in Kashgar, which was similar to the findings of other studies (7-8). Possible causes for this included increased chances of survival and transmission of MTB in rural Kashgar during winter when coal was burned for heating, doors and windows were closed, rooms were crowded, and heatable brick beds were carpeted. On the other hand, autumn and winter were the slack farming seasons, in which the possibility of visiting the clinic would increase if people got sick (9). The highest reported PTB cases occurred in the second half of 2018, June of 2019, and May of 2020, which was coincident with the launch of the local TB control policies and the implementation TB screening as part of the local universal health checkup program launched at different month.
In terms of gender distribution, the number of male patients versus that of female patients increased over the years in Kashgar during 2011–2020. Possible causes included that as men in rural areas had more opportunities to go out to work, they became more mobile and easily to get infected. Some of their behaviors such as smoking and drinking could increase the chances of TB infection. In terms of age, the rate of reported PTB remained steady for patients aged 15–50 years, with a rising trend starting from 50 years of age, peaking at around 65 years of age, then declining rapidly. The peak in men was significantly higher than that in women at around 75 years of age. Overall, the distribution trend was similar to that of other prefectures of Xinjiang Uygur Autonomous Region and other provincial-level administrative divisions (10). The rise in the rate of reported PTB in the age groups above 50 years of age was similar to that of the whole Xinjiang Uygur Autonomous Region (11). The elderly population had lower immunity and was prone to comorbidity with other underlying diseases, making them a high-risk group for the reactivation of latent TB and development of new TB. In addition, the symptoms of TB in this group were usually atypical and could be easily ignored in diagnosis or misdiagnosed (12). Therefore, symptom monitoring, active screening, and other approaches should be leveraged to increase the early detection of TB for the elderly people (13). In terms of occupation distribution, the majority of TB patients in Kashgar were farmers, which was similar to that of other parts of China and other prefectures in Xinjiang. The TB incidence was closely related to economic level. Low-income groups were at higher risk and, together with the general low education level and low health literacy, led to less access to TB services because of rural location, longer working hours, and therefore more susceptibility to TB infection (9).
In terms of geographic distribution, the ranking of each county/city for the rate of reported PTB varied each year. It was worth noting that the 4 southern counties of Kashgar accounted for 50.33% of the total number of reported cases with the highest rate of reported PTB in the prefecture. The serious TB epidemic affecting these 4 counties was related to an underdeveloped economy that mainly depended on agriculture and animal husbandry, the poor living conditions, and the poor health awareness of the residents. Therefore, TB response in these 4 counties should be strengthened.
This study systematically analyzed the epidemiological characteristics of the reported PTB cases in Kashgar from 2011 to 2020, and provided a basis for TB control and prevention. At the same time, there are certain limitations in terms of time distribution and regional distribution, this study only analyzed the overall characteristics of the cumulative number of PTB cases in the past 10 years, further research is needed to reveal the temporal and spatial characteristics of the incidence of PTB in Kashgar. In summary, the continuous improvement of new TB service systems, coupled with the successful implementation of the universal health check-up program, has led to effective control of the TB epidemic in Kashgar, but a large gap is still existed between the rate of reported PTB in Kashgar and the national average in 2020. The next step should focus on the improvement of TB prevention and control in Kashgar, especially the 4 southern counties and the reinforcement of TB case detection. On the basis of routine prevention and control of COVID-19 epidemic, continued efforts should be made to screen key populations for TB and promote the TB screening as part of the universal health check-up and treatment program, which strives for early detection, diagnosis, and treatment of TB patients (14). Continued efforts should also be made to promote the application of new diagnostic techniques, increase education about and awareness of changing in unhealthy lifestyles, and reinforce the universal screening and treatment of TB, especially among the elderly people, men, and farmers, to further control the TB epidemic in Kashgar, strive to achieve the goals set in the Action Plan to Stop Tuberculosis (2019–2022) in Kashgar, and reach the relevant targets of the “Healthy China 2030” and “Poverty Alleviation in China”.
Acknowledgments: Dr. R.J. Simonds and Dr. Zhijun Li from the United States CDC China Office.
HTML
| Citation: |

|