

 Download:


-
A new tuberculosis (TB) treatment service model called the “trinity model” has been established in China since 2010. The majority of TB-designated treatment centers have been adapted from traditional CDCs to designated general hospitals in the past decade. The profiles of TB treatment health facilities from the national TB surveillance system were collected and analyzed for the current situation of TB control network and treatment service models in China. In 2020, more than one-third (38.3%) of health facilities diagnosed less than 100 TB cases, about one-fourth (24.9%) diagnosed less than 200 cases, and 92 health facilities diagnosed more than 800 cases. Among 2,960 county level TB management areas, 157 (5.3%) counties were dominated by CDCs, 364 (12.3%) by TB/infectious disease-specific hospitals, 370 (12.5%) by independent TB dispensaries/chronic disease stations①, and 2,069 (69.9%) by general hospitals. The new “trinity” TB treatment service model has been broadly implemented and proved to be successful in China’s National TB Control Program (NTP).
Pulmonary tuberculosis (PTB) was officially categorized as a Class B notifiable infectious diseases in China in 1997 (1). TB patient detection and notification have been greatly improved, but there still exists a significant gap between the estimated TB incidence number and cases notified in NTP. The fourth National TB Epidemiological Survey in 2000 (1) showed that 91% of TB patients went to general hospitals or clinics rather than TB dispensaries when they first had TB symptoms, and only 13% of them could be referred to NTP treatment center for standard management. Therefore, an integrated collaboration mechanism was started to explore potential opportunities between general health facilities (including general hospitals, clinics, and all other health facilities outside of NTP) and NTP components. Data was collected from the national TB Management Information System (TBMIS) on January 28, 2021. Profiles of TB treatment facilities were extracted and analyzed in an MS Excel® (version 2016; Microsoft Corporation) spreadsheet. Provincial, prefectural, and county level TB management areas were counted as defined in the NTP surveillance system. Treatment service models at the county level were categorized as “CDC dominated,” “Independent TB dispensary/chronic diseases station dominated” (both were public health providers rather than hospitals, but independent from CDC), “TB/infectious diseases specific hospital dominated” and “General hospital dominated” according to the type of health facilities providing diagnosis and treatment in each county.
There were 40 provincial-level TB treatment facilities in 31 PLADs, none of which were affiliated with the provincial CDC, 3 were independent TB dispensaries, 21 were TB/infectious disease specific hospitals, and the other 16 were general health facilities. There were also 364 prefectural (including 2 CDCs, 45 independent TB dispensaries, 120 TB/infectious disease specific hospitals, and 197 general health facilities), and 2,517 county level treatment facilities (including 180 CDCs, 275 independent TB dispensaries, 39 TB/infectious disease specific hospitals, and 2,023 general health facilities) in 343 prefectural areas and 2,960 county level areas, respectively.
The 2,921 health facilities that were appointed as TB treatment centers diagnosed 633,309 TB cases in 2020. More than one-third (36.5%) of health facilities diagnosed less than 100 TB cases and about one-fourth (25.5%) diagnosed 100 to 200 TB cases. There were 94 health facilities that diagnosed more than 800 TB cases in 2020, among which 11 were provincial, 45 were prefectural, and 38 were county level (Figure 1).
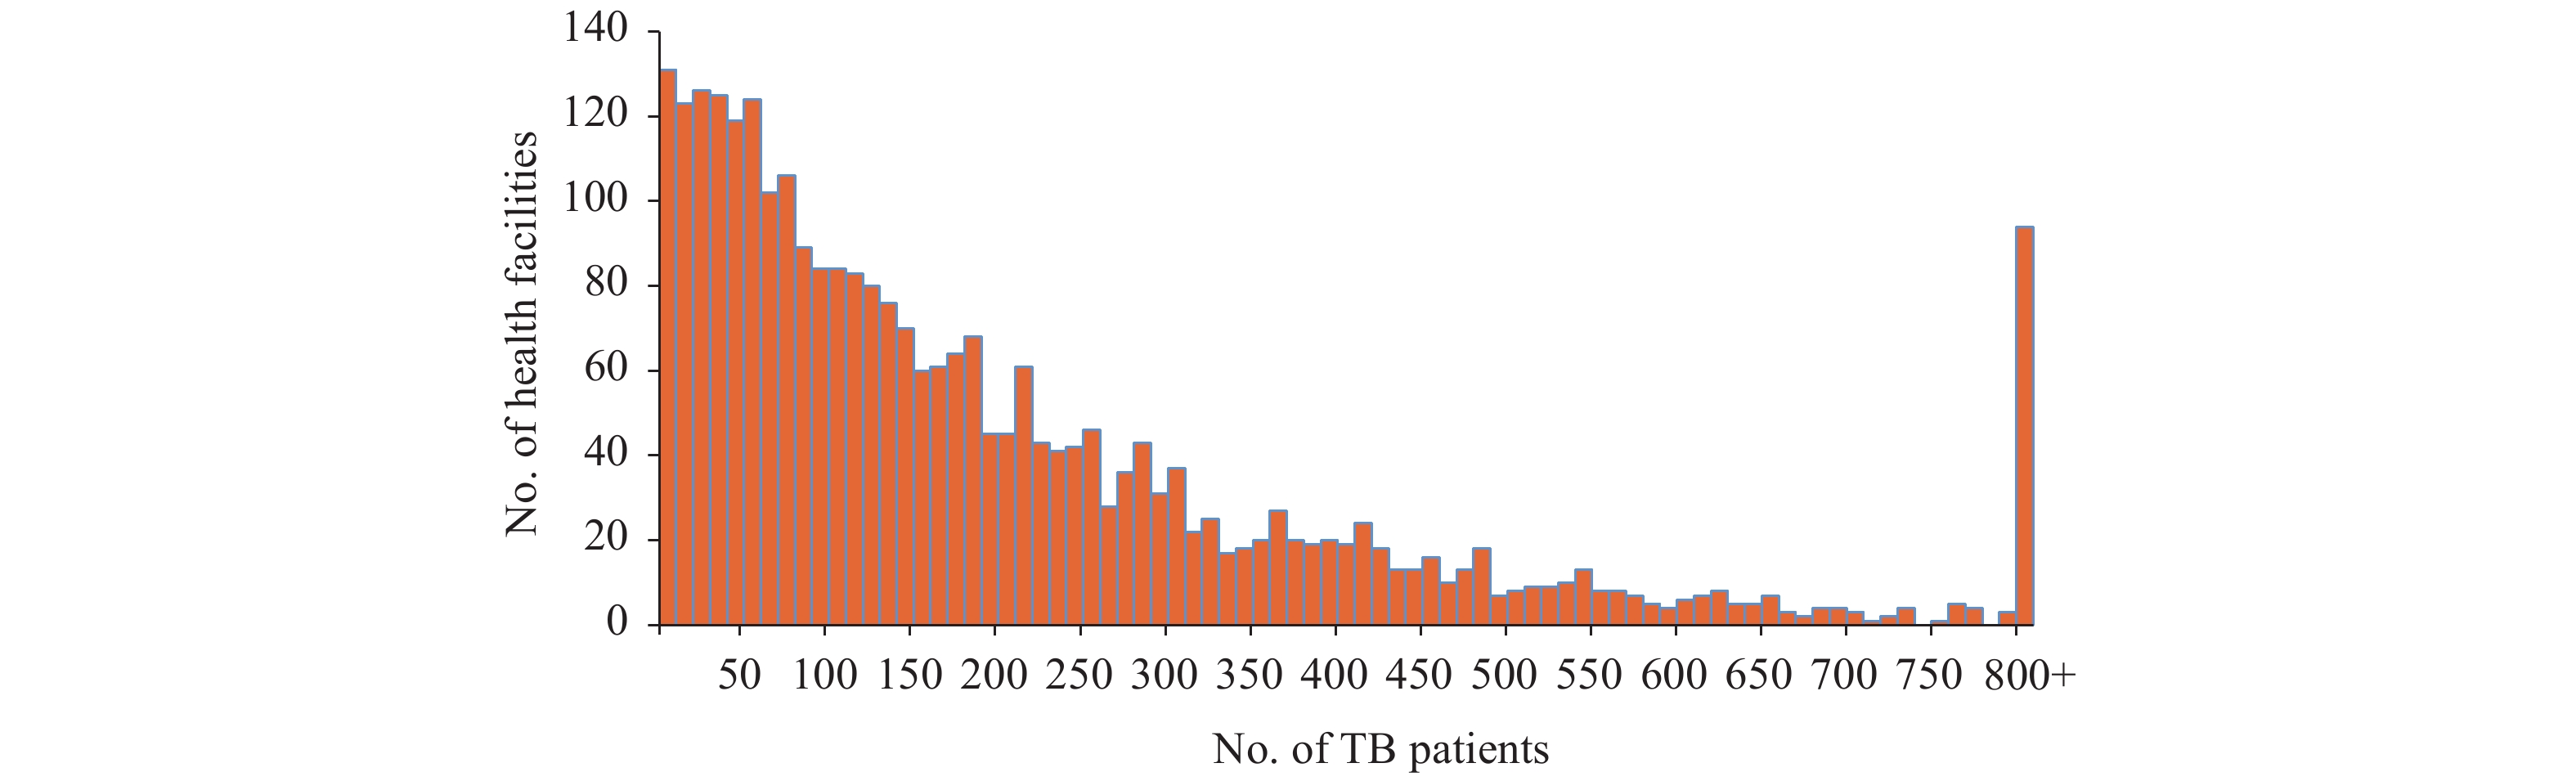 Figure 1.
Distribution of number of patients diagnosed in tuberculosis treatment health facilities in China, 2020.
Provincial and prefectural health facilities generally diagnosed more patients than county level health facilities, the median and interquartile range (IQR: Q1, Q3) were 329 (2,176: 75, 2,251), 343 (440: 167, 607), and 125 (191: 53, 243). The number of patients diagnosed by CDCs, general hospitals, independent TB dispensaries/chronic diseases stations, and TB/infectious specific hospitals increased gradually at all levels except that the prefectural-level CDCs diagnosed more patients than general hospitals (Figure 2).
 Figure 2.
Number of patients diagnosed in different types and levels of tuberculosis (TB) treatment health facilities in China, 2020 (median and interquartile range). (A) Patients diagnosed in different level of health facilities. (B) Patients diagnosed in different level and type of health facilities.
Note: A: CDCs; B: General health facilities; C: Independent TB dispensaries/chronic disease stations; D: TB/infectious disease-specific hospitals.At the end of 2020, among 2,960 county level TB management areas, 157 (5.3%) counties were dominated by CDCs, 364 (12.3%) by TB/infectious disease-specific hospitals, 370 (12.5%) by independent TB dispensaries (or chronic disease stations), and 2,069 (69.9%) by general hospitals. In most western and central areas, general hospitals already dominate as basic management units in treatment. However, independent TB dispensaries or chronic disease stations still played important roles in many northeastern and central southern areas. CDCs were less responsible for treatment and care except in Beijing Municipality, Henan Province, and a few other areas (Table 1).
PLADs CDC dominated (%) TB dispensary or chronic diseases station dominated (%) TB/infectious diseases specific hospital dominated (%) General hospital dominated (%) Beijing 37.5 25.0 0.0 37.5 Tianjin 0.0 62.5 0.0 37.5 Hebei 1.2 0.0 12.9 86.0 Shanxi 0.0 0.0 2.6 97.4 Inner Mongolia 1.9 10.5 15.2 72.4 Liaoning 14.0 36.0 43.0 7.0 Jilin 14.5 76.8 5.8 2.9 Heilongjiang 2.4 35.2 31.2 31.2 Shanghai 0.0 0.0 6.3 93.8 Jiangsu 0.0 0.0 35.2 64.8 Zhejiang 0.0 0.0 0.0 100.0 Anhui 0.0 0.0 13.5 86.5 Fujian 0.0 0.0 13.6 86.4 Jiangxi 4.0 12.0 4.0 80.0 Shandong 0.0 23.2 28.9 47.9 Henan 52.9 21.8 24.7 0.6 Hubei 7.5 14.2 10.4 67.9 Hunan 0.0 0.8 7.7 91.5 Guangdong 4.7 76.6 4.7 14.1 Guangxi 0.9 1.7 20.5 76.9 Hainan 0.0 19.4 0.0 80.6 Chongqing 0.0 17.9 0.0 82.1 Sichuan 3.7 0.0 5.8 90.5 Guizhou 1.1 0.0 1.1 97.8 Yunnan 0.0 0.0 4.7 95.3 Tibet 1.3 0.0 0.0 98.7 Shaanxi 0.0 0.0 5.4 94.6 Gansu 0.0 0.0 4.5 95.5 Qinghai 0.0 0.0 0.0 100.0 Ningxia 0.0 0.0 13.6 86.4 Xinjiang* 0.0 0.0 1.8 98.2 Abbreviations: PLADs=provincial-level administrative divisions; CDC=Center for diseases control and prevention.
* Including Xinjiang Production and Construction Corps (XPCC).Table 1. Proportions of tuberculosis (TB) treatment service model at county level in 31 PLADs of China, 2020.
-
At the end of 2020, about 70% (2,069/2,960) of county areas had appointed general hospitals as their TB designated treatment center. The “trinity” service model had already become the primary trend in NTP, but many challenges still existed in the new treatment model.
In China, before the TB service system was transformed, most TB healthcare services including diagnosis and treatment were driven by TB dispensaries in CDC or independent TB centers (2). This kind of service system has played a great role in improving the detection of TB patients (3). However, it also led to many problems. First, patients were more likely to go to general hospitals rather than CDCs when they experienced TB-related symptoms. Second, many CDCs did not possess medical service licenses for clinical services, and the public health physicians in CDC were not qualified to provide clinical services. Meanwhile, the overall level of medical service and rescue capability of CDC were relatively low (4). Therefore, shifting TB diagnosis and treatment from CDC to general or TB/infectious disease-specific hospitals was an inevitable choice to provide better medical services for patients and to ensure the sustainable development of TB control.
The structural reform of China’s TB treatment service model has experienced a long but efficient process. After piloting in regional areas, the Ministry of Health (now National Health Commission) revised and established the new Regulations for TB Control and Prevention (5) in 2013, which established that designated health facilities should be responsible for diagnosis and treatment for TB patients while CDCs should be responsible for NTP management activities. Some indicators had been influenced at the beginning of the system reform, but they have rebounded and finally exceeded the numbers from before the reform (6). In addition, patient detection and treatment success rate were kept at a high level, which resulted in low mortality rates and the annual decreasing of the incidence rate was relatively more significant than global average (7).
Many counties and districts shared the same regional designated facilities. Some have been unified as one county-level management area in the NTP, but many areas were still independent. Therefore, at the county level, the total number of facilities were less than management areas. Currently, the majority of county level areas have shifted their TB treatment service models to designated general hospitals. After the “trinity model” was established, diagnosed TB patients could get more prompt notification, standard treatment, and effective management. In addition, a considerable part of designated health facilities remained in independent TB dispensaries or chronic disease stations in northeastern PLADs, Beijing, Tianjin, Shandong, Henan, and Guangdong where historically non-hospital TB treatment centers already have strong clinical capacities and less motivation to reform.
There were still many challenges existing in the new treatment model. Even when all public service providers were managed by the government, hospitals had different funding mechanisms in comparison with CDCs. The compensation investment for designated hospitals needed to be rationalized to reduce the economic burden of patients. Furthermore, TB control activities in designated general hospitals might also be influenced by other public health impacts. For example, during the COVID-19 epidemic in early 2020, many TB-designated hospitals were appointed as COVID-19 treating centers, which affected the diagnosis and treatment of TB patients (8). There were also many high-level health facilities that diagnosed more than 800 patients in 2020. These facilities were usually TB or infectious disease-specific hospitals. According to the design of hierarchical diagnosis and treatment, it was more conducive for TB patients to receive medication management and follow-up examinations at county-level designated facilities located in counties where they live in. The large amount of diagnosed patients at high level health facilities might influence the quality of full course patient management.
This study was subject to some limitations. The treatment service models were only evaluated at the county level. The service models at the prefectural and provincial levels should be further investigated and analyzed with patient referral mechanisms and drug resistance control. This study also lacked evaluation of treatment outcomes for each kind of model, which needs to be assessed in the future to better understand the barriers in different settings.
In the light of the requirements of national “Stop TB Action Plan (2019–2022),” the NTP should continue enhancing the collaboration mechanism between TB management institutions and designated health facilities at all levels. NTP also needs to explore more suitable treatment reimbursement mechanism and help them build an efficient referral system to provide quality treatment service for TB patients.
Acknowledgments: All participants of the national TB surveillance system. The China National TB Program and the National Special Science and Technology Project for Major Infectious Diseases of China (2017ZX10201302007).
HTML
FootNote
| ① | Note: TB dispensaries and chronic diseases stations were categorized as one group since they were all government-funded public health providers based on the CDC system. TB dispensaries usually only focused on treatment and management of TB while chronic diseases stations also addressed other conditions like leprosy and sexually transmitted diseases. |
| Citation: |

|